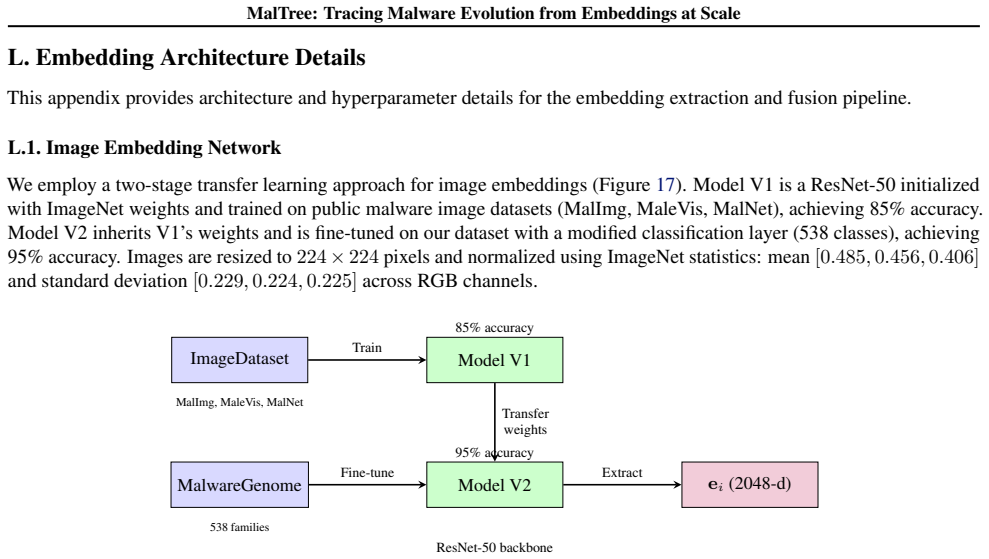
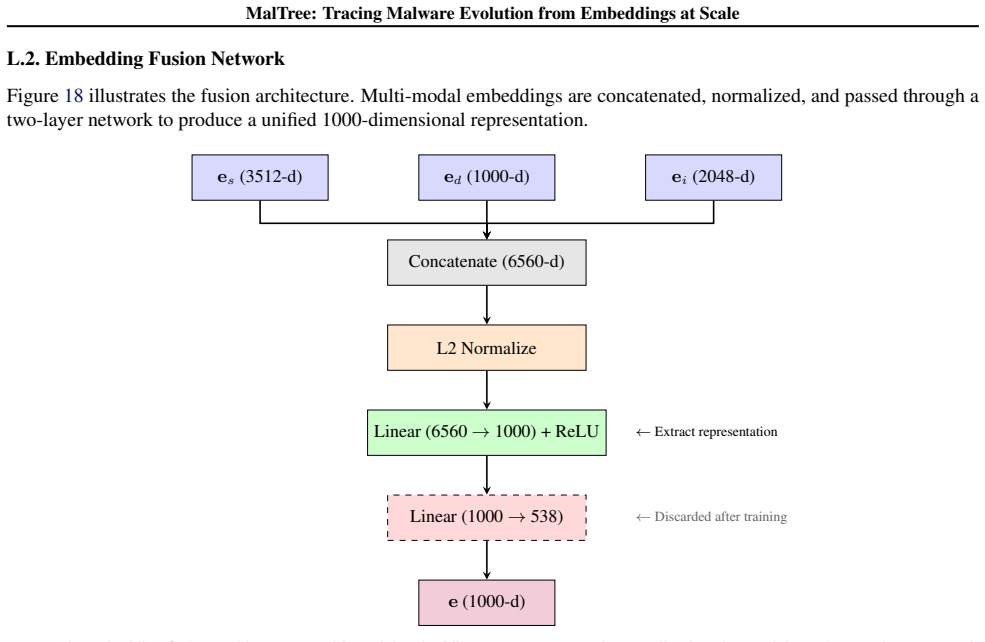
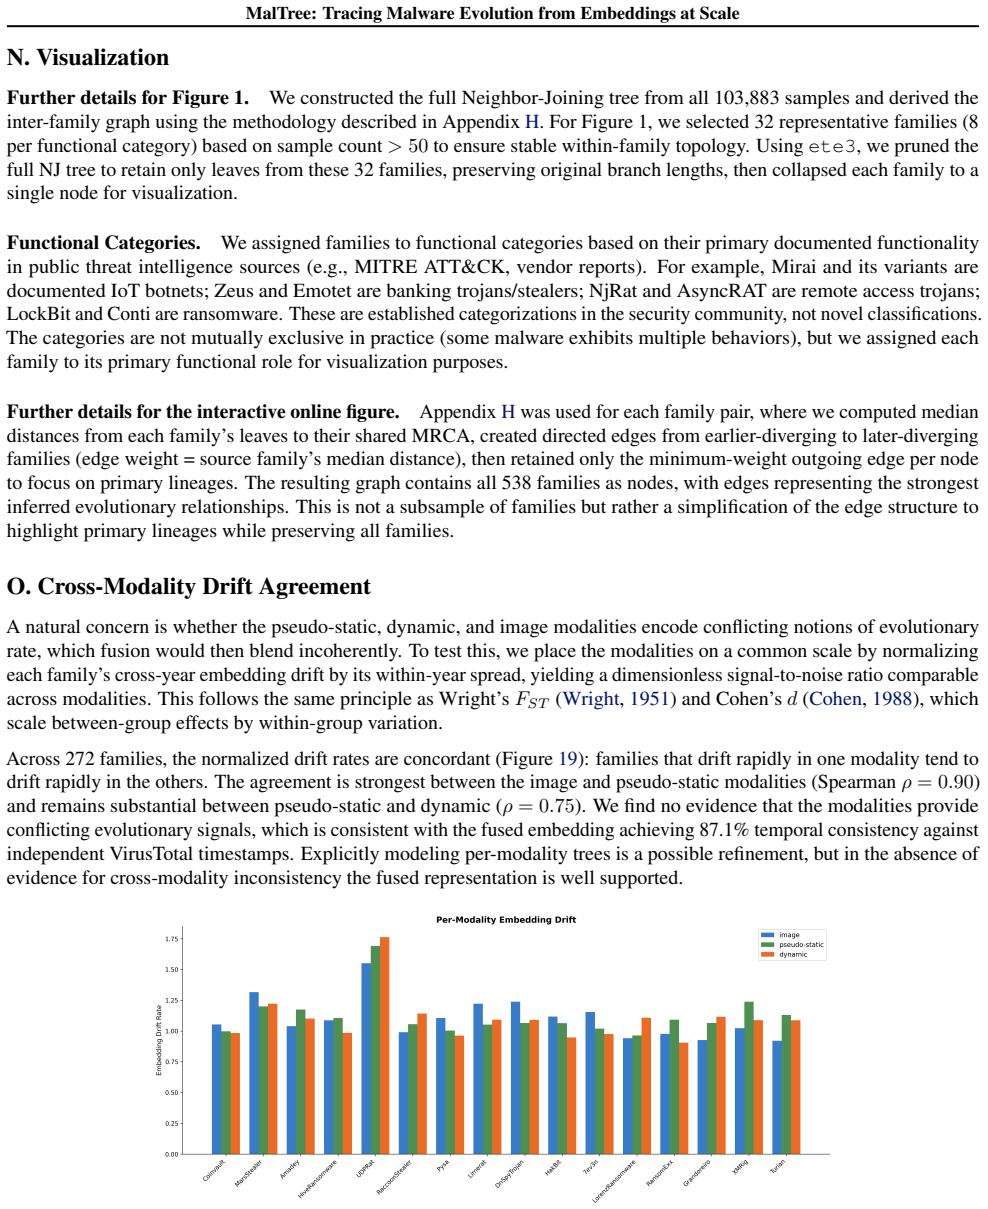
MalTree: Tracing Malware Evolution from Embeddings at Scale
Pith reviewed 2026-06-28 00:17 UTC · model grok-4.3
The pith
MalTree applies phylogenetic techniques to malware embeddings to recover evolutionary relationships that match real timelines in 87 percent of cases.
A machine-rendered reading of the paper's core claim, the machinery that carries it, and where it could break.
Core claim
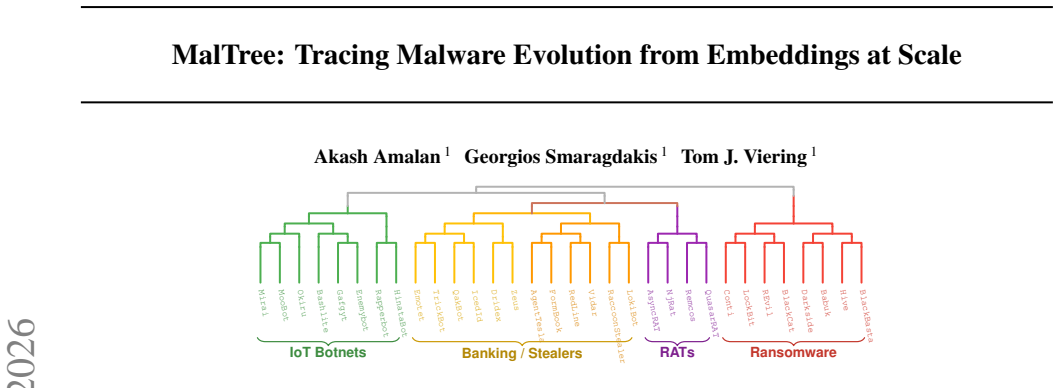
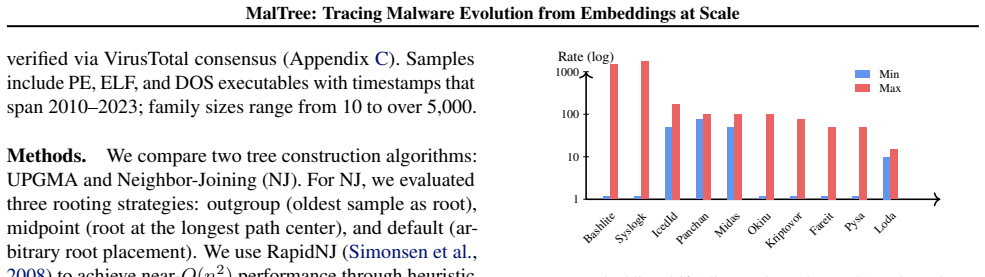
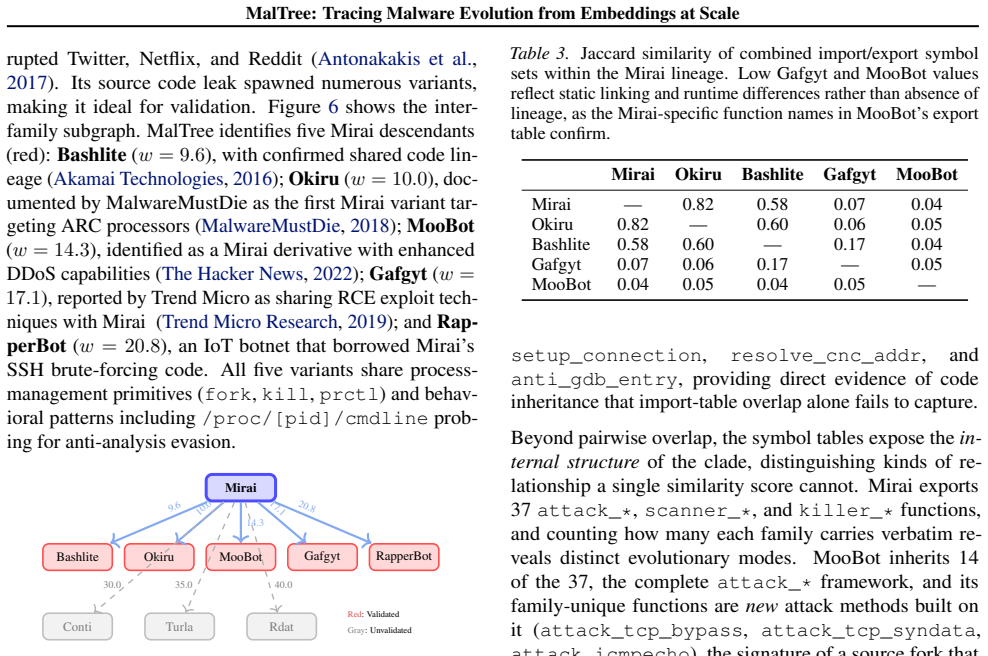
MalTree converts malware samples into embeddings using multiple feature types and applies UPGMA and Neighbor-Joining algorithms to construct phylogenetic trees. When tested, these trees show 87 percent temporal consistency with real-world timelines, and the analysis reveals that mutation rates vary by more than a factor of ten across families. Inferred relationships for cases like the Mirai botnet match documented threat intelligence.
What carries the argument
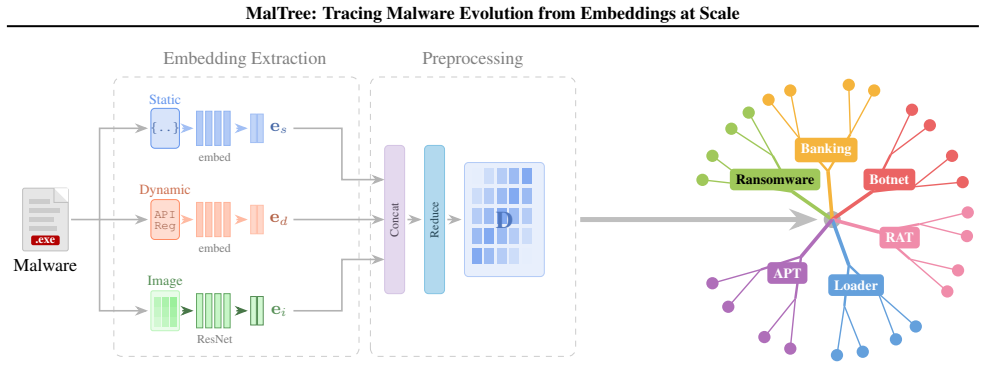
The MalTree framework, which extracts embeddings from structural, behavioral, and image-based features and builds phylogenetic trees using clustering algorithms to infer evolutionary order.
If this is right
- Malware families can be grouped by their evolutionary tempo, allowing detection to be adjusted for fast-mutating ones.
- Inferred trees provide a way to anticipate new variants based on lineage patterns.
- Malware analysis can transition from classifying individual samples to modeling family lineages.
- Phylogenetic validation using timestamps offers a scalable alternative to manual reverse engineering for lineage discovery.
Where Pith is reading between the lines
- The same embedding-to-tree approach might apply to tracking evolution in other domains like software vulnerabilities or network protocols.
- If the method scales, it could integrate with existing ML detectors to flag samples likely to be related to known fast-evolving families.
- Future work could test whether adding more feature types improves consistency beyond 87 percent.
Load-bearing premise
The embeddings built from structural, behavioral, and image-based features contain enough evolutionary signal that phylogenetic algorithms can reconstruct the actual order in which malware families emerged.
What would settle it
Finding a set of malware families where the phylogenetic tree topology built from embeddings places many samples in an order that contradicts their known first-seen timestamps from a reliable source.
Figures
read the original abstract
Malware detection remains largely reactive: machine learning models trained on known samples degrade as threats evolve. Understanding evolutionary relationships among malware families can inform proactive defense, but traditional reverse engineering can take months to years to uncover such lineage relationships. We propose MalTree, a framework that applies bioinformatics inspired phylogenetic techniques (UPGMA and Neighbor-Joining) at scale to model malware evolution automatically using structural, behavioral, and image-based features. We introduce temporal validation using VirusTotal timestamps to assess whether inferred trees reflect actual evolutionary order. MalTree achieves 87% temporal consistency, indicating that inferred evolutionary relationships closely align with real-world emergence timelines. Our analysis shows that some families mutate over 10 times faster than others, suggesting that detection strategies should be tailored to family-specific evolutionary tempos. Case studies, including the Mirai botnet, confirm that inferred relationships from our phylogenetic tree align with documented threat intelligence. Our framework provides a foundation for shifting malware analysis from sample-by-sample classification toward lineage-aware evolutionary modeling.
Editorial analysis
A structured set of objections, weighed in public.
Referee Report
Summary. The manuscript introduces MalTree, a framework that extracts structural, behavioral, and image-based features from malware samples into embeddings and applies phylogenetic tree-construction methods (UPGMA and Neighbor-Joining) to infer evolutionary relationships at scale. It reports 87% temporal consistency between the inferred trees and VirusTotal first-seen timestamps, claims that some families mutate more than 10 times faster than others, and presents case studies (including Mirai) said to align with documented threat intelligence.
Significance. If the temporal validation is robust, the work would supply a scalable, automated approach to lineage-aware malware modeling that could support family-specific detection tuning. The application of established phylogenetic algorithms to large embedding spaces is a clear methodological contribution, though its value hinges on whether the recovered order reflects genuine evolutionary precedence rather than artifacts of the chosen features or validation proxy.
major comments (2)
- [Abstract] Abstract (temporal validation paragraph): the 87% consistency figure is obtained by comparing inferred tree order against VirusTotal first-seen timestamps, yet the manuscript supplies no quantitative controls for the well-documented delays and submission biases in those timestamps (samples often circulate weeks or months before upload, and upload rates vary by family and region). Without such controls or an alternative ground-truth comparison, the reported alignment does not establish that the phylogenetic ordering recovers actual lineage precedence.
- [Abstract] Abstract (feature and method description): the claim that structural, behavioral, and image-based embeddings contain sufficient evolutionary signal for phylogenetic recovery is asserted without an ablation or control experiment that isolates recency-correlated signals (e.g., packing artifacts or behavioral telemetry that may correlate with upload date) from true mutational order. This leaves open the possibility that the distance metric already encodes temporal information, rendering the 87% figure partly tautological.
minor comments (1)
- [Abstract] The abstract states that mutation rates differ by more than 10× but does not define how branch lengths or substitution rates are computed from the trees or normalized across families; a brief methods paragraph or equation would clarify this metric.
Simulated Author's Rebuttal
We thank the referee for their constructive feedback on the validation of MalTree. We address each major comment below and outline planned revisions.
read point-by-point responses
-
Referee: [Abstract] Abstract (temporal validation paragraph): the 87% consistency figure is obtained by comparing inferred tree order against VirusTotal first-seen timestamps, yet the manuscript supplies no quantitative controls for the well-documented delays and submission biases in those timestamps (samples often circulate weeks or months before upload, and upload rates vary by family and region). Without such controls or an alternative ground-truth comparison, the reported alignment does not establish that the phylogenetic ordering recovers actual lineage precedence.
Authors: We agree that VirusTotal timestamps are an imperfect proxy subject to delays and biases. In the revised manuscript we will add a dedicated limitations subsection that quantifies these effects (e.g., timestamp discrepancy distributions across families) and reports sensitivity analyses on high-confidence subsets. No large-scale alternative ground truth for malware lineage order is publicly available, which motivated our choice of proxy; we will make this caveat explicit while retaining the 87% figure as an indicative rather than definitive result. revision: partial
-
Referee: [Abstract] Abstract (feature and method description): the claim that structural, behavioral, and image-based embeddings contain sufficient evolutionary signal for phylogenetic recovery is asserted without an ablation or control experiment that isolates recency-correlated signals (e.g., packing artifacts or behavioral telemetry that may correlate with upload date) from true mutational order. This leaves open the possibility that the distance metric already encodes temporal information, rendering the 87% figure partly tautological.
Authors: The referee correctly identifies the absence of ablations that separate mutational signal from recency-correlated artifacts. We will add these experiments in revision: (1) per-embedding-type trees with separate temporal-consistency scores, (2) controls that shuffle timestamps or mask known recency features (packing, telemetry volume), and (3) comparison against distance metrics that explicitly remove date-correlated dimensions. These additions will clarify whether the recovered order reflects evolutionary precedence beyond feature recency. revision: yes
Circularity Check
No circularity: external timestamps provide independent validation
full rationale
The derivation builds embeddings from structural/behavioral/image features, applies standard phylogenetic algorithms (UPGMA, Neighbor-Joining), and scores the resulting trees against VirusTotal first-seen timestamps to obtain the 87% temporal consistency figure. Because the timestamps are an external, non-derived data source unrelated to the embedding construction or tree inference steps, the reported consistency does not reduce to a fitted parameter, self-definition, or self-citation chain. The central claim therefore remains self-contained against an independent benchmark.
Axiom & Free-Parameter Ledger
axioms (1)
- domain assumption UPGMA and Neighbor-Joining algorithms applied to feature embeddings recover evolutionary order when the features contain phylogenetic signal
Reference graph
Works this paper leans on
-
[1]
In: Mulder, V., Mermoud, A., Lenders, V., Tellenbach, B
URL https://any.run/ . Accessed: 2025- 01-27. Badhwar, R. Polymorphic and metamorphic malware. In The CISO’s Next Frontier: AI, Post-Quantum Cryptog- raphy and Advanced Security Paradigms, pp. 279–285. Springer International Publishing, 2021. doi: 10.1007/97 8-3-030-75354-2 35. Bozkir, A., Cankaya, A., and Aydos, M. Utilization and comparision of convolut...
work page doi:10.1007/97 2025
-
[2]
URL https://www.cisa.gov/news-eve nts/cybersecurity-advisories/aa21-265 a. Accessed: 2025-01-26. CYFIRMA Research. Vidar stealer: An in-depth analysis of an information-stealing malware. CYFIRMA Threat Research, 2024. URL https://www.cyfirma.co m/research/vidar-stealer-an-in-depth -analysis/. Accessed: 2025-01-26. Day, W. and Edelsbrunner, H. Efficient al...
-
[3]
doi: 10.1086/282802. Felsenstein, J. Confidence limits on phylogenies: An ap- proach using the bootstrap.Evolution, 39(4):783–791,
-
[4]
Felsenstein, J.Inferring Phylogenies
doi: 10.1111/j.1558-5646.1985.tb00420.x. Felsenstein, J.Inferring Phylogenies. Sinauer Associates, Sunderland, MA, 2004. ISBN 0-87893-177-5. Freitas, S., Duggal, R., and Chau, D. H. Malnet: A large- scale image database of malicious software. InProceed- ings of the 31st ACM International Conference on In- formation & Knowledge Management, pp. 3948–3952, 2...
-
[5]
doi: 10.1093/molbev/msw046. Huntress Labs. SmokeLoader malware: Analysis, detection, removal. Huntress Threat Library, 2024. URL https: //www.huntress.com/threat-library/mal ware/smokeloader. Accessed: 2025-01-26. Huson, D. H. and Scornavacca, C. A survey of combinato- rial methods for phylogenetic networks.Genome Biology and Evolution, 3:23–35, 11 2010. ...
-
[6]
URL https://www.proofpoint.com/u s/blog/threat-insight/major-botnets-d isrupted-global-law-enforcement-taked own. Accessed: 2025-01-26. Quynh, N. A. Capstone: Next-gen disassembly framework. Black Hat USA, 2014. URL https://www.capsto ne-engine.org. Accessed: 2025-01-27. Raff, E., Barker, J., Sylvester, J., Brandon, R., Catanzaro, B., and Nicholas, C. Mal...
work page doi:10.1080/01 2025
-
[7]
Accessed: 2025-01-26
URL https://www.cyberark.com/res ources/threat-research-blog/chatting -our-way-into-creating-a-polymorphic -malware. Accessed: 2025-01-26. Simonsen, M., Mailund, T., and Pedersen, C. N. S. Rapid neighbour-joining. InAlgorithms in Bioinformatics, vol- ume 5251, pp. 113–122. Springer Berlin Heidelberg,
2025
-
[8]
doi: 10.1007/978-3-540-87361-7 10. Sokal, R. R. and Michener, C. D. A statistical method for evaluating systematic relationships.University of Kansas Science Bulletin, 38:1409–1438, 1958. Suarez-Tangil, G., Tapiador, J. E., Peris-Lopez, P., and Blasco, J. Dendroid: A text mining approach to analyzing and classifying code structures in Android malware fami...
-
[9]
doi: 10.1016/j.eswa.2013.07.106. Sultanik, E. bin2png: Converts arbitrary binary data to RGB image. GitHub Repository, 2020. URL https: //github.com/ESultanik/bin2png. Accessed: 2025-01-26. The Hacker News. New Moobot botnet exploiting Hikvision camera vulnerability. The Hacker News, 2022. URL https://thehackernews.com/2022/12/mo obot-botnet.html. Accesse...
-
[10]
doi: 10.1109/INNOV ATIONS.2012.6 207739
IEEE, 2012. doi: 10.1109/INNOV ATIONS.2012.6 207739. VirusTotal. VirusTotal. Google Cloud, 2012. URL ht tps://www.virustotal.com . Founded 2004 by Hispasec Sistemas; acquired by Google 2012. Accessed: 2025-01-26. 12 MalTree: Tracing Malware Evolution from Embeddings at Scale VMRay. Malware analysis spotlight: Smoke Loader. VM- Ray Blog, 2024. URL https://...
-
[11]
Identify immediate parent nodea
-
[12]
Find all sibling pairs(s i, sj)descending froma
-
[13]
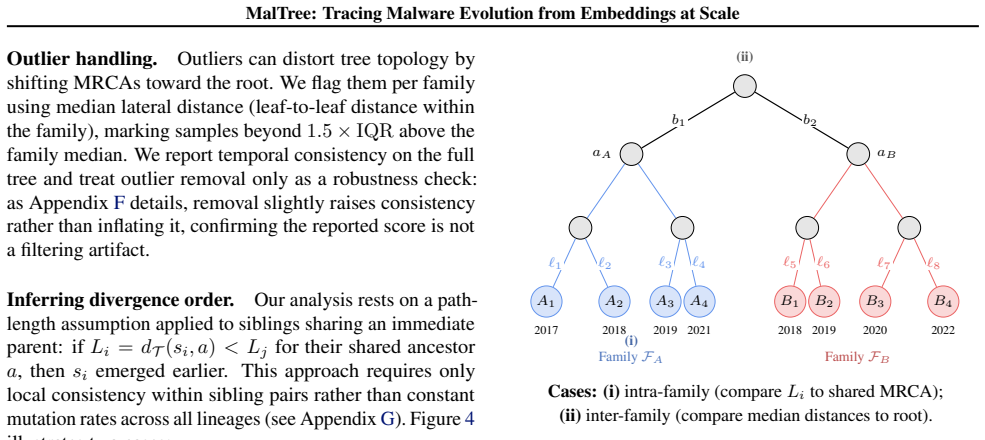
For each pair: • ComputeL i =d T (si, a)andL j =d T (sj, a) • Get timestampst(s i)andt(s j)from VirusTotal • Check:(L i < L j ∧t(s i)< t(s j))or(L i > L j ∧t(s i)> t(s j))
-
[14]
Temporal consistency = proportion of consistent pairs Our 87% temporal consistency confirms the assumption holds in practice. H. Inter-Family Analysis This section explains our methodology for inferring evolutionary relationships between malware families and constructing the inter-family graphs shown in case studies. H.1. Motivation When comparing differe...
-
[15]
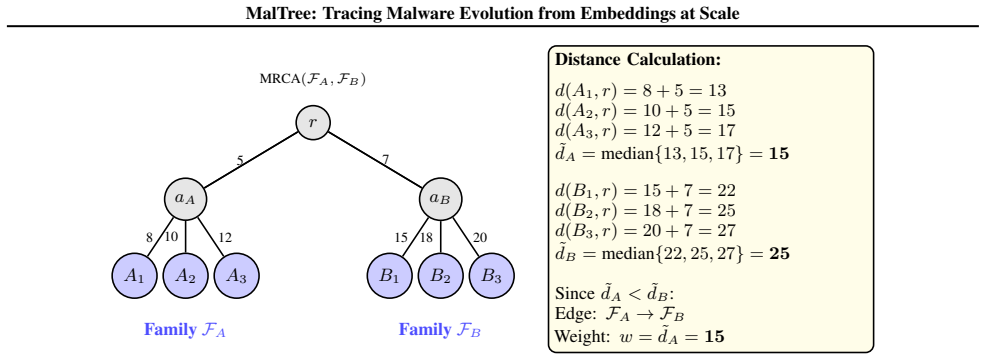
Identify their shared MRCA:r=MRCA(F A,F B)
-
[16]
Compute the path distance fromrto each leaf in both families 21 MalTree: Tracing Malware Evolution from Embeddings at Scale
-
[17]
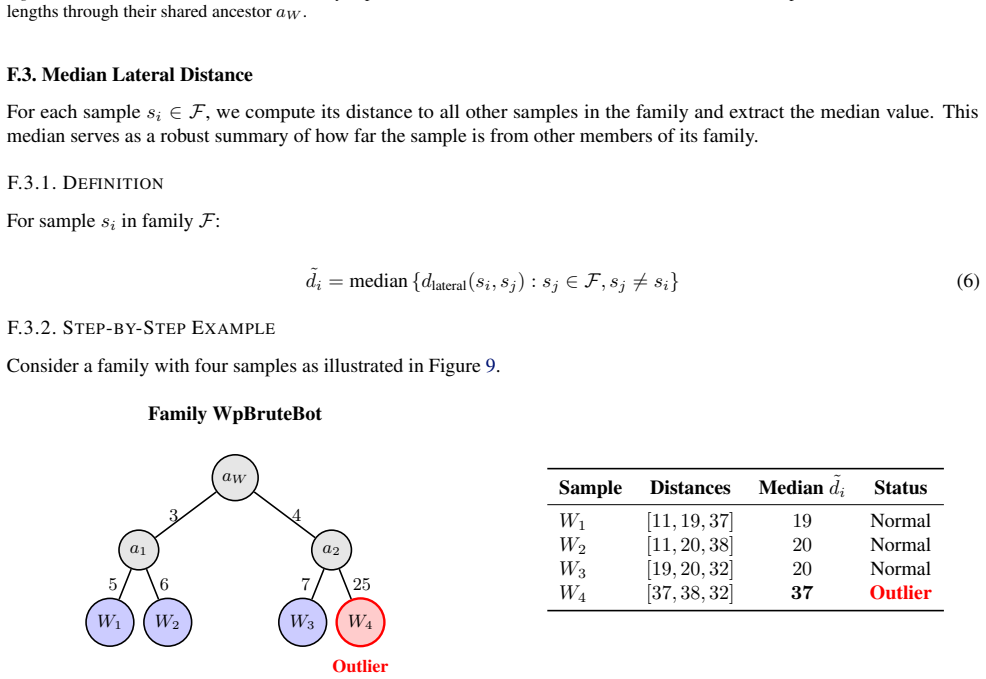
The median represents the “typical” evolutionary depth for each family
Calculate the median distance for each family: ˜dA =median{d T (s, r) :s∈ F A}(11) ˜dB =median{d T (s, r) :s∈ F B}(12) The median is chosen for robustness (Rousseeuw & Croux, 1993): each family contains many samples at varying distances, and the mean would be sensitive to extreme values. The median represents the “typical” evolutionary depth for each fami...
1993
-
[18]
• Our approach: Retains theminimum-weight outgoing edge from each node, preserving edge directionality (from earlier- diverging to later-diverging families)
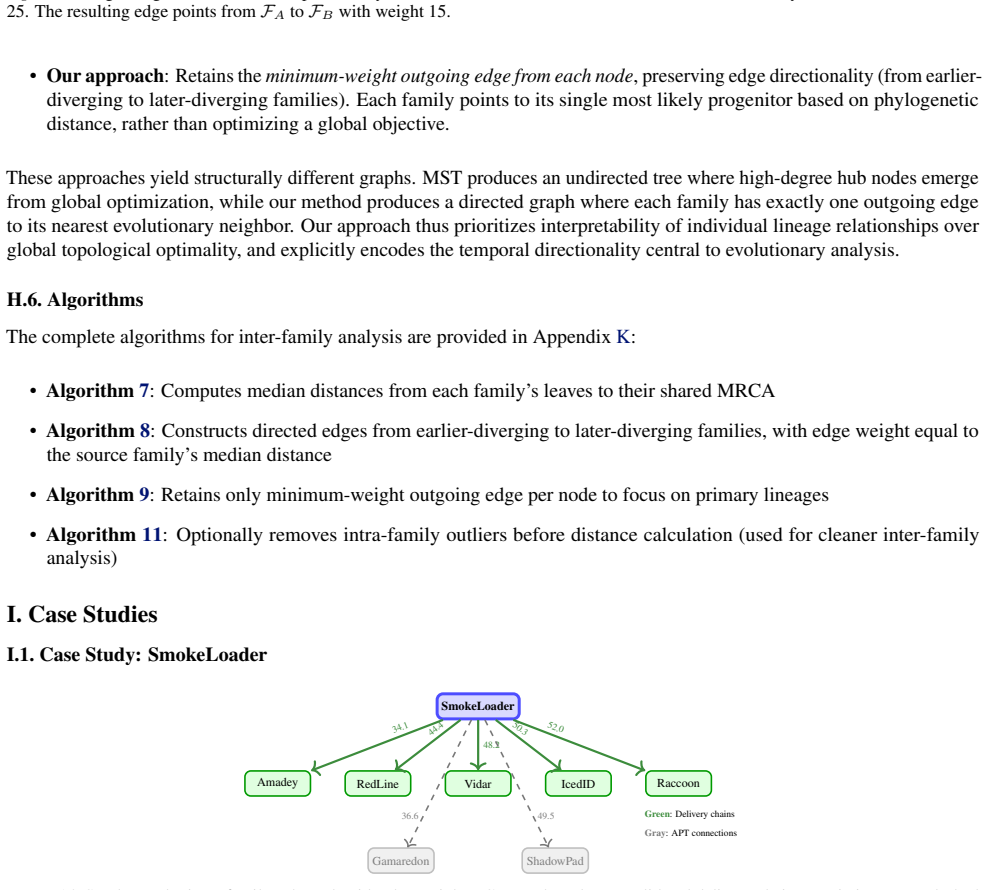
The resulting edge points fromF A toF B with weight 15. • Our approach: Retains theminimum-weight outgoing edge from each node, preserving edge directionality (from earlier- diverging to later-diverging families). Each family points to its single most likely progenitor based on phylogenetic distance, rather than optimizing a global objective. These approa...
2011
discussion (0)
Sign in with ORCID, Apple, or X to comment. Anyone can read and Pith papers without signing in.