REVIEW 3 major objections 5 minor 36 references
Modeling the Optical Properties of Biological Structures using Symbolic Regression
T0 review · 3 major / 5 minor · reviewed 2026-08-07 · deepseek-v4-flash
Pith's one-line read Symbolic regression can extract a closed-form refractive-index model for a biological multilayer from a single reflectance spectrum.
desk verdict A credible symbolic-regression pipeline for dispersion-model retrieval, with solid synthetic validation but an experimental demonstration that overreaches on identifiability. read the letter →
The pith
A machine-rendered reading of the paper's core claim, the machinery that carries it, and where it could break.
The reading
What carries the argument
The load-bearing mechanism is the coupling of a symbolic-regression search, where a recurrent neural network proposes algebraic expressions and genetic operations refine them, to dimensional analysis that rejects unit-inconsistent candidates, with the Berreman 4x4 S-matrix model as the evaluation oracle: each candidate refractive-index expression nSR(λ) is inserted into the multilayer model, its reflectance is computed, and the result is compared with the target spectrum via root-mean-square error. The central objects are the candidate dispersion expressions nSR(λ) or εSR(λ), the Berreman matrix whose eigenvalues give the z-propagation constants, and the S-matrix cascading rule that assembles partial scattering matrices into a stable global response. The search space is deliberately limited to the four basic arithmetic operations plus a few dimensioned constants, which the authors find sufficient for transparent dielectric behavior in the visible range.
What would settle it
Feed the method a reflectance spectrum synthesized from a deliberately different refractive-index law, such as a strongly dispersive or absorbing model with a resonance in the visible range, while keeping the same multilayer geometry; if the method returns a low-error Cauchy-like closed form rather than detecting the resonance structure, the inversion is merely fitting a flexible family rather than identifying the actual dispersion law. Alternatively, measure the refractive index of the same beetle elytron material independently, for example by ellipsometry on a flat section, and check whether the SR-retrieved nSR matches it within the claimed accuracy.
Extended reading notes
Core claim
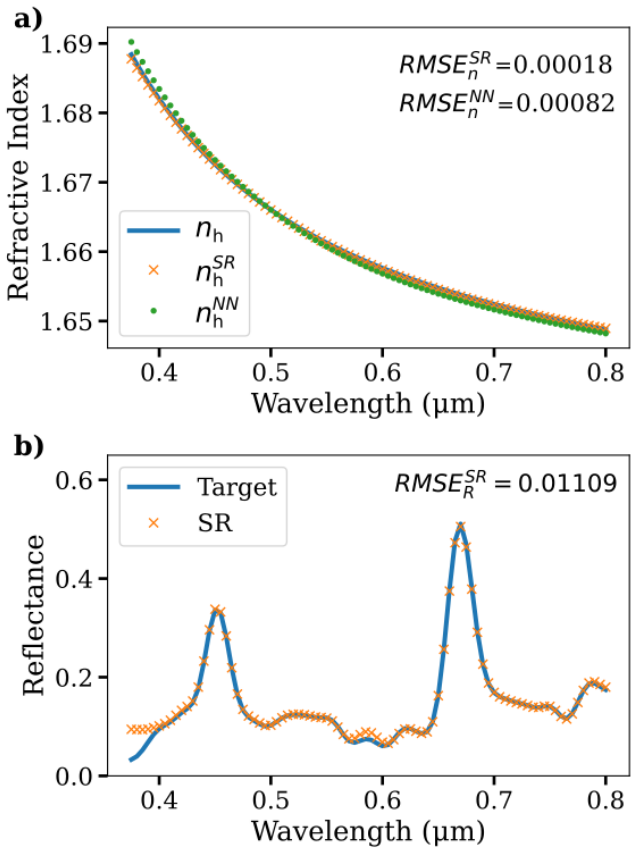
Using the Berreman 4x4 matrix method as the forward model inside the symbolic-regression loop, the authors invert reflectance spectra to retrieve the refractive-index function of the high-index layer in a periodic multilayer. In the nacre cases, the regression recovers the Sellmeier benchmark through numerically equivalent Cauchy-type expressions, and the anisotropic case separately retrieves ordinary and extraordinary indices. In the beetle case, working from a single experimental reflectance spectrum, the method returns an expression that reproduces the measured spectrum at least as well as the previously reported Cauchy model, and it also rediscovers the constant-index value reported earlier. The authors note that an expression can have low regression error without physical meaning, and that an expression can be physically meaningful without being the best fit, so the selection procedure uses repetition across independent realizations to identify models that recur.
Load-bearing premise
The load-bearing premise is that the Berreman forward model with the assumed flat, periodic multilayer geometry, fixed layer thicknesses, period count, incident angle, and optical-axis orientation, exactly represents the physical structure being measured; for the beetle elytron the authors acknowledge this is a simplification, so any mismatch between the real structure and the model would make the retrieved expression a fitting artifact rather than the true material refractive index.
Editorial extensions
If this is right
- If one spectrum suffices, dispersion models can be extracted for materials or structures where no refractive-index library or database exists.
- The recovered expressions are dimensionally homogeneous, so they can be used directly in other simulation contexts without unit inconsistencies.
- Because symbolic regression outputs readable formulas, the retrieved model can be compared with or interpreted as established physical models such as Cauchy and Sellmeier forms, making the inversion a transparent-box procedure rather than a black box.
- In anisotropic multilayers, the method can separately retrieve ordinary and extraordinary indices from a single unpolarized spectrum, at least for the tested geometry.
- In experimental settings with imperfect geometry, the retrieved expression is the best numerical fit under the assumed model, not necessarily the true material dispersion, so geometric fidelity determines whether the formula is physically meaningful.
- The method requires only basic arithmetic operations for transparent dielectrics, suggesting that more complex operations can be reserved for absorbing or metallic systems.
Reading between the lines
- The single-spectrum sufficiency likely trades on the strong constraint of the forward model; a natural extension would be to test identifiability by scanning over unknown layer thicknesses simultaneously with the dispersion law, or by using multiple incidence angles to break degeneracies.
- The recurrence of the same algebraic forms across independent random seeds suggests that a consistency-based metric, rather than RMSE alone, should guide model selection; this could be formalized as a Pareto criterion balancing complexity, dimensional soundness, and occurrence frequency.
- The method as demonstrated is specific to transparent dielectrics because the allowed operations were only {+, -, *, /} and no absorption terms; extending to metals or absorbers would require adding oscillator or complex-valued building blocks, and the search would then need to respect Kramers-Kronig consistency.
- The beetle result hints that the retrieved formula absorbs systematic structural errors such as roughness and thickness variation into the effective index; comparing SR-inverted indices with independent ellipsometry on the same material would separate structural error from material dispersion.
Editorial analysis
A structured set of objections, weighed in public.
Referee Report
Summary. The paper applies the PhySO symbolic-regression library, coupled with a Berreman 4x4 forward solver, to retrieve closed-form dispersion models for the refractive index of materials in biological multilayer structures from reflectance spectra. Three case studies are presented: a synthetic nacre multilayer with isotropic aragonite, a synthetic nacre multilayer with anisotropic uniaxial aragonite, and an experimentally measured Chrysochroa jewel beetle elytron. The authors report the retrieved expressions along with fit metrics (RMSE_R and RMSE_n) and consistency metrics (Presence and Occurrence) over 35 independent realizations. They conclude that the method yields readable, dimensionally homogeneous expressions, including Cauchy-like forms, and that physically interpretable models can be recovered without prior assumptions about functional form.
Significance. If the central claim is validated, the work is a useful contribution to bioinspired photonics: it would allow extraction of an analytical dispersion model from a single reflectance spectrum, without the large training databases required by neural-network approaches. The synthetic validation is a genuine strength: the targets are independent Sellmeier models, the retrieved expressions are compared with the benchmark through RMSE_n, and the anisotropic case tests the pipeline beyond the isotropic setting. The paper also deserves credit for reporting multiple realizations and for explicitly acknowledging limitations of the simplified flat-multilayer geometry. However, as discussed in the major comments, the inverse problem's non-uniqueness and the post hoc selection of a physically meaningful model are unresolved, and these issues directly affect the strength of the central claim.
major comments (3)
- [§IV.C, Table V] The inverse problem n(λ) -> R(λ) is not identifiable from a single reflectance spectrum, and the manuscript provides no analysis of this non-uniqueness. Table V itself demonstrates the issue: four algebraically different models (n51, n52 = 1.68, n53, and the Cauchy-like n54) all satisfy the stated acceptance threshold RMSER < 0.05, with RMSER values between 0.02238 and 0.02686. Thus the best-fitting model is not unique, and the abstract's wording that the method retrieves expressions with physical meaning is stronger than the evidence supports. Please add an identifiability and robustness analysis (for example, synthetic experiments with alternative dispersion laws, noise-perturbed spectra, or multi-angle/multi-polarization inputs) and temper the retrieval language accordingly.
- [§IV.C, Table V and Fig. 7] The selection of the Cauchy-like model n54 as a physically meaningful result is post hoc. n54 has Presence 2 of 35, Occurrence 0.6%, and the highest RMSER in Table V, yet it is highlighted because its coefficients match Ref. [22]. Without prior knowledge of Ref. [22], the natural selection by either fit or consistency would be n51. If the paper claims that SR can rediscover known dispersion models, it must state a principled, a priori selection criterion (for example, a Pareto criterion balancing complexity and fit, or a parsimony prior) rather than selecting the expression that happens to resemble literature values.
- [§IV.A and Eq. (8)] All reported RMSER values are computed on the same spectrum that was used for fitting, so they are training metrics rather than measures of predictive performance. For the synthetic cases, RMSE_n against the known Sellmeier benchmark provides some independent check, but for the experimental beetle case there is no held-out validation or uncertainty quantification on the retrieved coefficients. The Gaussian smoothing with standard deviation σ = 2 that is applied to the synthetic target spectra is also not analyzed for its effect on the retrieved expressions. Please include a cross-validation or noise-sensitivity study and report the dispersion of coefficients across the 35 realizations.
minor comments (5)
- [§III.B, Eq. (8)] The definition of RMSER is written with the outer sum over M outside the square root, which reads as the sum of per-spectrum RMSE values; since M = 1 in all cases this does not affect the results, but the notation should be clarified to avoid ambiguity.
- [§IV.A, Fig. 4] The comparison with a neural network is not apples-to-apples: the NN is trained on 10,000 synthetic spectra generated with the same forward model and then tested on a spectrum from that model, while the SR method uses only one spectrum. This comparison does not establish a general advantage and could be removed or reframed as an illustration of database requirements rather than accuracy.
- [§IV.C] The text says the SR can find physically interpretable expressions, while the same section later states that an expression 'may not have physical meaning because this characteristic does not imply the best fit of the chosen metric.' These statements should be reconciled, since Table V shows that the best-fitting and most frequently retrieved models are not the ones with obvious physical interpretation.
- [§IV.A, Table II] The sentence 'The fourth equation in Table II is similar to Eq. 13, except for the third missing term' is slightly confusing: Eq. (13) has three terms in 1, 1/λ^2, and 1/λ^4, while the fourth expression in Table II has only two terms; it would be clearer to call it a truncated Cauchy-like form.
- [§II] The optical axis is assumed to lie in the xy plane at angle ϕ, and the anisotropic case later sets ϕ = 45°, but the manuscript does not discuss how ϕ would be known for a real biological sample; a brief comment that ϕ is part of the assumed geometry would be useful.
Circularity Check
No significant circularity: the retrieved dispersion models are evaluated against independent Sellmeier benchmarks and external literature values, not against their own fitting inputs.
full rationale
The paper's derivation chain is self-contained and does not reduce to its inputs. In the synthetic nacre cases, the target reflectance spectra are generated from independent Sellmeier dispersion models (Eqs. 10 and 14), and the symbolic-regression candidates are scored by their ability to reproduce those spectra through the Berreman forward model. Using the same forward model to generate targets and to evaluate candidates is a standard controlled inversion setup, not circularity: the target spectra are fixed inputs, and the retrieved expressions are fitted to match them, with the benchmark refractive indices used only for external comparison. The beetle case uses an experimentally measured reflectance spectrum, and the retrieved Cauchy-like model is checked against refractive-index values reported in Ref. [22]; this is an external validation, not a circular one. The self-citations to the authors' earlier work [14-16] are contextual and do not carry the load of the central claim; the core tools, PhySO and PyMoosh, are external open-source libraries with independent documentation. No fitted parameter is renamed as a prediction, no uniqueness theorem is imported from the authors, and no ansatz is smuggled in via citation. The paper's own limitation statements about the simplified flat-multilayer geometry and the existence of multiple acceptable expressions are correctness and identifiability concerns, not circularity, and they do not make the derivation equivalent to its inputs.
Assumptions & free parameters
free parameters (3)
- PhySO allowed constants A, B, C, D =
optimized per run
- Retrieved dispersion coefficients (e.g., a13, b13, a21, b21, c21, a51, b51, c51) =
a13=1.638, b13=0.007 um^2; a21=2.657, b21=0.038 um, c21=-0.178 um; a51=2.483, b51=1.969 um, c51=-2.964 um; others in…
- Gaussian filter standard deviation sigma =
2
assumptions (5)
- standard math Berreman 4x4 with S-matrix cascade is an exact solver for the stratified anisotropic multilayer.
- domain assumption The biological structures are periodic bilayers with known thicknesses, period count, and incident angle (nacre: dh=400 nm, dl=50 nm, Nn=100 or 10, theta_i=45 degrees; beetle: dl=73 nm, dh=90 nm, Nn=5, theta_i=0 degrees).
- domain assumption The benchmark Sellmeier equations (Eq. 10 and 14) accurately describe aragonite's ordinary and extraordinary indices in the visible range.
- domain assumption Only a single reflectance spectrum (average of Rss and Rpp) at one angle is sufficient to uniquely determine the dispersion model.
- ad hoc to paper The materials are non-absorbing transparent dielectrics, so the refractive index is real and smooth, and Cauchy-like polynomial forms using only basic operations are adequate.
Cite this review
Pith. "Pith review of Modeling the Optical Properties of Biological Structures using Symbolic Regression." pith.science (2026). https://pith.science/paper/CS5PZRIG
@misc{pith2026250601862,
  author       = {Pith},
  title        = {Pith review of: Modeling the Optical Properties of Biological Structures using Symbolic Regression},
  year         = {2026},
  howpublished = {\url{https://pith.science/paper/CS5PZRIG}},
  note         = {Machine review of arXiv:2506.01862}
}
read the original abstract
We present a Machine Learning approach based on Symbolic Regression to derive, from either numerically generated or experimentally measured spectral data, closed-form expressions that model the optical properties of biological materials. To evaluate the performance of our approach, we consider three case studies with the aim of retrieving the refractive index of the materials that constitute the biological structures considered. The results obtained show that, in addition to retrieving readable and dimensionally homogeneous dispersion models, the expressions found have a physical meaning and their algebraic form is similar to that of the models used to characterize the dispersive behavior of transparent dielectrics in the visible region.
Figures


Figures from the paper (5 more)



Reference graph
Works this paper leans on
-
[22]
S. Yoshioka and S. Kinoshita, Direct determination of the refractive index of natural multilayer systems, Phys. Rev. E 83, 051917 (2011)
work page 2011
-
[1]
J. R. Koza, Genetic programming as a means for programming computers by natural selection, Statistics and computing 4, 87 (1994)
work page 1994
-
[2]
L. Billard and E. Diday, Symbolic regression analysis, in Classification, Clustering, and Data Analysis (Springer Berlin Heidelberg, 2002) pp. 281–288
work page 2002
-
[3]
D. Angelis, F. Sofos, and T. E. Karakasidis, Artificial intelligence in physical sciences: Sym- bolic regression trends and perspectives, Arch. Comput. Methods Eng. , 1 (2023), pMID: 37359747
work page 2023
-
[4]
Accelerating Understanding of Scientific Experiments with End to End Symbolic Regression
N. Ar´ echiga, F. Chen, Y.-Y. Chen, Y. Zhang, R. Iliev, H. Toyoda, and K. Lyons, Accel- erating understanding of scientific experiments with end to end symbolic regression, arXiv abs/2112.04023 (2021), arXiv:2112.04023 [cs.LG]
work page Pith review arXiv 2021
-
[5]
D. Minh, H. X. Wang, Y. F. Li, and T. N. Nguyen, Explainable artificial intelligence: a comprehensive review, Artif. Intell. Rev. 55, 3503 (2022)
work page 2022
-
[6]
M. Schmidt and H. Lipson, Symbolic regression of implicit equations, in Genetic Programming Theory and Practice VII (Springer US, Boston, MA, 2010) pp. 73–85
work page 2010
-
[7]
M. Cranmer, A. S. Gonzalez, P. Battaglia, R. Xu, K. Cranmer, D. Spergel, and S. Ho, Discov- ering symbolic models from deep learning with inductive biases, in Adv. Neural Inf. Process. Syst., Vol. 33 (Curran Associates, Inc., 2020) pp. 17429–17442
work page 2020
Show all 36 references
-
[8]
Kammerer, G
L. Kammerer, G. Kronberger, and S. Winkler, Bias and variance analysis of contemporary symbolic regression methods, Applied Sciences 14, 10.3390/app142311061 (2024)
2024 doi
-
[9]
Virgolin and S
M. Virgolin and S. P. Pissis, Symbolic regression is np-hard (2022), arXiv:2207.01018 [cs.NE]
2022 arXiv
-
[10]
S. M. Udrescu and M. Tegmark, Ai feynman: A physics-inspired method for symbolic regression, Science Advances 6, eaay2631 (2020), https://www.science.org/doi/pdf/10.1126/sciadv.aay2631
2020 doi
-
[11]
Makke and S
N. Makke and S. Chawla, Interpretable scientific discovery with symbolic regression: a review, Artificial Intelligence Review 57, 2 (2024)
2024
-
[12]
Tenachi, R
W. Tenachi, R. Ibata, and F. I. Diakogiannis, Deep symbolic regression for physics guided by units constraints: Toward the automated discovery of physical laws, The Astrophysical Journal 959, 99 (2023). 26
2023
-
[13]
Tenachi, R
W. Tenachi, R. Ibata, T. L. Fran¸ cois, and F. I. Diakogiannis, Class symbolic regression: Gotta fit ’em all, Astrophys. J. Lett. 969, L26 (2024)
2024
-
[14]
Q. Li, D. Macias, and A. Vial, Modeling the optical properties of transparent and absorbing dielectrics by means of symbolic regression, Optics Express 30, 41862 (2022)
2022
-
[15]
Sierra-V´ elez, D
J. Sierra-V´ elez, D. Macias, A. Vial, and M. A. Giraldo, Retrieving the refractive index of a biological material via symbolic regression, in 19th Nordic-Baltic Conf. on Biomedical Eng. and Med. Phys. (Springer Nature Switzerland, Cham, 2023) pp. 377–384
2023
-
[16]
Sierra-Velez, M
J. Sierra-Velez, M. Inchaussandague, D. Skigin, A. Vial, H. H¨ olscher, and D. Macias, Symbolic regression: an alternative method to model the optical response of photonic biological and bio-inspired structures, Opt. Lett. 49, 6753 (2024)
2024
-
[17]
Kinoshita, S
S. Kinoshita, S. Yoshioka, and J. Miyazaki, Physics of structural colors, Reports on Progress in Physics 71, 076401 (2008)
2008
-
[18]
J. Sun, B. Bhushan, and J. Tong, Structural coloration in nature, RSC Adv. 3, 14862 (2013)
2013
-
[19]
Tadepalli, J
S. Tadepalli, J. M. Slocik, M. K. Gupta, R. R. Naik, and S. Singamaneni, Bio-optics and bio-inspired optical materials, Chemical Reviews 117, 12705 (2017)
2017
-
[20]
Askarinejad and N
S. Askarinejad and N. Rahbar, Toughening mechanisms in bioinspired multilayered materials, Journal of The Royal Society Interface 12, 20140855 (2015)
2015
-
[21]
K. S. Katti and D. R. Katti, Why is nacre so tough and strong?, Materials Science and Engineering: C 26, 1317 (2006), proceedings of the First TMS Symposium on Biological Materials Science
2006
-
[23]
Madhav, B
D. Madhav, B. Buffel, P. Moldenaers, F. Desplentere, and V. Vandeginste, A review of nacre- inspired materials: Chemistry, strengthening-deformation mechanism, synthesis, and applica- tions, Progress in Materials Science 139, 101168 (2023)
2023
-
[24]
Lertvachirapaiboon, T
C. Lertvachirapaiboon, T. Parnklang, P. Pienpinijtham, K. Wongravee, C. Thammacharoen, and S. Ekgasit, Selective colors reflection from stratified aragonite calcium carbonate plates of mollusk shells, Journal of Structural Biology 191, 184 (2015), copyright © 2015 Elsevier Inc...
2015
-
[25]
Lertvachirapaiboon, P
C. Lertvachirapaiboon, P. Pienpinijtham, K. Wongravee, and S. Ekgasit, Optical properties of individual aragonite plates from nacre, ChemistrySelect 3, 11700 (2018), https://chemistry- 27 europe.onlinelibrary.wiley.com/doi/pdf/10.1002/slct.201801566
2018 doi
-
[26]
N. Fan, C. Zhou, and E. Myagkaya, Investigation of nacre nanostructure by analyzing its structural color pattern, Scientific Reports 11, 19686 (2021)
2021
-
[27]
C. M. Pina, A. G. Checa, C. I. Sainz-Diaz, and J. H. Cartwright, Nacre: An ancient nanos- tructured biomaterial, ActaFutura 10.2420/AF06.2013.37 (2013)
2013 doi
-
[28]
J. A. Noyes, P. Vukusic, and I. R. Hooper, Experimental method for reliably establishing the refractive index of buprestid beetle exocuticle, Opt. Express 15, 4351 (2007)
2007
-
[29]
D. G. Stavenga, B. D. Wilts, H. L. Leertouwer, and T. Hariyama, Polarized iridescence of the multilayered elytra of the japanese jewel beetle, chrysochroa fulgidissima, Philosophical Transactions of the Royal Society B: Biological Sciences 366, 709 (2011)
2011
-
[30]
Yoshioka, S
S. Yoshioka, S. Kinoshita, H. Iida, and T. Hariyama, Phase-adjusting layers in the multilayer reflector of a jewel beetle, Journal of the Physical Society of Japan 81, 054801 (2012)
2012
-
[31]
D. W. Berreman, Optics in stratified and anisotropic media: 4 ×4-matrix formulation, J. Opt. Soc. Am. 62, 502 (1972)
1972
-
[32]
Stallinga, Berreman 4 × 4 matrix method for reflective liquid crystal displays, Journal of applied physics 85, 3023 (1999)
S. Stallinga, Berreman 4 × 4 matrix method for reflective liquid crystal displays, Journal of applied physics 85, 3023 (1999)
1999
-
[33]
Yeh and M
P. Yeh and M. Hendry, Optical waves in layered media, Phys. Today 43, 77 (1990)
1990
-
[34]
Langevin, P
D. Langevin, P. Bennet, A. Khaireh-Walieh, P. Wiecha, O. Teytaud, and A. Moreau, Pymoosh: a comprehensive numerical toolkit for computing the optical properties of multilayered struc- tures, J. Opt. Soc. Am. B 41, A67 (2024)
2024
-
[35]
Li, Use of fourier series in the analysis of discontinuous periodic structures, J
L. Li, Use of fourier series in the analysis of discontinuous periodic structures, J. Opt. Soc. Am. A 13, 1870 (1996)
1996
-
[36]
Ghosh, Dispersion-equation coefficients for the refractive index and birefringence of calcite and quartz crystals, Optics Communications 163, 95 (1999)
G. Ghosh, Dispersion-equation coefficients for the refractive index and birefringence of calcite and quartz crystals, Optics Communications 163, 95 (1999). 28
1999
Reviewed August 7, 2026 · model on record in the stance chip above.
Discussion (0). Continue with ORCID to comment.