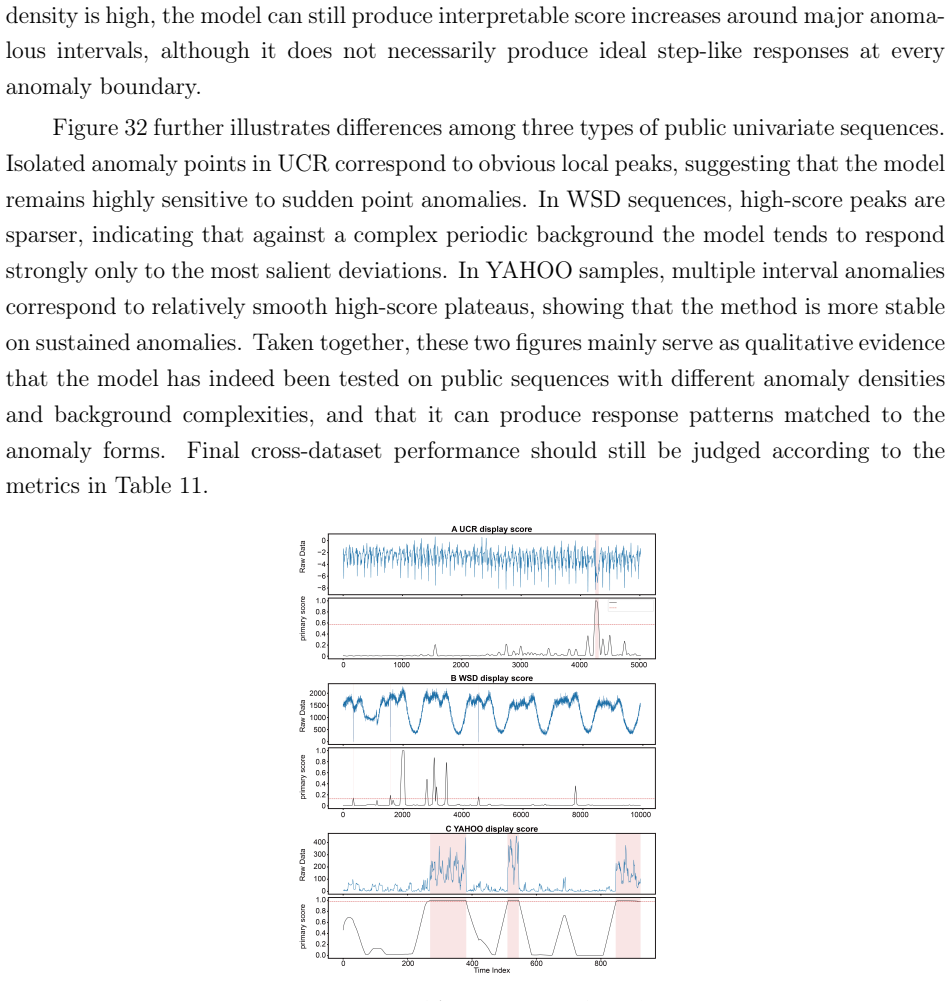
TPA-AD: A Two-Stage Pseudo Anomaly-Guided Method for Bearing Time-Series Anomaly Detection
Pith reviewed 2026-06-28 11:13 UTC · model grok-4.3
The pith
A two-stage method generates pseudo-anomalies near the normal boundary to learn anomaly-sensitive representations for time-series detection using only normal training data.
A machine-rendered reading of the paper's core claim, the machinery that carries it, and where it could break.
Core claim
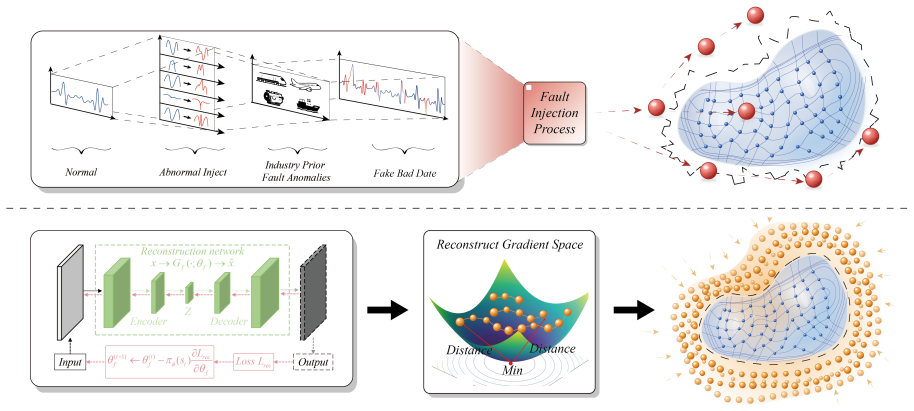
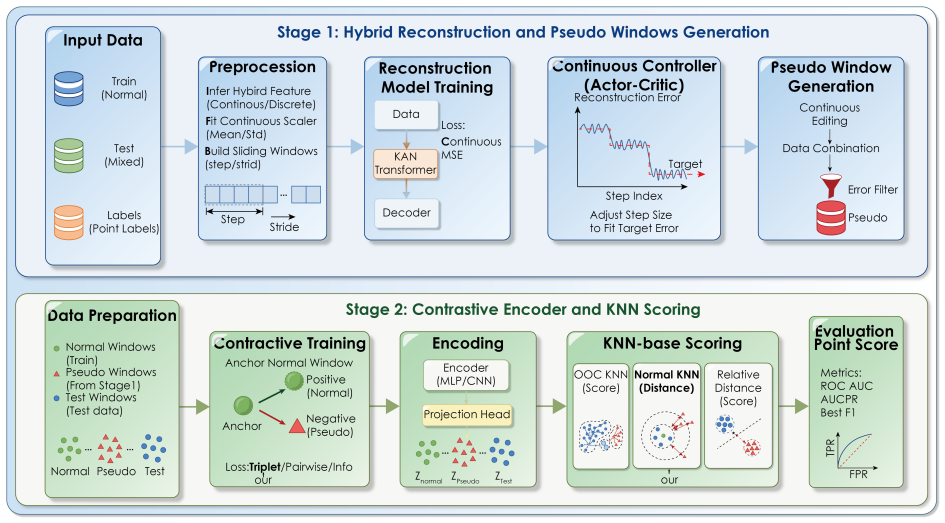
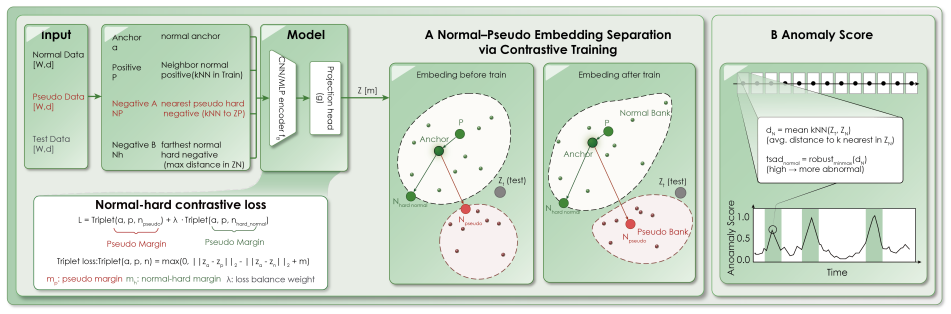
The central claim is that constructing pseudo-anomalous windows near the normal boundary using a reconstruction model and per-feature target-error control, followed by contrastive learning between normal and pseudo-anomalous windows and KNN-based scoring, improves the separability of the normal boundary and enables effective anomaly detection in mixed-variable time-series scenarios without requiring real anomaly examples or known fault categories.
What carries the argument
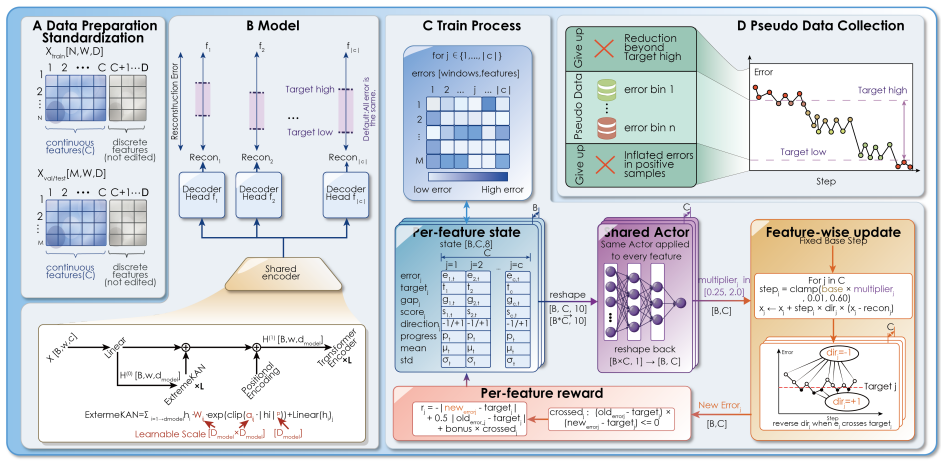
The pseudo-anomaly generation step that places synthetic anomalies in boundary neighborhoods through reconstruction and per-feature error control, which then supplies the contrastive pairs for learning anomaly-sensitive representations.
If this is right
- The method produces relatively stable anomaly responses across bearing fault detection and degradation process datasets.
- It remains sensitive to the evolution of degradation in the time-series signals.
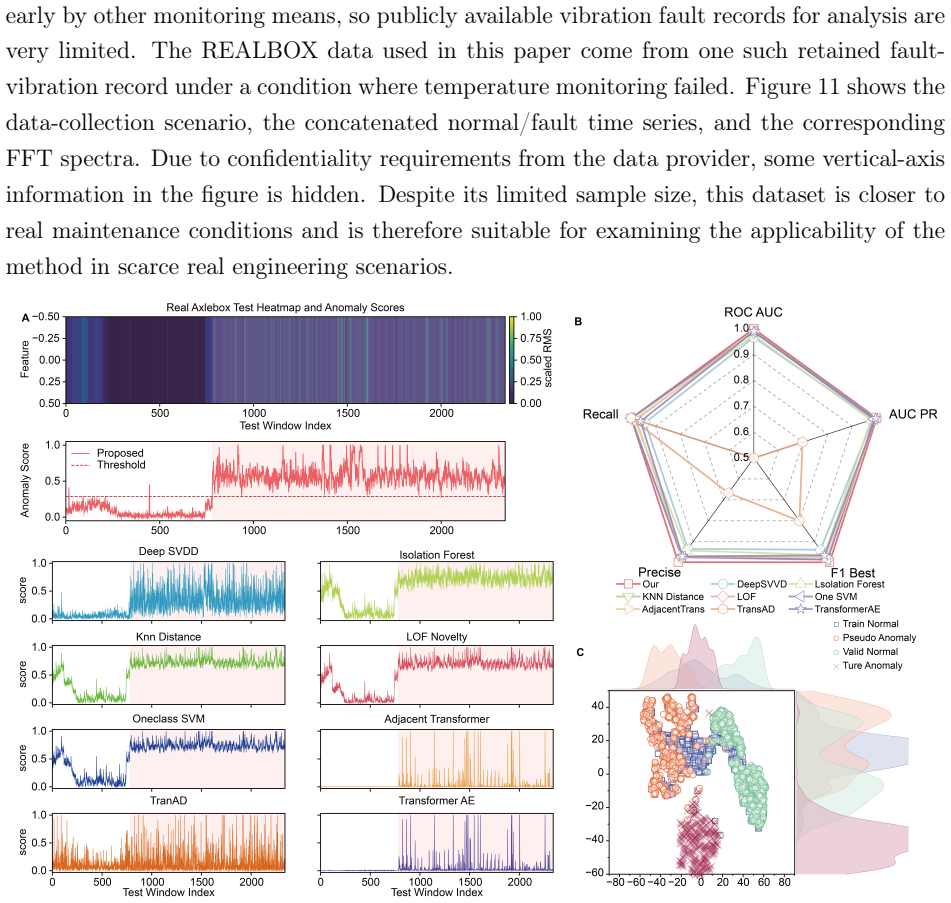
- It extends to public time-series anomaly detection benchmarks and real high-speed train bearing data with a degree of broader applicability.
- It jointly processes continuous and discrete features within the same mixed-variable time series.
Where Pith is reading between the lines
- The boundary-neighborhood construction of pseudo-anomalies might reduce reliance on domain-specific fault knowledge in other industrial monitoring settings.
- If the contrastive stage proves robust, similar pseudo-anomaly guidance could be tested on non-bearing time series where labeled anomalies remain scarce.
- The per-feature error control during pseudo-anomaly creation may offer a route to adapt the method when feature scales or types differ sharply across datasets.
Load-bearing premise
That pseudo-anomalous windows created near the normal boundary serve as effective proxies for real anomalies so that contrastive learning produces representations that generalize to actual anomalies.
What would settle it
Running the trained model on a labeled bearing dataset with known real anomalies and finding no gain in detection precision or recall compared with a standard reconstruction baseline that does not use pseudo-anomaly contrastive learning.
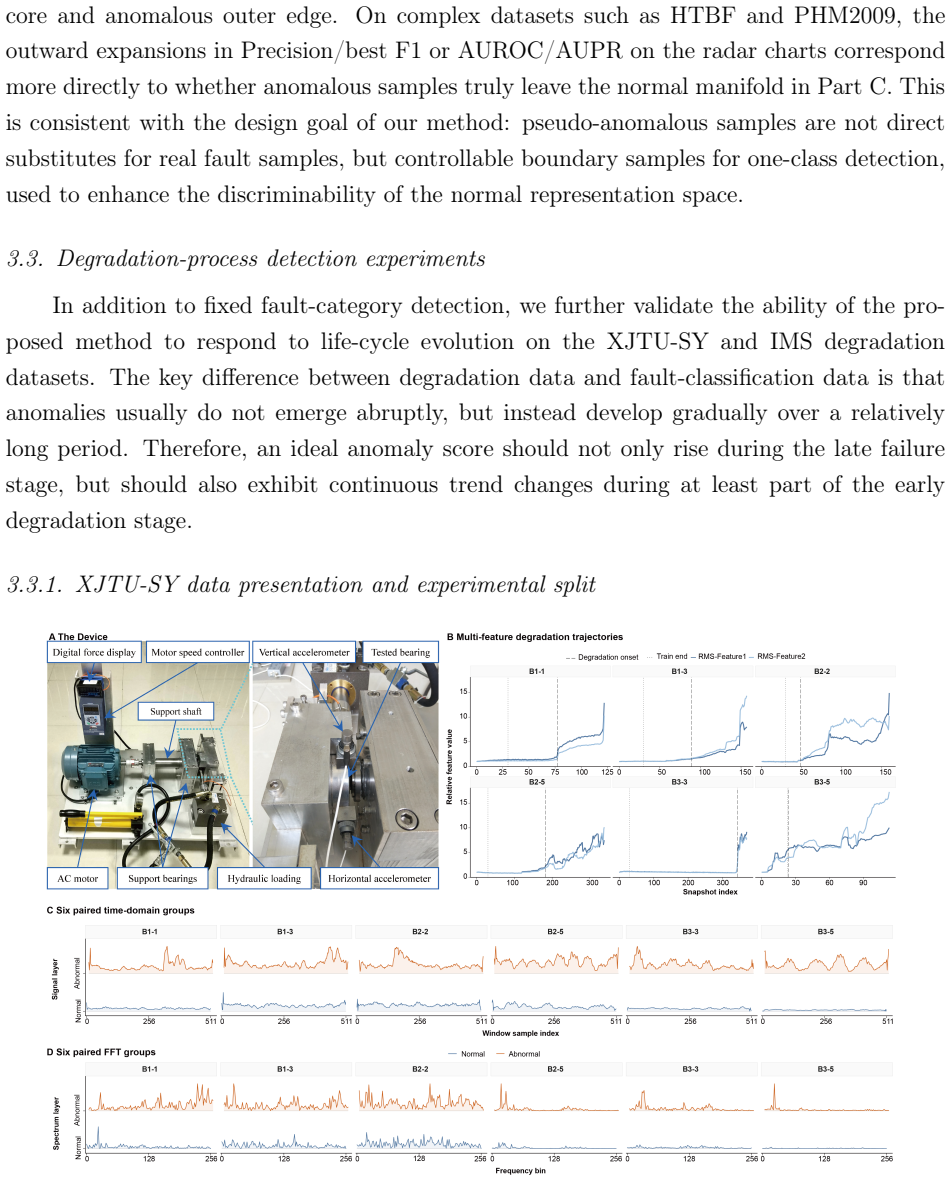
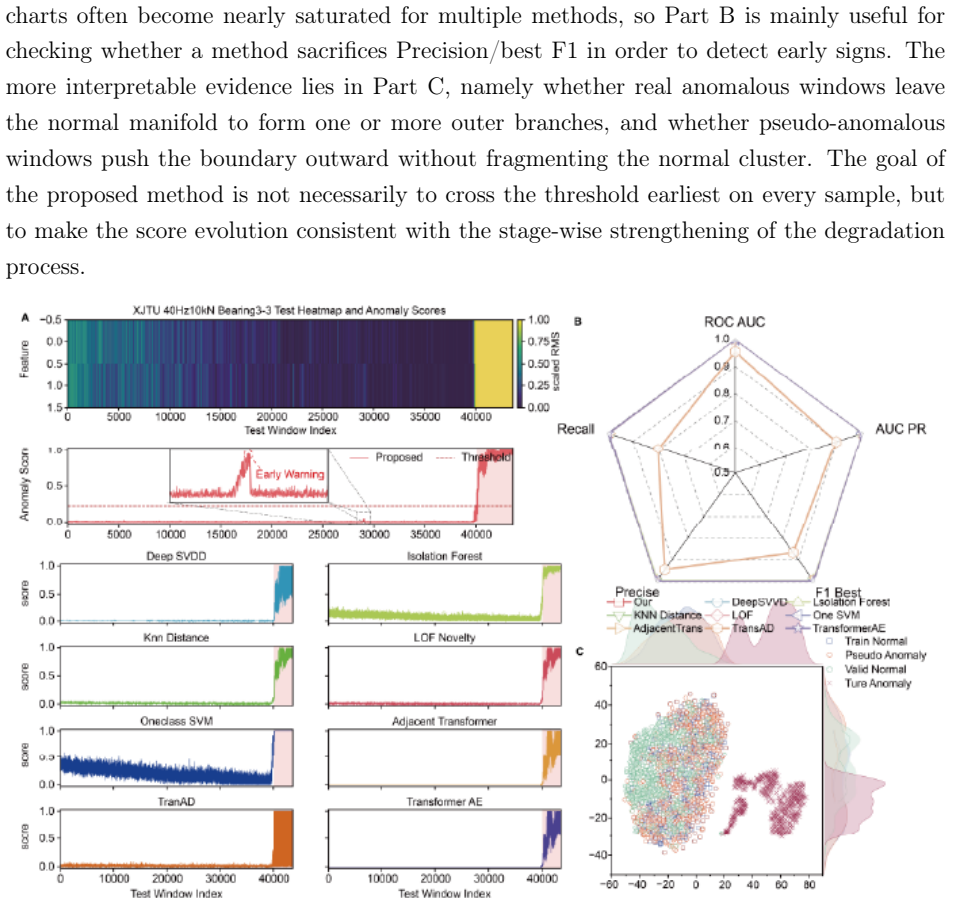
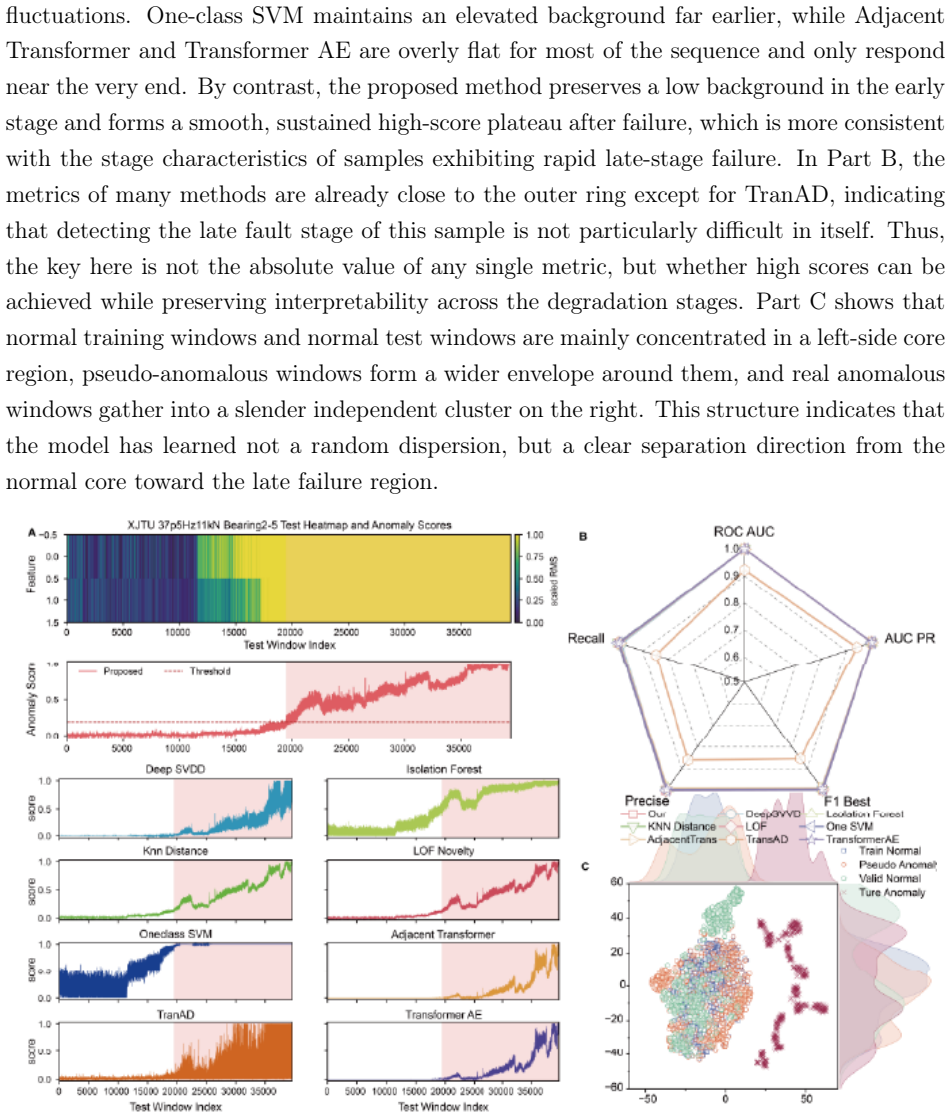
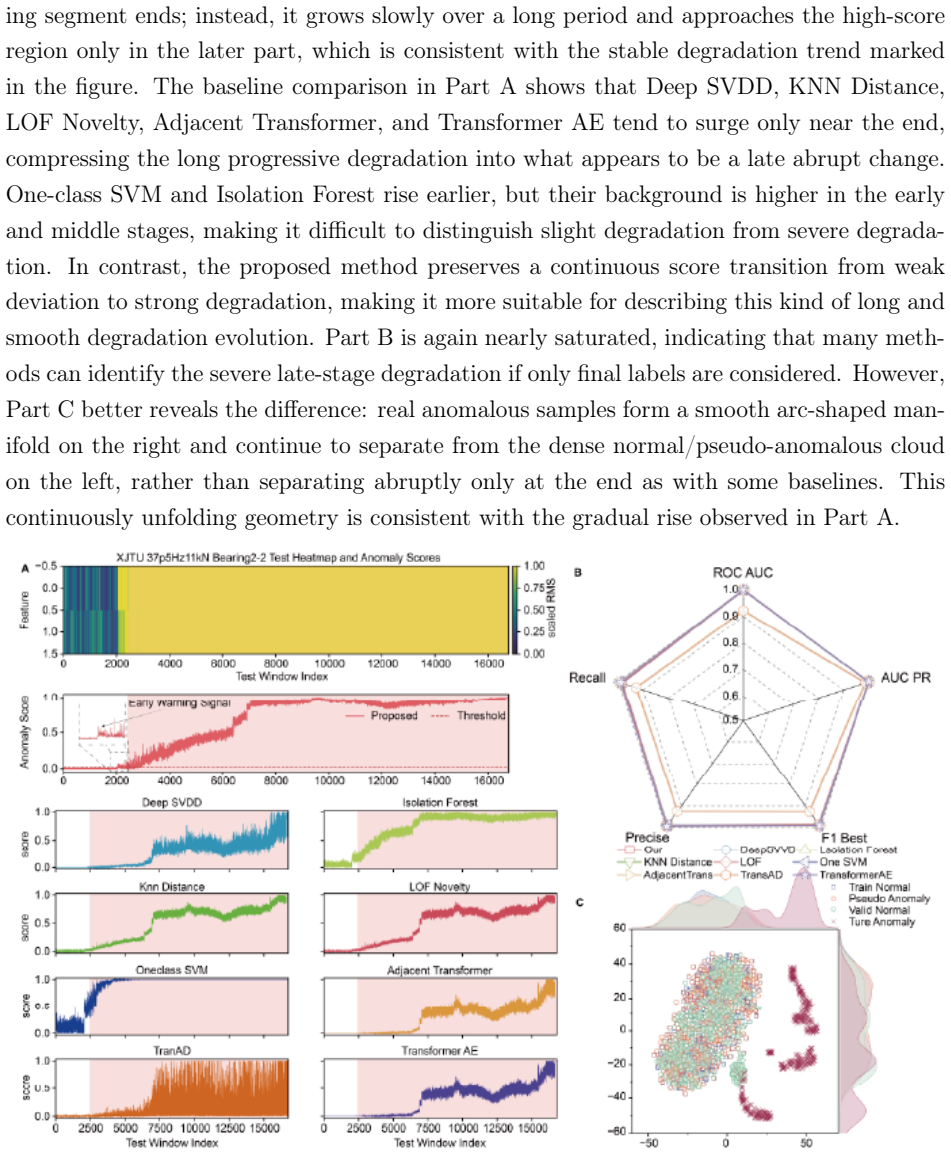
Figures

read the original abstract
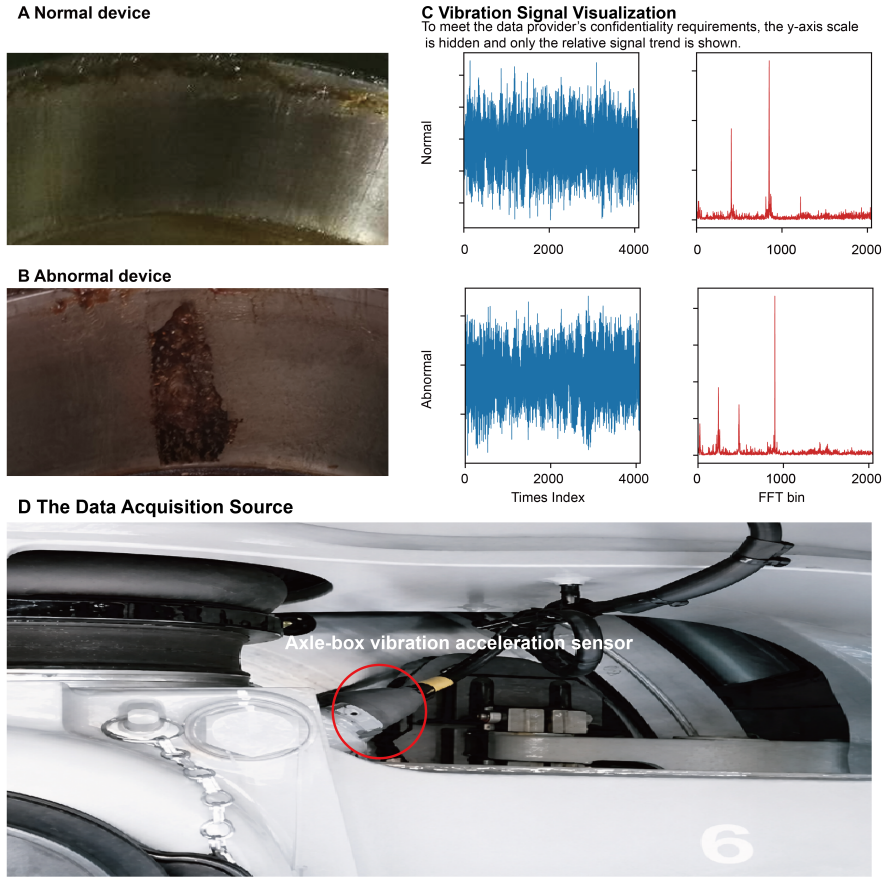
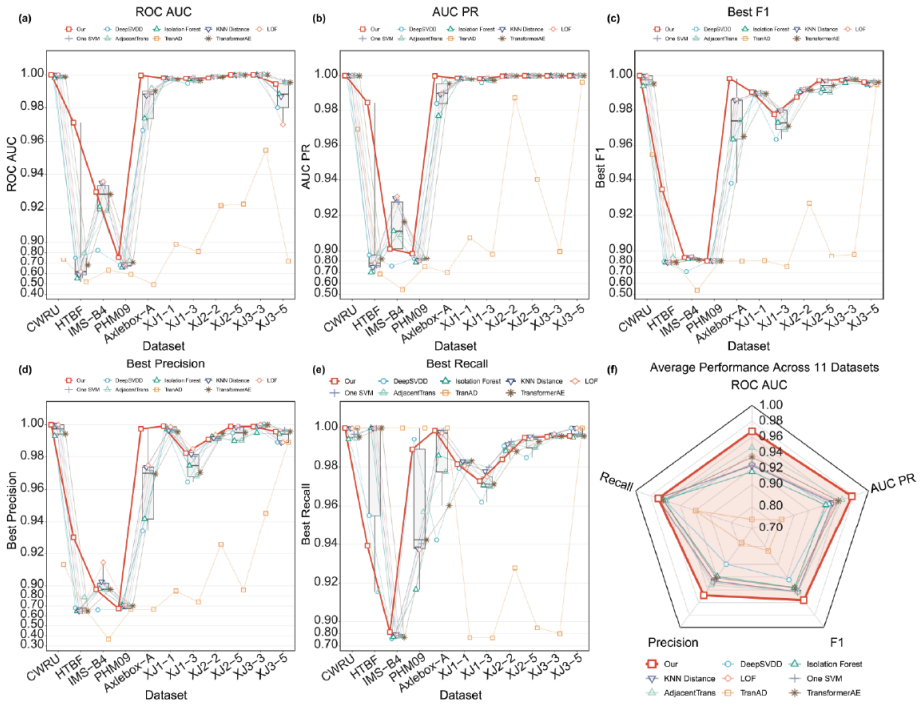
This paper proposes a two-stage pseudo anomaly-guided anomaly detection method (\textbf{T}wo-stage \textbf{P}seudo \textbf{A}nomaly-guided \textbf{A}nomaly \textbf{D}etection, \textbf{TPA-AD}) for axle-box bearing time-series anomaly detection (time series anomaly detection, TSAD) under the setting where only normal samples are available for training. The method first generates pseudo-anomalous windows near the normal boundary using a reconstruction model and per-feature target-error control. It then learns anomaly-sensitive representations through contrastive learning between normal and pseudo-anomalous windows, and finally produces window-level and point-level anomaly scores using k-nearest neighbors (KNN). Compared with existing methods that rely on known fault categories, real anomaly priors, or random anomaly injection, TPA-AD improves the separability of the normal boundary by constructing pseudo-anomalies in boundary neighborhoods and can jointly handle continuous and discrete features in mixed-variable scenarios. The main experiments are conducted on bearing fault detection datasets and degradation-process datasets, with an additional exploratory extension on $13$ public TSAD datasets. The results show that the proposed method yields relatively stable anomaly responses, is sensitive to degradation evolution, and demonstrates a certain degree of broader applicability on public TSAD benchmarks and real high-speed-train-related bearing data.
Editorial analysis
A structured set of objections, weighed in public.
Referee Report
Summary. The paper proposes TPA-AD, a two-stage method for unsupervised time-series anomaly detection on axle-box bearing data (only normal samples available). Stage 1 generates pseudo-anomalous windows near the normal boundary via a reconstruction model with per-feature target-error control. Stage 2 applies contrastive learning on normal vs. pseudo-anomalous windows to obtain anomaly-sensitive representations, followed by KNN-based window- and point-level scoring. The method claims improved normal-boundary separability, ability to handle mixed continuous/discrete features, stable anomaly responses, sensitivity to degradation evolution, and a degree of applicability on 13 public TSAD benchmarks plus real high-speed-train bearing data.
Significance. If the pseudo-anomalies generated via reconstruction error and per-feature thresholds prove to be representative proxies for real bearing faults, the approach could advance unsupervised TSAD by avoiding reliance on known fault categories, real anomaly priors, or random injection. The extension to degradation-process datasets and 13 public benchmarks is a positive step toward assessing broader utility in industrial mixed-variable settings.
major comments (2)
- [Abstract] Abstract: the claim of performance gains, stable responses, and broader applicability is stated without any quantitative results, error bars, baseline comparisons, or statistical tests; this prevents assessment of the central claim that pseudo-anomaly construction improves separability.
- [Method] Method (pseudo-anomaly generation stage): the construction relies on reconstruction error distribution plus independent per-feature target-error thresholds, but provides no analysis showing that the resulting windows capture correlated temporal structure or specific fault signatures (e.g., periodic impulses or degradation trends) present in real axle-box bearing data; this assumption is load-bearing for the subsequent contrastive-learning stage producing generalizable representations.
minor comments (1)
- Notation for the reconstruction model, target-error control, and contrastive loss could be made more explicit with equations or pseudocode to improve reproducibility.
Simulated Author's Rebuttal
We thank the referee for the constructive comments. We address each major comment below and note planned revisions.
read point-by-point responses
-
Referee: [Abstract] Abstract: the claim of performance gains, stable responses, and broader applicability is stated without any quantitative results, error bars, baseline comparisons, or statistical tests; this prevents assessment of the central claim that pseudo-anomaly construction improves separability.
Authors: We agree that the abstract would benefit from quantitative support to allow readers to assess the claims. In the revised manuscript we will add concise quantitative highlights, including key performance metrics and baseline comparisons from the bearing and degradation experiments. revision: yes
-
Referee: [Method] Method (pseudo-anomaly generation stage): the construction relies on reconstruction error distribution plus independent per-feature target-error thresholds, but provides no analysis showing that the resulting windows capture correlated temporal structure or specific fault signatures (e.g., periodic impulses or degradation trends) present in real axle-box bearing data; this assumption is load-bearing for the subsequent contrastive-learning stage producing generalizable representations.
Authors: The pseudo-anomaly stage is intentionally designed to produce boundary-near samples via per-feature error control. The manuscript validates the overall approach through downstream contrastive learning and detection results on real axle-box data, including degradation sensitivity. We acknowledge the absence of a dedicated analysis of temporal structure or fault signatures in the generated windows and will add visualizations and comparisons of pseudo-anomaly characteristics versus real fault patterns in the revision. revision: yes
Circularity Check
No circularity: TPA-AD is a constructive two-stage pipeline without self-referential reductions
full rationale
The paper describes a method that generates pseudo-anomalies using a reconstruction model plus per-feature target-error control, then applies contrastive learning between normal and pseudo-anomalous windows, and finally computes KNN-based scores. No equations, fitted parameters renamed as predictions, self-citations as load-bearing premises, or ansatzes imported from prior author work appear in the provided text. The central claim rests on the empirical behavior of this explicit construction on external datasets rather than any derivation that reduces outputs to inputs by definition. This is the standard case of a non-circular algorithmic proposal.
Axiom & Free-Parameter Ledger
axioms (2)
- domain assumption Normal samples alone are sufficient to define a boundary that can be meaningfully perturbed to create useful pseudo-anomalies.
- domain assumption Contrastive learning between normal and pseudo-anomalous windows produces representations that transfer to real anomalies.
Reference graph
Works this paper leans on
-
[1]
A comprehensive review of deep learning-based fault diagnosis approaches for rolling bearings: Advancements and challenges
Jiangdong Zhao, Wenming Wang, Ji Huang, and Xiaolu Ma. A comprehensive review of deep learning-based fault diagnosis approaches for rolling bearings: Advancements and challenges. AIP Advances, 15 0 (2), 2025
2025
-
[2]
Rolling bearing intelligent fault diagnosis towards variable speed and imbalanced samples using multiscale dynamic supervised contrast learning
Yutong Dong, Hongkai Jiang, Renhe Yao, Mingzhe Mu, and Qiao Yang. Rolling bearing intelligent fault diagnosis towards variable speed and imbalanced samples using multiscale dynamic supervised contrast learning. Reliability Engineering & System Safety, 243: 0 109805, 2024 a
2024
-
[3]
Time-frequency supervised contrastive learning via pseudo-labeling: An unsupervised domain adaptation network for rolling bearing fault diagnosis under time-varying speeds
Bin Pang, Qiuhai Liu, Zhenduo Sun, Zhenli Xu, and Ziyang Hao. Time-frequency supervised contrastive learning via pseudo-labeling: An unsupervised domain adaptation network for rolling bearing fault diagnosis under time-varying speeds. Advanced Engineering Informatics, 59: 0 102304, 2024
2024
-
[4]
Dynamic model-assisted disentanglement framework for rolling bearing fault diagnosis under time-varying speed conditions
Yuhui Xu, Yimin Jiang, Tangbin Xia, Dong Wang, Zhen Chen, Ershun Pan, and Lifeng Xi. Dynamic model-assisted disentanglement framework for rolling bearing fault diagnosis under time-varying speed conditions. Mechanical Systems and Signal Processing, 230: 0 112588, 2025
2025
-
[5]
Ccft: The convolution and cross-fusion transformer for fault diagnosis of bearings
Tantao Lin, Yongsheng Zhu, Zhijun Ren, Kai Huang, and Dawei Gao. Ccft: The convolution and cross-fusion transformer for fault diagnosis of bearings. IEEE/ASME Transactions on Mechatronics, 29 0 (3): 0 2161--2172, 2023
2023
-
[6]
A novel method for rolling bearing fault diagnosis based on gramian angular field and cnn-vit
Zijun Zhou, Qingsong Ai, Ping Lou, Jianmin Hu, and Junwei Yan. A novel method for rolling bearing fault diagnosis based on gramian angular field and cnn-vit. Sensors, 24 0 (12): 0 3967, 2024 a
2024
-
[7]
A deep learning-based method for bearing fault diagnosis with few-shot learning
Yang Li, Xiaojiao Gu, and Yonghe Wei. A deep learning-based method for bearing fault diagnosis with few-shot learning. Sensors, 24 0 (23): 0 7516, 2024
2024
-
[8]
Msff-net: Multi-sensor frequency-domain feature fusion network with lightweight 1d cnn for bearing fault diagnosis
Miao Dai, Hangyeol Jo, Moonsuk Kim, and Sang-Woo Ban. Msff-net: Multi-sensor frequency-domain feature fusion network with lightweight 1d cnn for bearing fault diagnosis. Sensors, 25 0 (14): 0 4348, 2025
2025
-
[9]
Multi-sensor fusion rolling bearing intelligent fault diagnosis based on vmd and ultra-lightweight googlenet in industrial environments
Shouqi Wang and Zhigang Feng. Multi-sensor fusion rolling bearing intelligent fault diagnosis based on vmd and ultra-lightweight googlenet in industrial environments. Digital Signal Processing, 145: 0 104306, 2024
2024
-
[10]
Multi-sensor data fusion-enabled lightweight convolutional double regularization contrast transformer for aerospace bearing small samples fault diagnosis
Yutong Dong, Hongkai Jiang, Mingzhe Mu, and Xin Wang. Multi-sensor data fusion-enabled lightweight convolutional double regularization contrast transformer for aerospace bearing small samples fault diagnosis. Advanced Engineering Informatics, 62: 0 102573, 2024 b
2024
-
[11]
Mrcfn: A multi-sensor residual convolutional fusion network for intelligent fault diagnosis of bearings in noisy and small sample scenarios
Maoyou Ye, Xiaoan Yan, Xing Hua, Dong Jiang, Ling Xiang, and Ning Chen. Mrcfn: A multi-sensor residual convolutional fusion network for intelligent fault diagnosis of bearings in noisy and small sample scenarios. Expert Systems with Applications, 259: 0 125214, 2025
2025
-
[12]
Agfcn: A bearing fault diagnosis method for high-speed train bogie under complex working conditions
Deqiang He, Jinxin Wu, Zhenzhen Jin, ChengGeng Huang, Zexian Wei, and Cai Yi. Agfcn: A bearing fault diagnosis method for high-speed train bogie under complex working conditions. Reliability Engineering & System Safety, 258: 0 110907, 2025
2025
-
[13]
Zero-sample fault diagnosis of rolling bearings via fault spectrum knowledge and autonomous contrastive learning
Guoqiang Li, Meirong Wei, Defeng Wu, Yiwei Cheng, Jun Wu, and Jin Yan. Zero-sample fault diagnosis of rolling bearings via fault spectrum knowledge and autonomous contrastive learning. Expert Systems with Applications, 275: 0 127080, 2025
2025
-
[14]
Frequency pattern graph spectrum model and its applications in rolling bearing fault diagnosis
Yanlei Liu, Yonggang Xu, Miaorui Yang, Hong Jiang, and Kun Zhang. Frequency pattern graph spectrum model and its applications in rolling bearing fault diagnosis. Mechanical Systems and Signal Processing, 240: 0 113426, 2025 a
2025
-
[15]
Intelligent diagnosis of rolling bearings under cross-domain missing data: A lightweight complex domain imputation and unsupervised time--frequency alignment approach
Xuan Wang, Zhanqiang Hou, Gao Liu, Junwei Xue, Qingsong Li, Xuezhong Wu, and Dingbang Xiao. Intelligent diagnosis of rolling bearings under cross-domain missing data: A lightweight complex domain imputation and unsupervised time--frequency alignment approach. Mechanical Systems and Signal Processing, 241: 0 113504, 2025
2025
-
[16]
Deep learning for time series anomaly detection: A survey
Zahra Zamanzadeh Darban, Geoffrey I Webb, Shirui Pan, Charu Aggarwal, and Mahsa Salehi. Deep learning for time series anomaly detection: A survey. ACM Computing Surveys, 57 0 (1): 0 1--42, 2024
2024
-
[17]
The elephant in the room: Towards a reliable time-series anomaly detection benchmark
Qinghua Liu and John Paparrizos. The elephant in the room: Towards a reliable time-series anomaly detection benchmark. Advances in Neural Information Processing Systems, 37: 0 108231--108261, 2024
2024
-
[19]
Learning multi-pattern normalities in the frequency domain for efficient time series anomaly detection
Feiyi Chen, Yingying Zhang, Zhen Qin, Lunting Fan, Renhe Jiang, Yuxuan Liang, Qingsong Wen, and Shuiguang Deng. Learning multi-pattern normalities in the frequency domain for efficient time series anomaly detection. In 2024 IEEE 40th International Conference on Data Engineering (ICDE), pages 747--760. IEEE, 2024
2024
-
[20]
Unraveling the ‘anomaly’in time series anomaly detection: a self-supervised tri-domain solution
Yuting Sun, Guansong Pang, Guanhua Ye, Tong Chen, Xia Hu, and Hongzhi Yin. Unraveling the ‘anomaly’in time series anomaly detection: a self-supervised tri-domain solution. In 2024 IEEE 40th International Conference on Data Engineering (ICDE), pages 981--994. IEEE, 2024
2024
-
[21]
Temporal-frequency masked autoencoders for time series anomaly detection
Yuchen Fang, Jiandong Xie, Yan Zhao, Lu Chen, Yunjun Gao, and Kai Zheng. Temporal-frequency masked autoencoders for time series anomaly detection. In 2024 IEEE 40th international conference on data engineering (ICDE), pages 1228--1241. IEEE, 2024
2024
-
[24]
Interdependency matters: graph alignment for multivariate time series anomaly detection
Yuanyi Wang, Haifeng Sun, Chengsen Wang, Mengde Zhu, Jingyu Wang, Wei Tang, Qi Qi, Zirui Zhuang, and Jianxin Liao. Interdependency matters: graph alignment for multivariate time series anomaly detection. In 2024 IEEE International Conference on Data Mining (ICDM), pages 869--874. IEEE, 2024
2024
-
[25]
Catch: Channel-aware multivariate time series anomaly detection via frequency patching
Xingjian Wu, Xiangfei Qiu, Zhengyu Li, Yihang Wang, Jilin Hu, Chenjuan Guo, Hui Xiong, and Bin Yang. Catch: Channel-aware multivariate time series anomaly detection via frequency patching. In International conference on learning representations, volume 2025, pages 17017--17045, 2025
2025
-
[26]
Towards a general time series anomaly detector with adaptive bottlenecks and dual adversarial decoders
Qichao Shentu, Beibu Li, Kai Zhao, Yang Shu, Zhongwen Rao, Lujia Pan, Bin Yang, and Chenjuan Guo. Towards a general time series anomaly detector with adaptive bottlenecks and dual adversarial decoders. In International Conference on Learning Representations, volume 2025, pages 81358--81381, 2025
2025
-
[27]
Learn hybrid prototypes for multivariate time series anomaly detection
Ke-Yuan Shen. Learn hybrid prototypes for multivariate time series anomaly detection. In The Thirteenth International Conference on Learning Representations, 2025
2025
-
[28]
Carla: Self-supervised contrastive representation learning for time series anomaly detection
Zahra Zamanzadeh Darban, Geoffrey I Webb, Shirui Pan, Charu C Aggarwal, and Mahsa Salehi. Carla: Self-supervised contrastive representation learning for time series anomaly detection. Pattern Recognition, 157: 0 110874, 2025
2025
-
[30]
Rtdetector: Deep transformer networks for time series anomaly detection based on reconstruction trend
Xinhong Liu, Xiaoliang Li, Yangfan Li, Fengxiao Tang, and Ming Zhao. Rtdetector: Deep transformer networks for time series anomaly detection based on reconstruction trend. In Proceedings of the Thirty-Fourth International Joint Conference on Artificial Intelligence, IJCAI-25, J. Kwok, Ed. International Joint Conferences on Artificial Intelligence Organiza...
2025
-
[31]
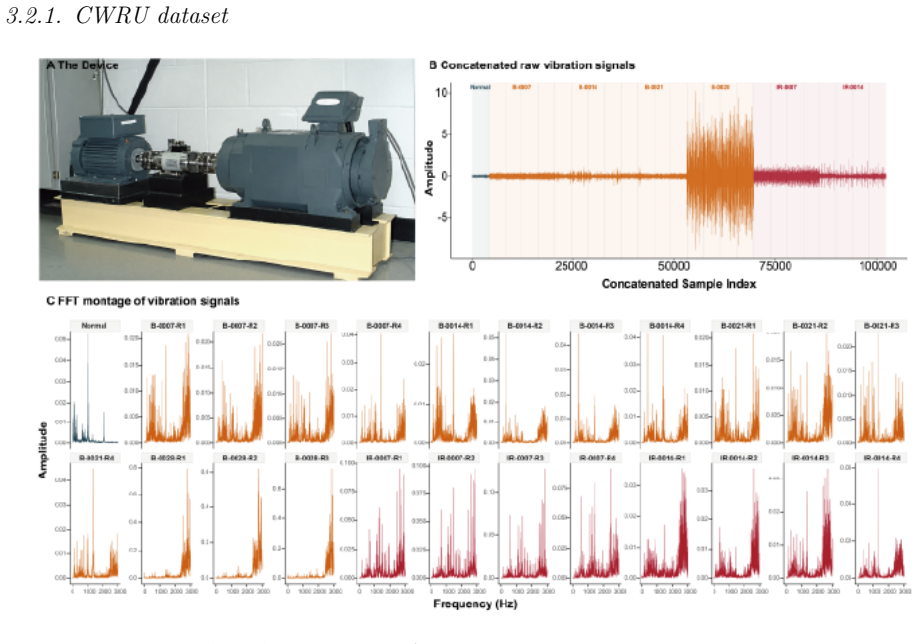
Bearing data center: Apparatus & procedures
Case Western Reserve University Bearing Data Center . Bearing data center: Apparatus & procedures. https://engineering.case.edu/bearingdatacenter/apparatus-and-procedures, 2024. Accessed: 2026-05-30
2024
-
[32]
2009 phm challenge competition data set
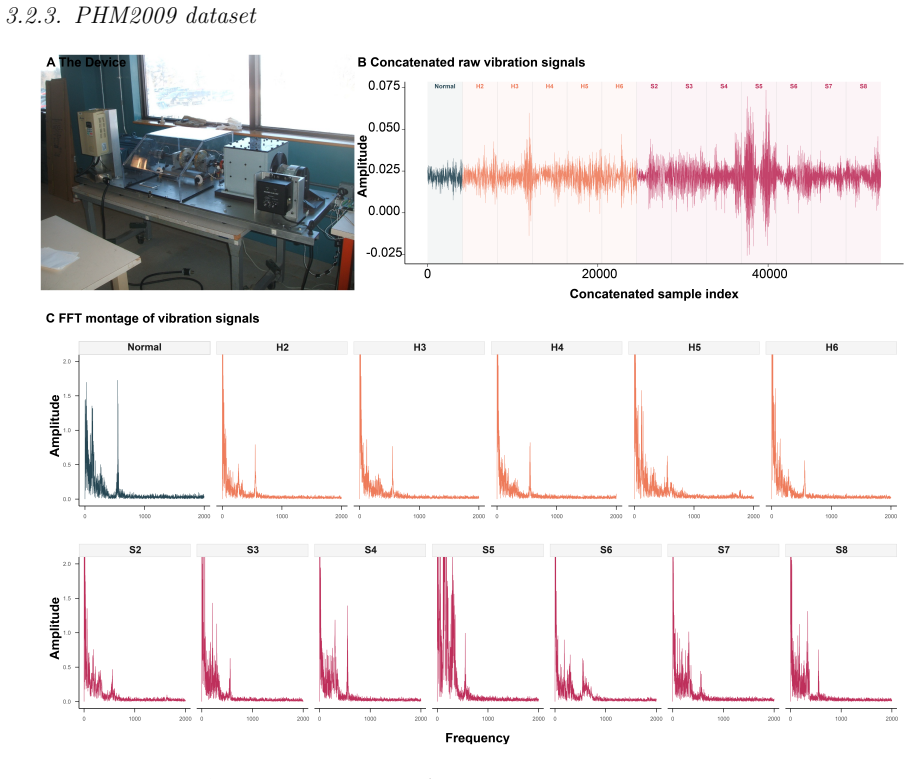
PHM Society . 2009 phm challenge competition data set. https://phmsociety.org/public-data-sets/, 2009. Accessed: 2026-05-30
2009
-
[33]
Xjtu-sy bearing datasets
Biao Wang. Xjtu-sy bearing datasets. https://biaowang.tech/xjtu-sy-bearing-datasets/, 2021. Accessed: 2026-05-30
2021
-
[34]
Ims bearings
NASA Open Data Portal . Ims bearings. https://data.nasa.gov/dataset/ims-bearings, 2023. Experiments on bearings provided by the Center for Intelligent Maintenance Systems (IMS), University of Cincinnati. Accessed: 2026-05-30
2023
-
[35]
Krishna, Marine Bruel, Qinghua Liu, Mingyi Huang, Themis Palpanas, Ruey S
Paul Boniol, Ashwin K. Krishna, Marine Bruel, Qinghua Liu, Mingyi Huang, Themis Palpanas, Ruey S. Tsay, Aaron Elmore, Michael J. Franklin, and John Paparrizos. Vus: effective and efficient accuracy measures for time-series anomaly detection. The VLDB Journal, 34: 0 32, 2025. doi:10.1007/s00778-025-00907-x
-
[36]
Tsay, Themis Palpanas, and Michael J
John Paparrizos, Yuhao Kang, Paul Boniol, Ruey S. Tsay, Themis Palpanas, and Michael J. Franklin. Tsb-uad: An end-to-end benchmark suite for univariate time-series anomaly detection. Proceedings of the VLDB Endowment, 15 0 (8): 0 1697--1711, 2022. doi:10.14778/3529337.3529354
-
[37]
AIP Advances , volume=
A comprehensive review of deep learning-based fault diagnosis approaches for rolling bearings: Advancements and challenges , author=. AIP Advances , volume=. 2025 , publisher=
2025
-
[38]
Reliability Engineering & System Safety , volume=
Rolling bearing intelligent fault diagnosis towards variable speed and imbalanced samples using multiscale dynamic supervised contrast learning , author=. Reliability Engineering & System Safety , volume=. 2024 , publisher=
2024
-
[39]
Advanced Engineering Informatics , volume=
Time-frequency supervised contrastive learning via pseudo-labeling: An unsupervised domain adaptation network for rolling bearing fault diagnosis under time-varying speeds , author=. Advanced Engineering Informatics , volume=. 2024 , publisher=
2024
-
[40]
IEEE/ASME Transactions on Mechatronics , volume=
CCFT: The convolution and cross-fusion transformer for fault diagnosis of bearings , author=. IEEE/ASME Transactions on Mechatronics , volume=. 2023 , publisher=
2023
-
[41]
Sensors , volume=
A novel method for rolling bearing fault diagnosis based on Gramian angular field and CNN-ViT , author=. Sensors , volume=. 2024 , publisher=
2024
-
[42]
Sensors , volume=
A deep learning-based method for bearing fault diagnosis with few-shot learning , author=. Sensors , volume=. 2024 , publisher=
2024
-
[43]
Sensors , volume=
MSFF-Net: Multi-sensor frequency-domain feature fusion network with lightweight 1D CNN for bearing fault diagnosis , author=. Sensors , volume=. 2025 , publisher=
2025
-
[44]
Digital Signal Processing , volume=
Multi-sensor fusion rolling bearing intelligent fault diagnosis based on VMD and ultra-lightweight GoogLeNet in industrial environments , author=. Digital Signal Processing , volume=. 2024 , publisher=
2024
-
[45]
Advanced Engineering Informatics , volume=
Multi-sensor data fusion-enabled lightweight convolutional double regularization contrast transformer for aerospace bearing small samples fault diagnosis , author=. Advanced Engineering Informatics , volume=. 2024 , publisher=
2024
-
[46]
Reliability Engineering & System Safety , volume=
AGFCN: A bearing fault diagnosis method for high-speed train bogie under complex working conditions , author=. Reliability Engineering & System Safety , volume=. 2025 , publisher=
2025
-
[47]
Expert Systems with Applications , volume=
Zero-Sample fault diagnosis of rolling bearings via fault spectrum knowledge and autonomous contrastive learning , author=. Expert Systems with Applications , volume=. 2025 , publisher=
2025
-
[48]
Mechanical Systems and Signal Processing , volume=
Frequency pattern graph spectrum model and its applications in rolling bearing fault diagnosis , author=. Mechanical Systems and Signal Processing , volume=. 2025 , publisher=
2025
-
[49]
Expert Systems with Applications , volume=
MRCFN: A multi-sensor residual convolutional fusion network for intelligent fault diagnosis of bearings in noisy and small sample scenarios , author=. Expert Systems with Applications , volume=. 2025 , publisher=
2025
-
[50]
Mechanical Systems and Signal Processing , volume=
Dynamic model-assisted disentanglement framework for rolling bearing fault diagnosis under time-varying speed conditions , author=. Mechanical Systems and Signal Processing , volume=. 2025 , publisher=
2025
-
[51]
Mechanical Systems and Signal Processing , volume=
Intelligent diagnosis of rolling bearings under cross-domain missing data: A lightweight complex domain imputation and unsupervised time--frequency alignment approach , author=. Mechanical Systems and Signal Processing , volume=. 2025 , publisher=
2025
-
[52]
ACM Computing Surveys , volume=
Deep learning for time series anomaly detection: A survey , author=. ACM Computing Surveys , volume=. 2024 , publisher=
2024
-
[53]
Advances in Neural Information Processing Systems , volume=
The elephant in the room: Towards a reliable time-series anomaly detection benchmark , author=. Advances in Neural Information Processing Systems , volume=
-
[54]
arXiv preprint arXiv:2506.18046 , year=
Tab: Unified benchmarking of time series anomaly detection methods , author=. arXiv preprint arXiv:2506.18046 , year=
-
[55]
2024 IEEE 40th International Conference on Data Engineering (ICDE) , pages=
Learning multi-pattern normalities in the frequency domain for efficient time series anomaly detection , author=. 2024 IEEE 40th International Conference on Data Engineering (ICDE) , pages=. 2024 , organization=
2024
-
[56]
2024 IEEE 40th International Conference on Data Engineering (ICDE) , pages=
Unraveling the ‘anomaly’in time series anomaly detection: a self-supervised tri-domain solution , author=. 2024 IEEE 40th International Conference on Data Engineering (ICDE) , pages=. 2024 , organization=
2024
-
[57]
2024 IEEE 40th international conference on data engineering (ICDE) , pages=
Temporal-frequency masked autoencoders for time series anomaly detection , author=. 2024 IEEE 40th international conference on data engineering (ICDE) , pages=. 2024 , organization=
2024
-
[58]
arXiv preprint arXiv:2307.00754 , year=
Imdiffusion: Imputed diffusion models for multivariate time series anomaly detection , author=. arXiv preprint arXiv:2307.00754 , year=
-
[59]
arXiv preprint arXiv:2312.16831 , year=
Meter: A dynamic concept adaptation framework for online anomaly detection , author=. arXiv preprint arXiv:2312.16831 , year=
-
[60]
2024 IEEE International Conference on Data Mining (ICDM) , pages=
Interdependency matters: graph alignment for multivariate time series anomaly detection , author=. 2024 IEEE International Conference on Data Mining (ICDM) , pages=. 2024 , organization=
2024
-
[61]
International conference on learning representations , volume=
Catch: Channel-aware multivariate time series anomaly detection via frequency patching , author=. International conference on learning representations , volume=
-
[62]
International Conference on Learning Representations , volume=
Towards a general time series anomaly detector with adaptive bottlenecks and dual adversarial decoders , author=. International Conference on Learning Representations , volume=
-
[63]
The Thirteenth International Conference on Learning Representations , year=
Learn hybrid prototypes for multivariate time series anomaly detection , author=. The Thirteenth International Conference on Learning Representations , year=
-
[64]
Pattern Recognition , volume=
CARLA: Self-supervised contrastive representation learning for time series anomaly detection , author=. Pattern Recognition , volume=. 2025 , publisher=
2025
-
[65]
arXiv preprint arXiv:2411.00278 , year=
KAN-AD: Time series anomaly detection with Kolmogorov-Arnold networks , author=. arXiv preprint arXiv:2411.00278 , year=
-
[66]
Proceedings of the Thirty-Fourth International Joint Conference on Artificial Intelligence, IJCAI-25, J
Rtdetector: Deep transformer networks for time series anomaly detection based on reconstruction trend , author=. Proceedings of the Thirty-Fourth International Joint Conference on Artificial Intelligence, IJCAI-25, J. Kwok, Ed. International Joint Conferences on Artificial Intelligence Organization , volume=
-
[67]
2024 , howpublished=
Bearing Data Center: Apparatus & Procedures , author=. 2024 , howpublished=
2024
-
[68]
2009 , howpublished=
2009 PHM Challenge Competition Data Set , author=. 2009 , howpublished=
2009
-
[69]
2021 , howpublished=
XJTU-SY Bearing Datasets , author=. 2021 , howpublished=
2021
-
[70]
2023 , howpublished=
IMS Bearings , author=. 2023 , howpublished=
2023
-
[71]
Proceedings of the VLDB Endowment , volume=
TSB-UAD: An End-to-End Benchmark Suite for Univariate Time-Series Anomaly Detection , author=. Proceedings of the VLDB Endowment , volume=. 2022 , doi=
2022
-
[72]
The VLDB Journal , volume=
VUS: effective and efficient accuracy measures for time-series anomaly detection , author=. The VLDB Journal , volume=. 2025 , doi=
2025
discussion (0)
Sign in with ORCID, Apple, or X to comment. Anyone can read and Pith papers without signing in.