REVIEW 2 major objections 2 minor 13 references
When Mean CE Fails: Median CE Can Better Track Language Model Quality
T0 review · 2 major / 2 minor · reviewed 2026-06-30 · grok-4.3
Pith's one-line read Median cross-entropy tracks language model task performance more closely than mean cross-entropy in two common training scenarios.
desk verdict Median CE tracks task performance better than mean CE in the two scoped training setups, with a useful note on watching distribution shape. read the letter →
The pith
A machine-rendered reading of the paper's core claim, the machinery that carries it, and where it could break.
The reading
What carries the argument
The empirical distribution of per-token cross-entropies, whose median and mean respond differently when training saturates the bulk or extends the tail.
What would settle it
A third training regime, such as continued pretraining or RLHF on a new model scale, in which mean CE and held-out task performance select the same checkpoint while median CE selects a different one.
Extended reading notes
Core claim
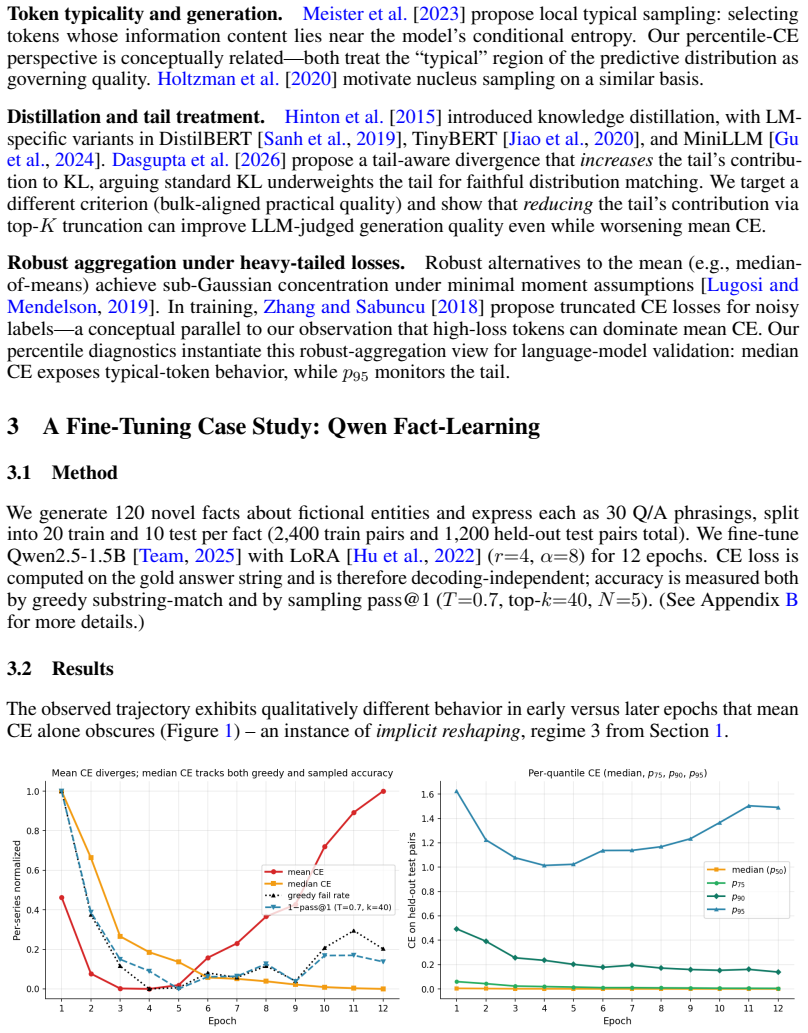
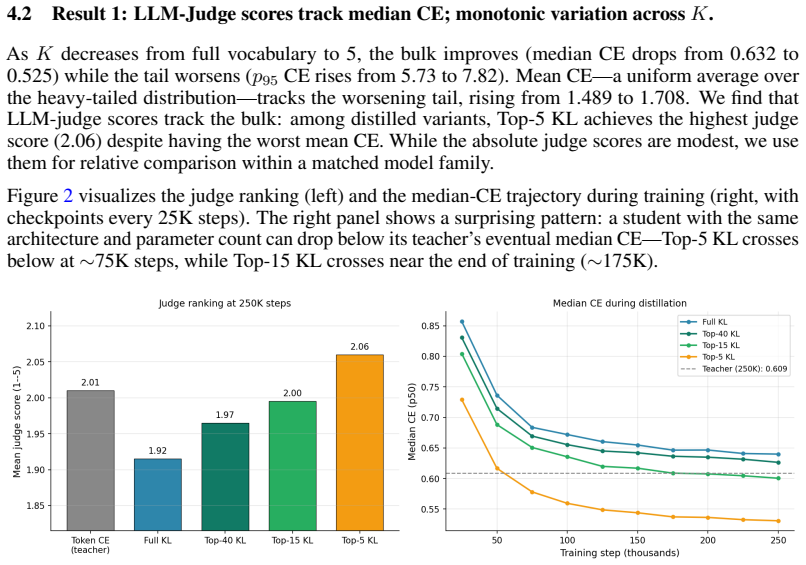
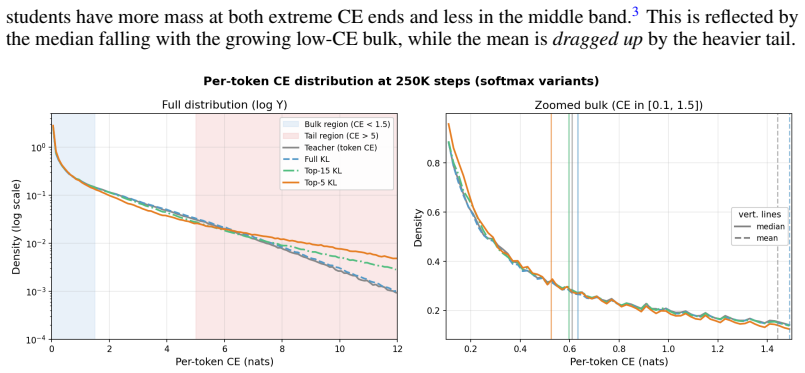
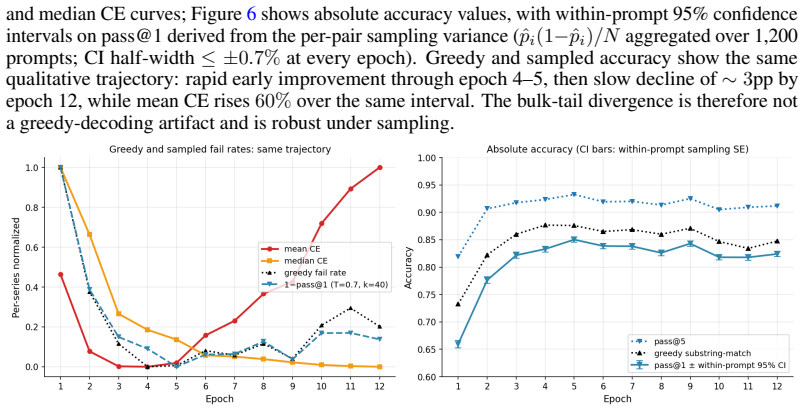
In both Qwen2.5-1.5B SFT on synthetic facts and top-K distillation on TinyStories, median cross-entropy correlates much more closely with task performance than mean cross-entropy does, because training reshapes the empirical per-token CE distribution so that bulk and tail percentiles diverge.
Load-bearing premise
The two examined scenarios are representative of the cases where mean CE commonly fails to track quality during language model training.
Editorial extensions
If this is right
- Model selection or early stopping based on mean CE alone can pick suboptimal checkpoints or student models.
- In top-K distillation, smaller K can produce a student that looks worse on mean CE yet better on actual quality metrics.
- Task performance appears more sensitive to the bulk of the CE distribution than to its tail.
- Concordance among multiple percentile CE summaries provides a diagnostic for when the loss distribution is being reshaped.
Reading between the lines
- When loss distributions become heavy-tailed during extended training, the mean may cease to be a reliable single summary statistic.
- Similar reshaping of the CE distribution may occur in other autoregressive training regimes beyond the two cases studied here.
- Practitioners could test whether monitoring the interquartile range or other quantiles improves checkpoint selection in long runs.
Editorial analysis
A structured set of objections, weighed in public.
Referee Report
Summary. The paper claims that mean cross-entropy (CE) can fail to track language model quality in two specific scenarios: (1) Qwen2.5-1.5B SFT on synthetic facts, where mean CE rises after initial learning while held-out fact-recall accuracy plateaus; (2) top-K distillation on TinyStories, where smaller K worsens mean CE but improves median CE and LLM-judge scores (with Top-5 student best on judge score and crossing teacher on median CE). It shows median CE correlates more closely with task performance, attributes this to reshaping of the per-token CE distribution (bulk saturation with tail extension in SFT; more mass at extremes in distillation), and recommends reporting percentile CE summaries alongside mean as a diagnostic.
Significance. If the scoped empirical observations hold, the work usefully demonstrates a concrete limitation of the dominant mean CE validation metric during LM training and offers a low-cost, practical alternative via median and other percentiles to detect distribution reshaping. The analysis of bulk vs. tail behavior provides mechanistic insight into the divergence. Credit is due for the targeted, falsifiable examples and the actionable recommendation without reliance on new parameters or derivations.
major comments (2)
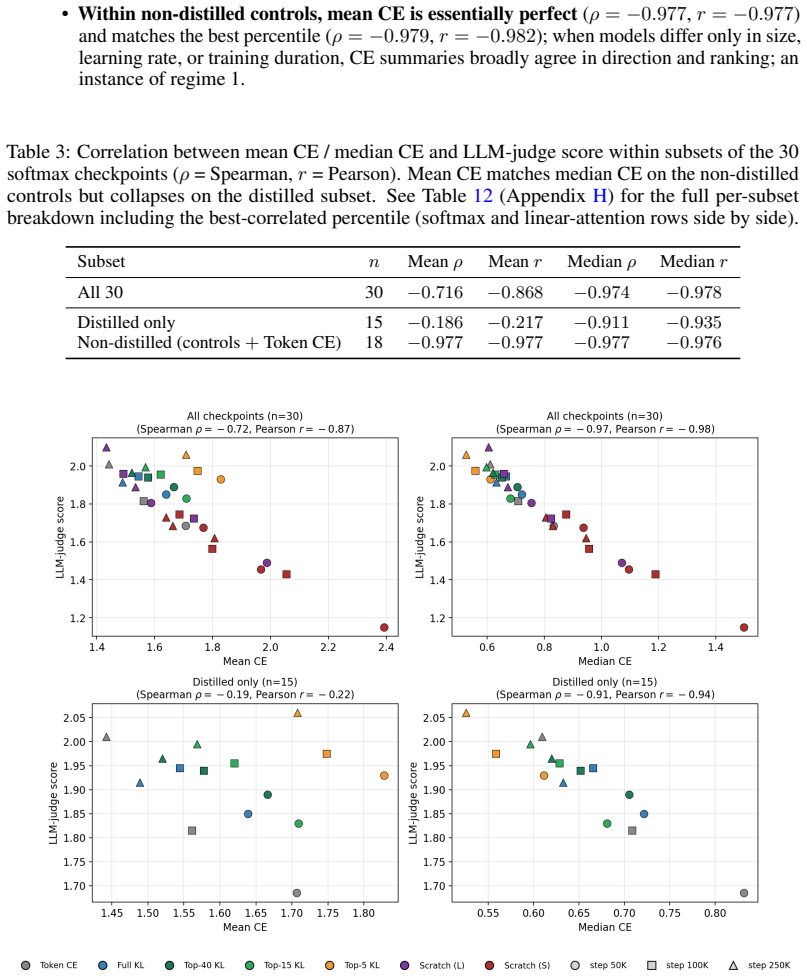
- [Abstract and analysis of distribution reshaping] The support for the central claim that median CE 'correlates much more closely' with task performance rests on the two scenarios, but the manuscript provides no quantitative correlation measures (e.g., Pearson or Spearman coefficients) or statistical comparison between mean and median CE alignments with the evaluation metrics; this weakens the ability to assess the magnitude of improvement.
- [Experimental scenarios] § on experimental details: the descriptions of the SFT and distillation runs omit key reproducibility elements such as number of random seeds, error bars on the reported CE and accuracy curves, exact dataset sizes/splits, and hyperparameter values, making it difficult to evaluate robustness of the observed mean/median divergence.
minor comments (2)
- [Conclusion] The practical recommendation to report 'a small set of percentile CE summaries' would be clearer if the manuscript specified which percentiles (e.g., 50th, 90th) are suggested and why.
- [Figures] Figure captions or legends should explicitly label which curves correspond to mean vs. median CE to avoid reader confusion when comparing to task metrics.
Simulated Author's Rebuttal
We thank the referee for the constructive feedback and the recommendation of minor revision. We address the two major comments point by point below.
read point-by-point responses
-
Referee: [Abstract and analysis of distribution reshaping] The support for the central claim that median CE 'correlates much more closely' with task performance rests on the two scenarios, but the manuscript provides no quantitative correlation measures (e.g., Pearson or Spearman coefficients) or statistical comparison between mean and median CE alignments with the evaluation metrics; this weakens the ability to assess the magnitude of improvement.
Authors: We agree that quantitative measures would allow a clearer assessment of the improvement in alignment. In the revised manuscript we will compute and report Pearson and Spearman correlation coefficients between mean CE, median CE, and the task metrics (fact-recall accuracy and LLM-judge scores) in both experimental scenarios. revision: yes
-
Referee: [Experimental scenarios] § on experimental details: the descriptions of the SFT and distillation runs omit key reproducibility elements such as number of random seeds, error bars on the reported CE and accuracy curves, exact dataset sizes/splits, and hyperparameter values, making it difficult to evaluate robustness of the observed mean/median divergence.
Authors: We acknowledge the omission of these details. The revised manuscript will specify the number of random seeds, include error bars on the relevant curves, state the exact dataset sizes and splits, and list all hyperparameter values used in the SFT and distillation runs. revision: yes
Circularity Check
No significant circularity: purely empirical observations
full rationale
The paper contains no derivation chain, mathematical claims, or first-principles results. Its central assertions are direct empirical reports of how mean vs. median cross-entropy behave in two specific training runs (Qwen2.5-1.5B SFT and top-K distillation on TinyStories), with no equations, fitted parameters renamed as predictions, self-citations invoked as uniqueness theorems, or ansatzes smuggled in. The observations are scoped to the examined scenarios and do not reduce to their own inputs by construction.
Assumptions & free parameters
assumptions (2)
- domain assumption Cross-entropy loss is an appropriate base measure for tracking language model quality
- domain assumption Held-out fact-recall accuracy and LLM-judge scores are valid proxies for model quality
Cite this review
Pith. "Pith review of When Mean CE Fails: Median CE Can Better Track Language Model Quality." pith.science (2026). https://pith.science/paper/D4GDQHOE
@misc{pith2026260524667,
  author       = {Pith},
  title        = {Pith review of: When Mean CE Fails: Median CE Can Better Track Language Model Quality},
  year         = {2026},
  howpublished = {\url{https://pith.science/paper/D4GDQHOE}},
  note         = {Machine review of arXiv:2605.24667}
}
read the original abstract
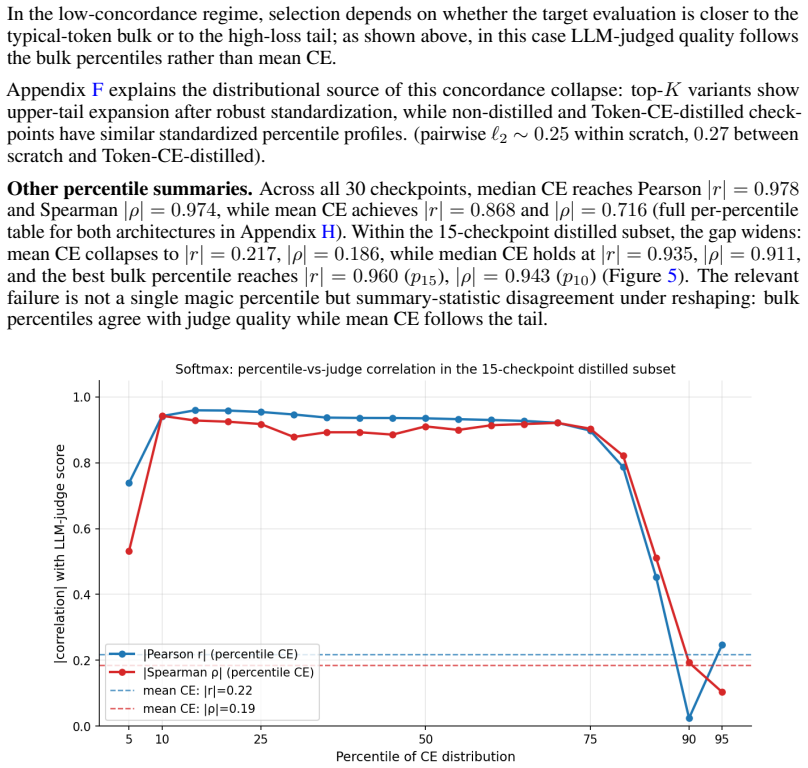
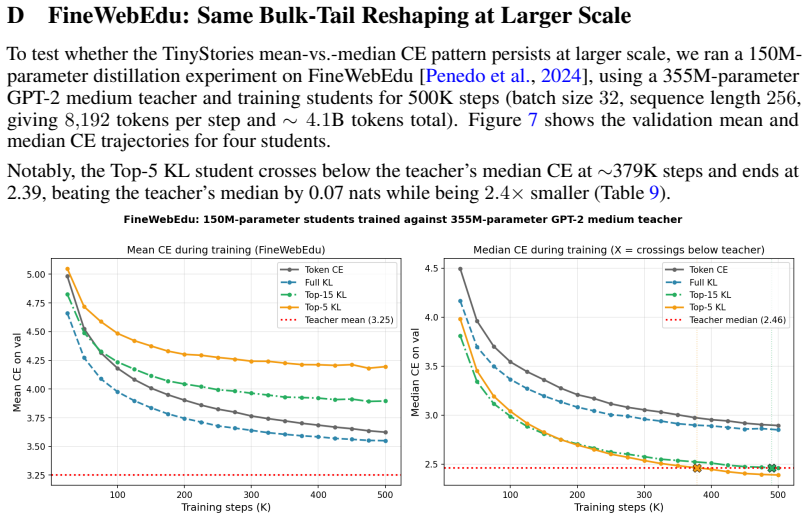
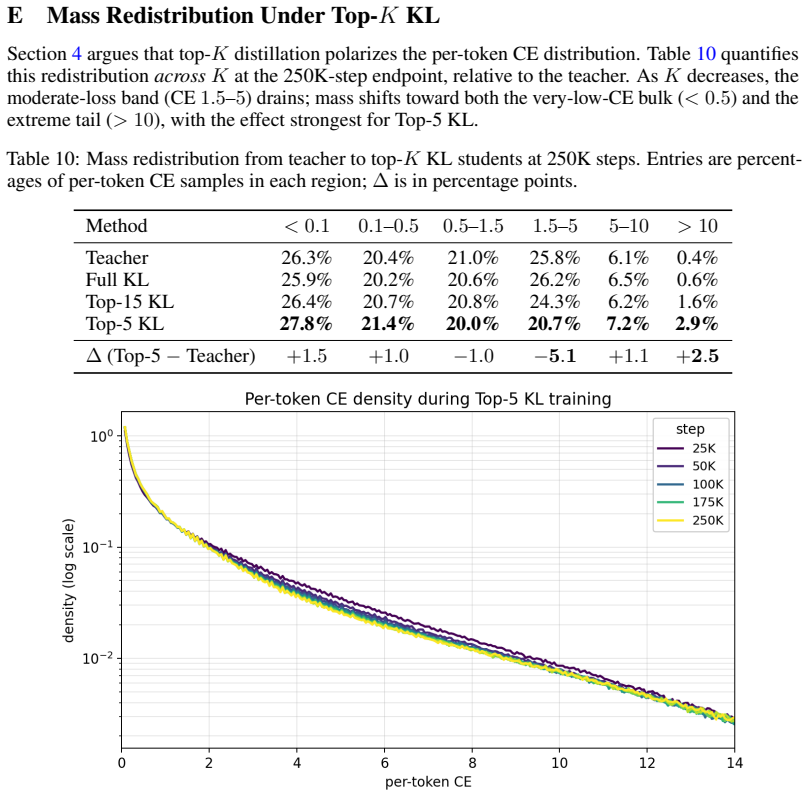
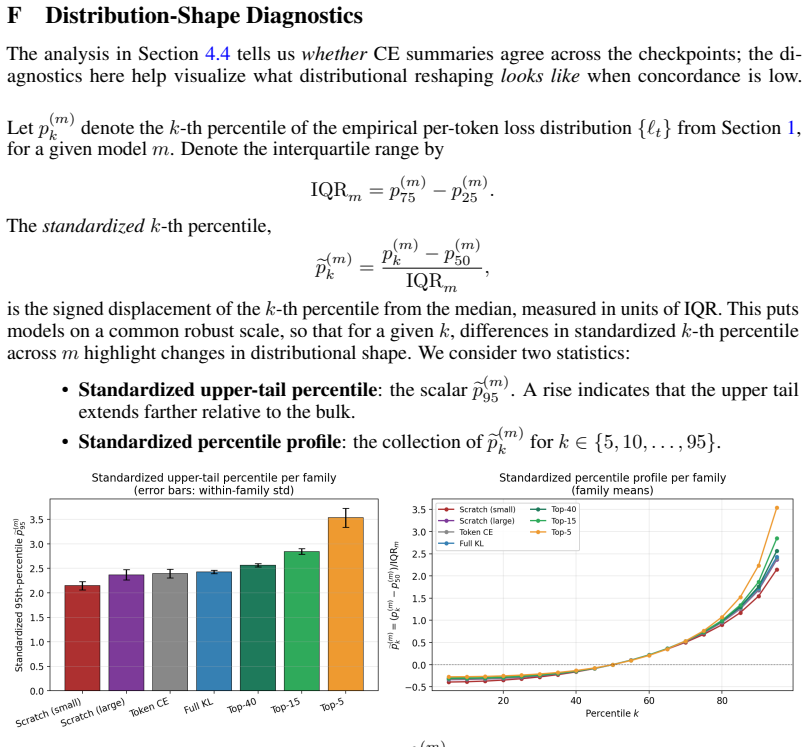
Mean cross-entropy is the standard validation metric for language models, but it can fail to track model quality during training. We examine this in two common scenarios. First, in Qwen2.5-1.5B SFT on synthetic fact-learning, we find that mean CE rises substantially after the initial learning phase while held-out fact-recall accuracy remains near its peak. Second, we find that in top-K distillation on TinyStories, decreasing K improves median CE while worsening mean CE; the Top-5 student attains the highest LLM-judge score and crosses below its teacher on median CE, despite having the worst mean CE. In both cases, median CE correlates much more closely with task performance than does mean CE. Analyzing how bulk and tail percentile CE move during training reveals that training reshapes the empirical per-token CE distribution. In top-K distillation, smaller K yields a distribution with more mass at both extremes, decreasing the median and increasing the mean. In Qwen SFT, the bulk saturates quickly while the tail extends in the latter half of training. In both, the task-evaluation metric appears more sensitive to the bulk than to the tail. Practically, we recommend reporting a small set of percentile CE summaries alongside the mean, and using concordance among them as a tool to keep track of distribution reshaping, as well as a low-cost diagnostic for when mean and median CE disagree on model selection.
Figures
Figures from the paper (8 more)
Reference graph
Works this paper leans on
-
[1]
Don't Ignore the Tail: Decoupling top-K Probabilities for Efficient Language Model Distillation
Sayantan Dasgupta et al. Don’t ignore the tail: Decoupling top-K probabilities for efficient language model distillation.arXiv preprint arXiv:2602.20816,
-
[2]
TinyStories: How Small Can Language Models Be and Still Speak Coherent English?
Ronen Eldan and Yuanzhi Li. Tinystories: How small can language models be and still speak coherent English?arXiv preprint arXiv:2305.07759,
-
[3]
MiniLLM: On-Policy Distillation of Large Language Models
Yuxian Gu, Li Dong, Furu Wei, and Minlie Huang. MiniLLM: Knowledge distillation of large language models.arXiv preprint arXiv:2306.08543,
-
[4]
Distilling the Knowledge in a Neural Network
Geoffrey Hinton, Oriol Vinyals, and Jeff Dean. Distilling the knowledge in a neural network.arXiv preprint arXiv:1503.02531,
-
[5]
Xiaoqi Jiao, Yichun Yin, Lifeng Shang, Xin Jiang, Xiao Chen, Linlin Li, Fang Wang, and Qun Liu. Tinybert: Distilling bert for natural language understanding.arXiv preprint arXiv:1909.10351,
-
[6]
The FineWeb Datasets: Decanting the Web for the Finest Text Data at Scale
Guilherme Penedo, Hynek Kydlí ˇcek, Alessandro Cappelli, Haitz Saez de Ocáriz Borde, et al. The fineweb datasets: Decanting the web for the finest text data at scale.arXiv preprint arXiv:2406.17557,
-
[7]
arXiv preprint arXiv:2405.10938 , year=
Yangjun Ruan, Chris J Maddison, and Tatsunori Hashimoto. Observational scaling laws and the predictability of language model performance.arXiv preprint arXiv:2405.10938,
-
[8]
DistilBERT, a distilled version of BERT: smaller, faster, cheaper and lighter
Victor Sanh, Lysandre Debut, Julien Chaumond, and Thomas Wolf. Distilbert, a distilled version of bert: smaller, faster, cheaper and lighter.arXiv preprint arXiv:1910.01108,
work page Pith review arXiv 1910
Show all 13 references
-
[9]
Retentive network: A successor to transformer for large language models.arXiv preprint arXiv:2307.08621,
Yutao Sun, Li Dong, Shaohan Huang, Shuming Ma, Yuqing Xia, Jilong Xue, Jianyong Wang, and Furu Wei. Retentive network: A successor to transformer for large language models.arXiv preprint arXiv:2307.08621,
-
[10]
Qwen2.5 technical report.arXiv preprint arXiv:2412.15115,
Qwen Team. Qwen2.5 technical report.arXiv preprint arXiv:2412.15115,
-
[11]
?”. Examples include“Complete: Above Nimbusglade floats ___
Correct vs. incorrect CE split.For each epoch we compute mean CE separately on examples answered correctly vs. incorrectly under greedy decoding (Table 6). After the early-training improve- ment (epoch 1→4–5), mean CE rises onbothsubsets, while the ratio CE(incorrect)/CE(corre...
-
[12]
Large”; 4-layer, 256-dim, 4 heads,∼8M params for “Small
Pass@5 (any-of-5 sampled correctness) sits in 0.82–0.93 and shows the same shape. Error bars on pass@1 are within-prompt 95% CIs from theN=5sampling variance (≤ ±0.7%). 13 C TinyStories Protocol and Checkpoints LLM-as-judge protocol Prompts and generation.We draw 200 prompts o...
2016
-
[13]
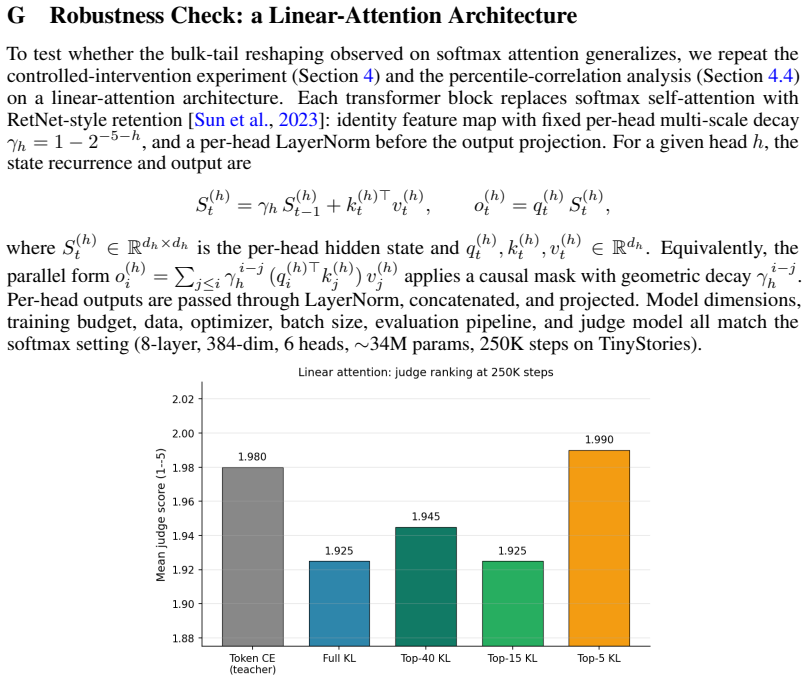
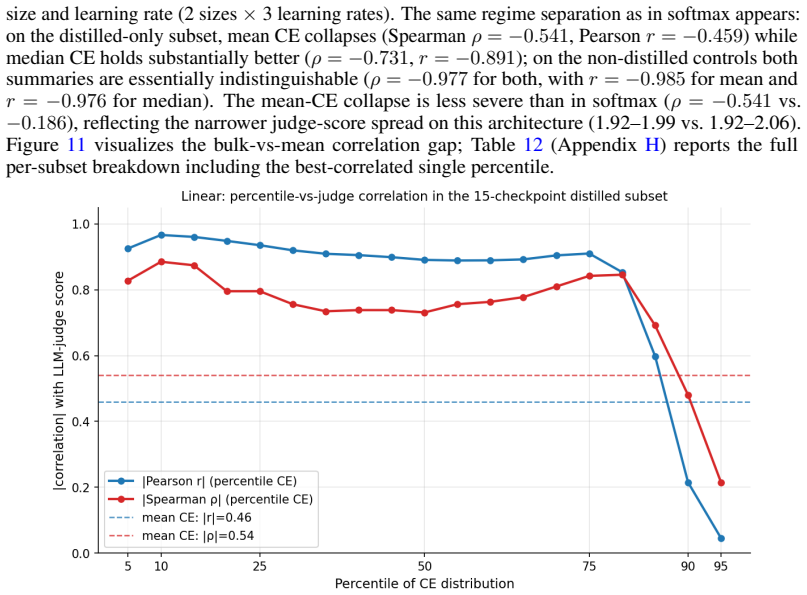
and the percentile-correlation analysis (Section 4.4) on a linear-attention architecture. Each transformer block replaces softmax self-attention with RetNet-style retention [Sun et al., 2023]: identity feature map with fixed per-head multi-scale decay γh = 1−2 −5−h, and a per-...
2023
Reviewed June 30, 2026 · model on record in the stance chip above.
Discussion (0). Continue with ORCID to comment.