Cohort Organized Learning: Clustering Through Agreement
Pith reviewed 2026-06-26 12:23 UTC · model grok-4.3
The pith
CoOL clusters data by training neural networks to maximize agreement among cohort assignments without using distance or similarity measures.
A machine-rendered reading of the paper's core claim, the machinery that carries it, and where it could break.
Core claim
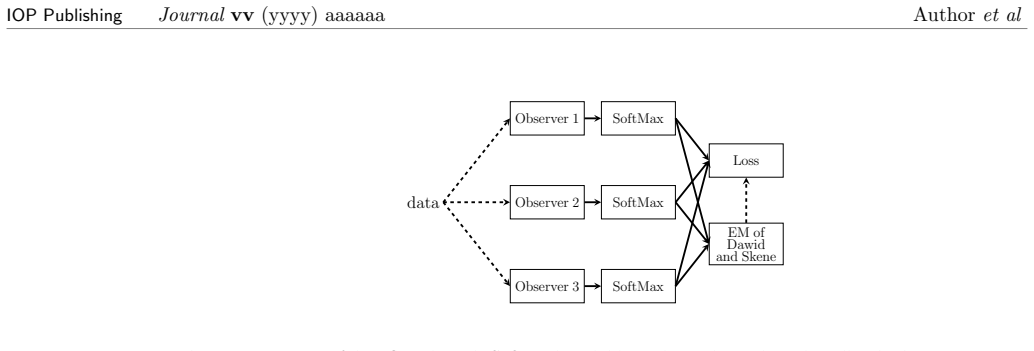
CoOL performs clustering by feeding data into neural networks whose outputs define cohort memberships; these networks are trained by maximizing an agreement objective whose gradients are derived from the expectation-maximization algorithm, thereby producing cluster assignments for any data type compatible with the networks, illustrated on vectors and images.
What carries the argument
The agreement objective optimized by EM-derived gradients on neural networks, which produces stable cohort assignments by encouraging consistent predictions across data points.
If this is right
- Clustering becomes possible for data where no natural distance function exists.
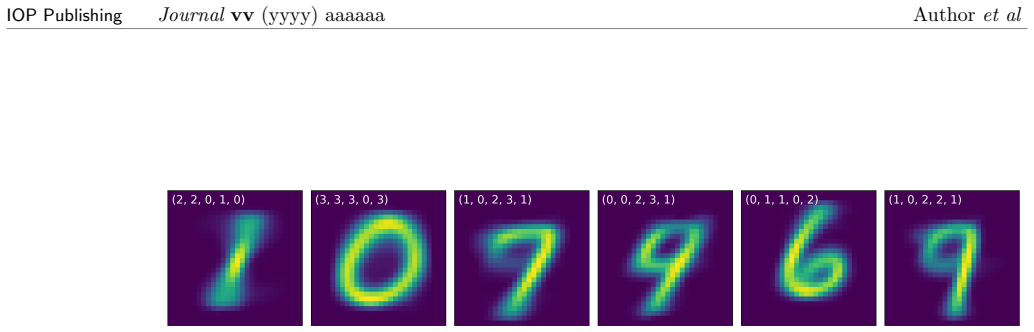
- The same networks can be applied directly to images without first extracting features or similarities.
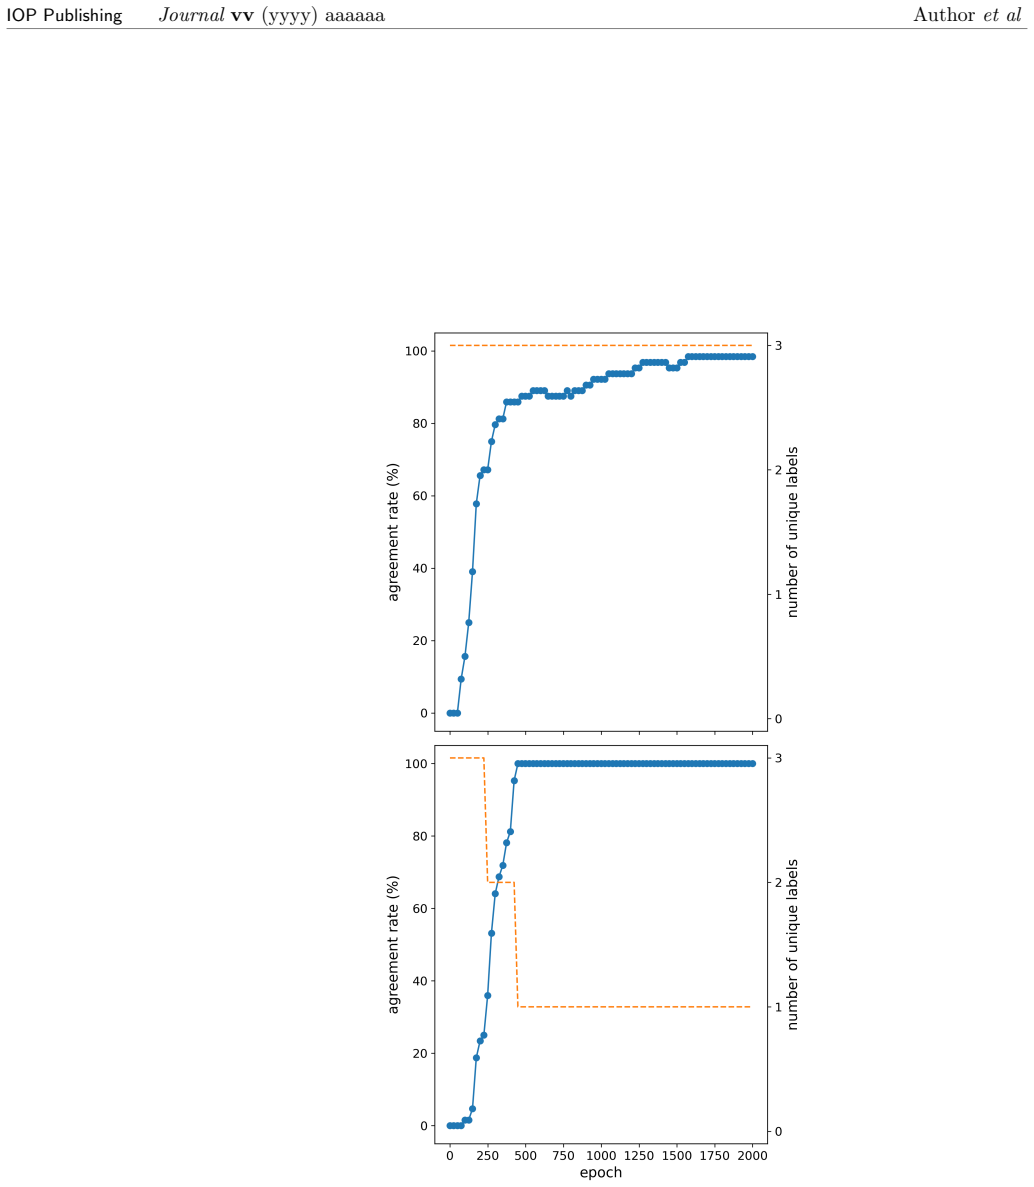
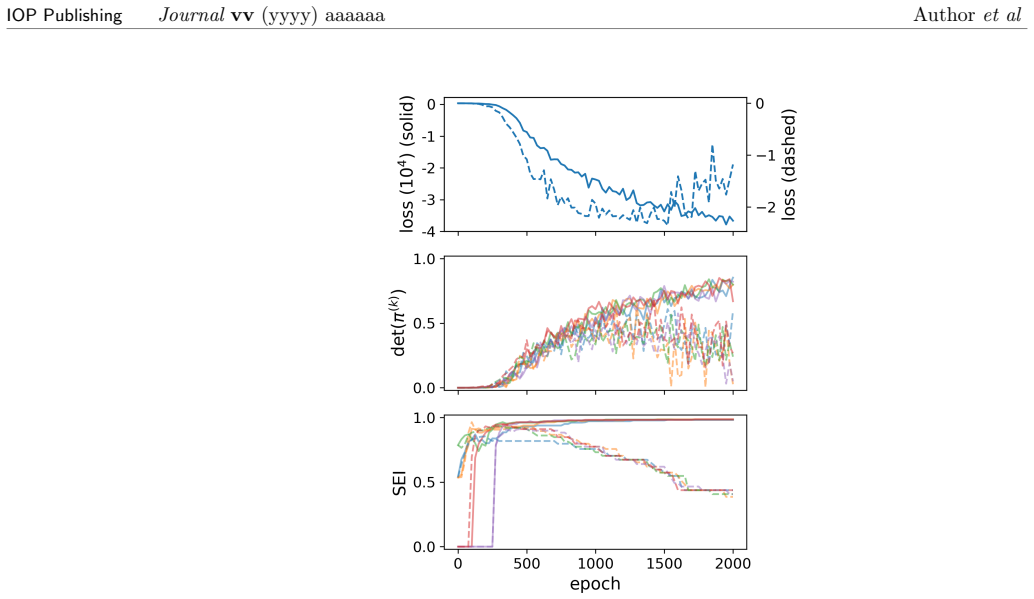
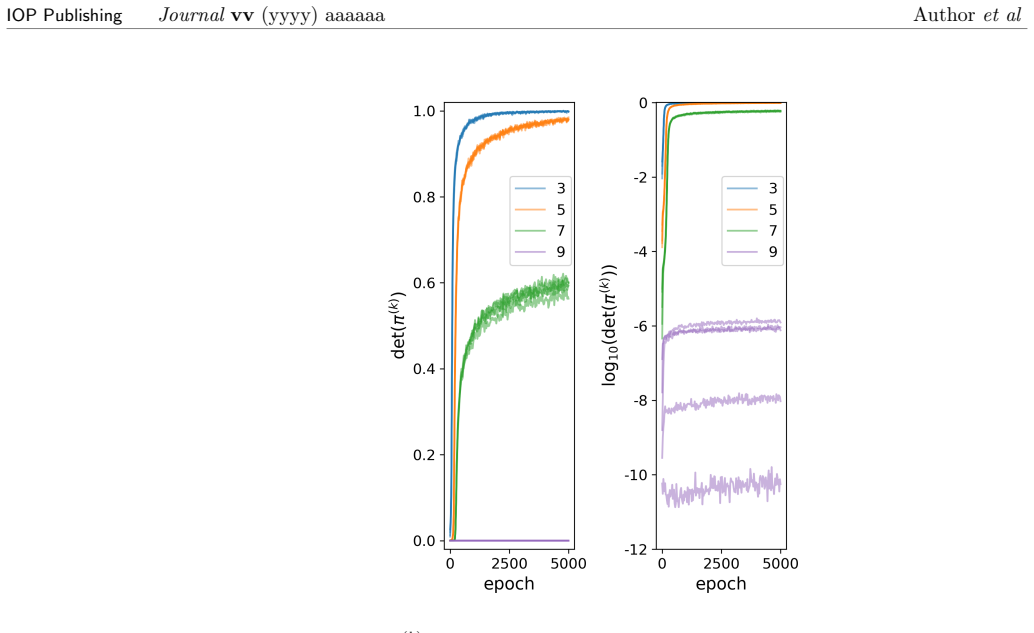
- Training progress can be tracked by monitoring the agreement objective and convergence criteria described in the method.
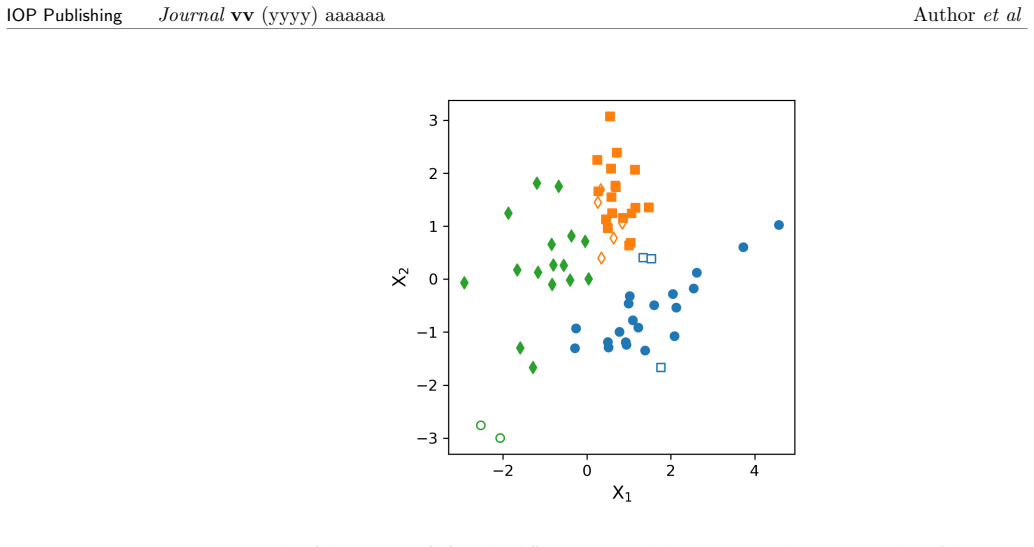
- Cluster quality can be assessed after training using the evaluation procedures outlined.
Where Pith is reading between the lines
- The approach may combine with other neural unsupervised objectives to handle mixed data types in one pipeline.
- It opens a route to clustering tasks where similarity is defined implicitly by the network architecture rather than by the user.
- Extensions could test whether the same agreement mechanism improves semi-supervised settings with partial labels.
Load-bearing premise
That training neural networks on the agreement objective will yield non-degenerate, meaningful cluster assignments rather than arbitrary or collapsed groupings.
What would settle it
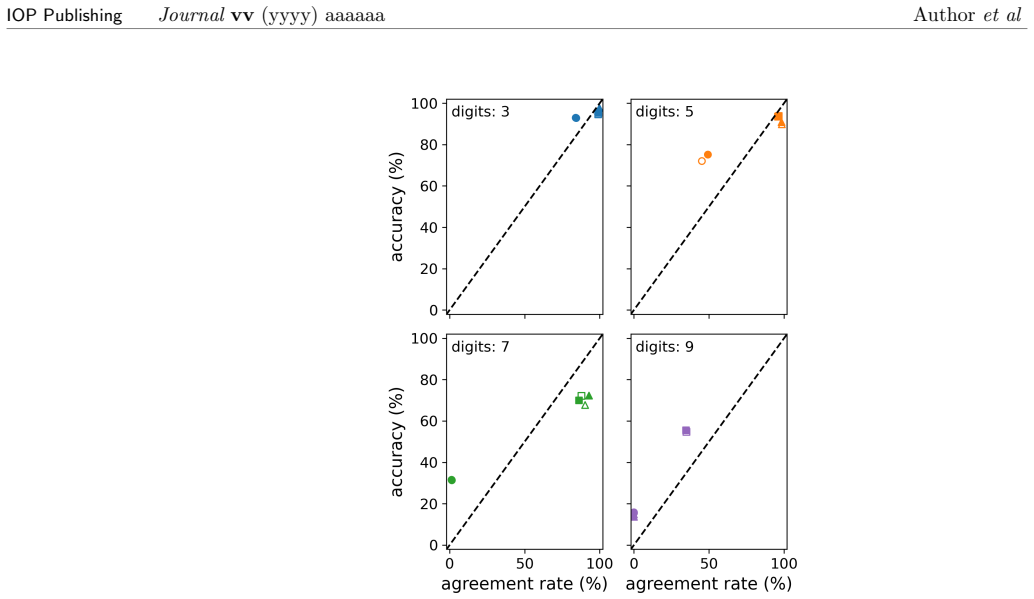
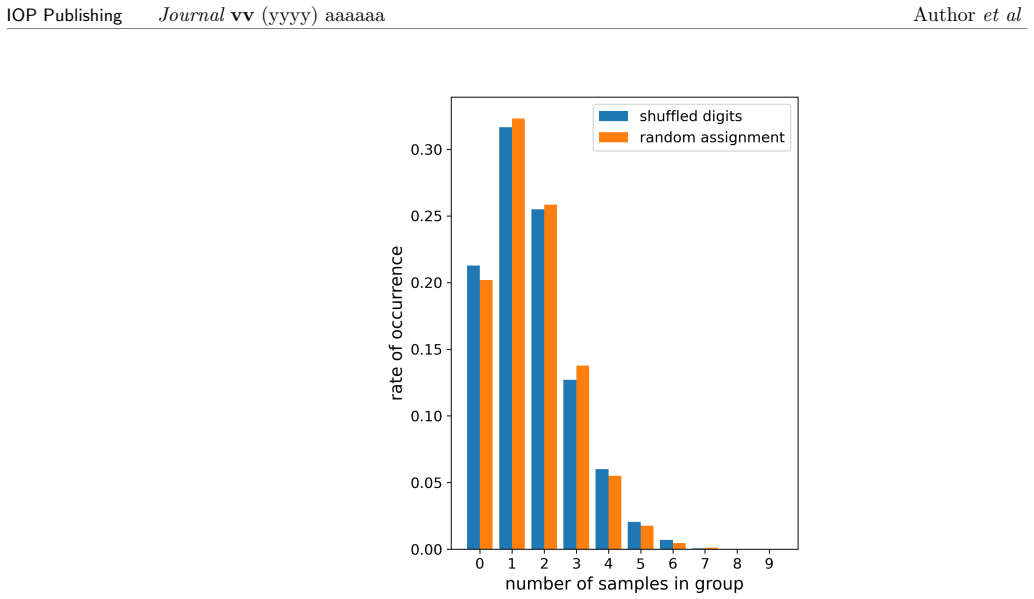
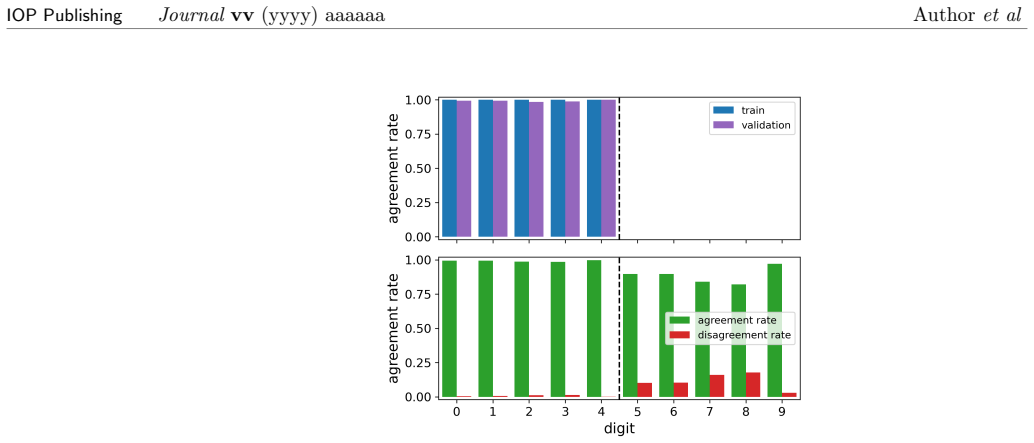
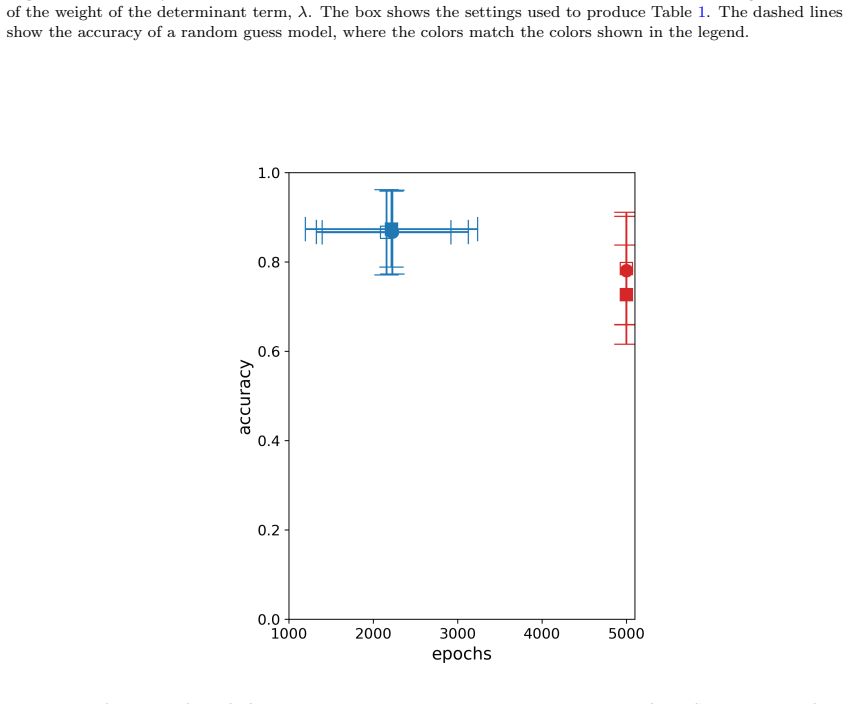
Run CoOL on a standard labeled dataset such as MNIST and check whether the resulting clusters align with the known digit labels better than random assignment.
Figures
read the original abstract
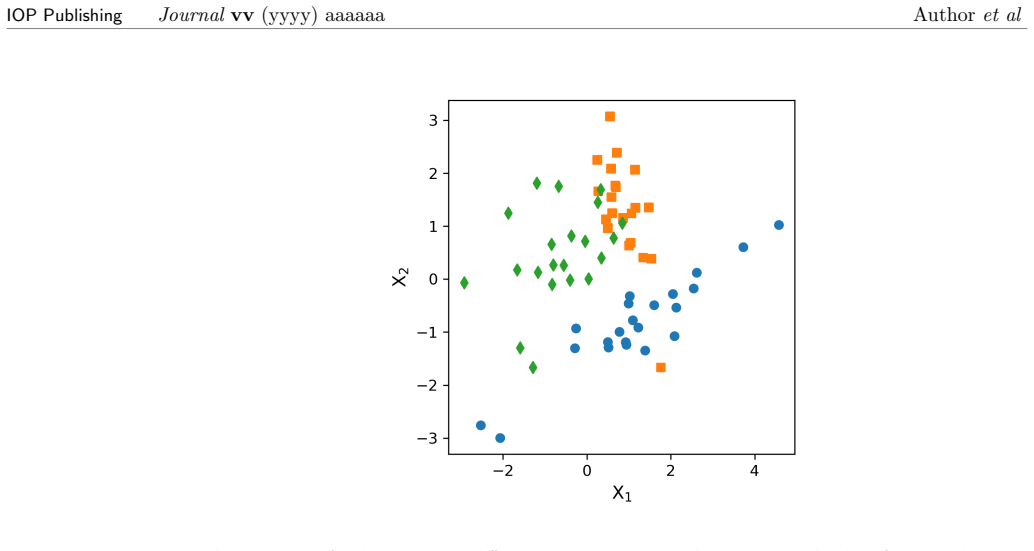
In this article we describe Cohort Organized Learning (CoOL), a method for clustering data without explicit distance or similarity computations. Herein, we will describe CoOL, derive the gradients determined by expectation maximization to train the networks, show how to monitor convergence during training and evaluate the clusters after training, and discuss a series of examples and use cases. We also discuss CoOL's limitations and future prospects on related tasks. Because CoOL uses neural networks to estimate the clusters, it can be used to cluster any data that can be made compatible and we illustrate this on vector data and images.
Editorial analysis
A structured set of objections, weighed in public.
Referee Report
Summary. The paper introduces Cohort Organized Learning (CoOL), a clustering approach that trains neural networks to assign data points to cohorts by optimizing an agreement objective whose gradients are derived via expectation maximization (EM). It claims this avoids explicit distance or similarity computations, applies to vector data and images, includes derivations of the gradients, methods for monitoring convergence and evaluating clusters post-training, example use cases, and discussion of limitations and future work.
Significance. If the central claim holds and the optimization yields non-degenerate, data-driven partitions, CoOL would offer a distance-free clustering method that exploits neural network flexibility for heterogeneous inputs. The explicit derivation of EM gradients and convergence monitoring would be strengths, as would any reproducible code or falsifiable predictions on standard benchmarks.
major comments (2)
- [Abstract / gradient derivation] Abstract and gradient derivation section: the central claim that CoOL produces meaningful clusters rests on the unexamined assumption that fixed points of the agreement objective correspond to semantically coherent partitions rather than trivial solutions (e.g., all points assigned to one cohort). No analysis, fixed-point characterization, or regularization term is supplied to exclude such attractors, which directly undermines the claim that the method clusters data without explicit distances.
- [Examples and evaluation] Examples and evaluation section: the manuscript states it will 'evaluate the clusters after training' and 'discuss a series of examples,' yet the provided abstract supplies neither quantitative recovery metrics on labeled benchmarks (e.g., adjusted Rand index on MNIST or UCI datasets) nor ablation showing that performance exceeds chance or collapsed assignments. Without such evidence the empirical support for non-degenerate behavior is absent.
minor comments (1)
- [Abstract] The abstract promises derivations, convergence monitoring, and use-case discussions but contains no equations, pseudocode, or numerical results; moving at least one key gradient expression or convergence criterion into the abstract would improve readability.
Simulated Author's Rebuttal
We thank the referee for the detailed and constructive report. The two major comments identify important gaps in theoretical analysis and empirical validation. We respond to each below and commit to revisions where the manuscript is incomplete.
read point-by-point responses
-
Referee: [Abstract / gradient derivation] Abstract and gradient derivation section: the central claim that CoOL produces meaningful clusters rests on the unexamined assumption that fixed points of the agreement objective correspond to semantically coherent partitions rather than trivial solutions (e.g., all points assigned to one cohort). No analysis, fixed-point characterization, or regularization term is supplied to exclude such attractors, which directly undermines the claim that the method clusters data without explicit distances.
Authors: We agree that the manuscript lacks a fixed-point analysis or explicit safeguards against collapse. The current text derives the EM gradients and describes convergence monitoring but does not characterize the attractors of the agreement objective. In revision we will add a dedicated subsection that (i) identifies conditions under which the all-in-one-cohort assignment is or is not a fixed point and (ii) shows how the per-cohort network parameterization and the monitoring procedure reduce the likelihood of trivial solutions. We will also examine whether a simple entropy or diversity regularizer is needed. revision: yes
-
Referee: [Examples and evaluation] Examples and evaluation section: the manuscript states it will 'evaluate the clusters after training' and 'discuss a series of examples,' yet the provided abstract supplies neither quantitative recovery metrics on labeled benchmarks (e.g., adjusted Rand index on MNIST or UCI datasets) nor ablation showing that performance exceeds chance or collapsed assignments. Without such evidence the empirical support for non-degenerate behavior is absent.
Authors: The full manuscript contains an evaluation procedure and illustrative examples, but these are qualitative. We accept that quantitative recovery metrics (adjusted Rand index, normalized mutual information) on standard labeled benchmarks and explicit checks against chance or collapsed assignments are required to substantiate non-degenerate behavior. We will add these experiments, including ablations on network capacity and initialization, to the revised manuscript. revision: yes
Circularity Check
No circularity detected; derivation chain not reducible to inputs from available text
full rationale
The abstract outlines a derivation of EM-based gradients for training on an agreement objective and claims clustering without explicit distances, but supplies no equations, fitted parameters presented as predictions, or self-citations that could be inspected for self-definitional, load-bearing, or ansatz-smuggling patterns. No load-bearing step is visible that reduces by construction to its own inputs, and the central claim of producing meaningful clusters rests on the optimization behavior rather than a tautological renaming or fit. The provided text is therefore self-contained against external benchmarks for the purpose of this circularity check.
Axiom & Free-Parameter Ledger
Reference graph
Works this paper leans on
-
[1]
DIII-D data management,
B. McHarg, J. Burruss, J. Freeman, C. Parker, J. Schachter, and D. Schissel, “DIII-D data management,”Fusion Engineering and Design, vol. 60, pp. 305–309, June 2002
2002
-
[2]
Iterdb—the data archiving system for iter,
G. Abla, G. Heber, D. P. Schissel, D. Robinson, L. Abadie, A. Wallander, and S. M. Flanagan, “Iterdb—the data archiving system for iter,”Fusion Engineering and Design, vol. 89, no. 5, pp. 536–541, 2014. Proceedings of the 9th IAEA Technical Meeting on Control, Data Acquisition, and Remote Participation for Fusion Research
2014
-
[3]
How to manage 2 petabytes of new data every day
P. Brans, “How to manage 2 petabytes of new data every day.” https://www.iter.org/node/20687/how-manage-2-petabytes-new-data-every-day. Accessed: 2025-12-09
2025
-
[4]
The Data Acquisition System of the LZ Dark Matter Detector: FADR,
J. Aalbers, D. S. Akerib,et al., “The Data Acquisition System of the LZ Dark Matter Detector: FADR,” Aug. 2024. arXiv:2405.14732 [physics]. 20 IOP PublishingJournalvv(yyyy) aaaaaa Authoret al
-
[5]
The xenon program for dark matter direct detection,
E. Aprile, “The xenon program for dark matter direct detection,”Nuclear Physics B, vol. 1003, p. 116463, 2024. Special Issue of Nobel Symposium 182 on Dark Matter
2024
-
[6]
Massive Scale Data Analytics at LCLS-II,
J. Thayer, Z. Chen, R. Claus, D. Damiani, C. Ford, M. Dubrovin, V. Elmir, W. Kroeger, X. Li, S. Marchesini, V. Mariani, R. Melcchiori, S. Nelson, A. Peck, A. Perazzo, F. Poitevin, C. P. O’Grady, J. Otero, O. Quijano, M. Shankar, M. Uervirojnangkoorn, R. Veraldi, M. Weaver, C. Weninger, S. Yamajala, C. Wang, and C. H. Yoon, “Massive Scale Data Analytics at...
2024
-
[7]
Data management at the advanced photon source,
N. Schwarz, S. Veseli, and D. Jarosz, “Data management at the advanced photon source,” Synchrotron Radiation News, vol. 32, no. 3, pp. 13–18, 2019
2019
-
[8]
LSST: from Science Drivers to Reference Design and Anticipated Data Products
Z. Ivezic, S. M. Kahn,et al., “LSST: from Science Drivers to Reference Design and Anticipated Data Products,”The Astrophysical Journal, vol. 873, p. 111, Mar. 2019. arXiv:0805.2366 [astro-ph]
work page internal anchor Pith review Pith/arXiv arXiv 2019
-
[9]
Prototyping a Bulk Data Management System for CTAO with Rucio,
S. Hasan, M. Allaux, A. Biland, F. Gillardo, H. Li, M. Linhoff, E. Lyard, M. Pierre, V. Savchenko, and R. Walter, “Prototyping a Bulk Data Management System for CTAO with Rucio,” inProceedings of 39th International Cosmic Ray Conference, vol. 501, (Geneva, Switzerland), p. 672, July 2025
2025
-
[10]
Expected performance of the atlas experiment - detector, trigger and physics,
The ATLAS Collaboration, “Expected performance of the atlas experiment - detector, trigger and physics,” 2009
2009
-
[11]
Scientific computing plan for the ECCE detector at the Electron Ion Collider,
J. Bernauer, C. Dean,et al., “Scientific computing plan for the ECCE detector at the Electron Ion Collider,”Nuclear Instruments and Methods in Physics Research Section A: Accelerators, Spectrometers, Detectors and Associated Equipment, vol. 1047, p. 167859, Feb. 2023
2023
-
[12]
James, D
G. James, D. Witten, T. Hastie, and R. Tibshirani,An Introduction to Statistical Learning: with Applications in R. Springer, 2013
2013
-
[13]
Data Clustering: A Review,
A. K. Jain, M. Murty, and P. J. Flynn, “Data Clustering: A Review,”ACM Computing Surveys, vol. 31, pp. 264–323, Sept. 1999
1999
-
[14]
A review of clustering techniques and developments,
A. Saxena, M. Prasad, A. Gupta, N. Bharill, O. P. Patel, A. Tiwari, M. J. Er, W. Ding, and C.-T. Lin, “A review of clustering techniques and developments,”Neurocomputing, vol. 267, pp. 664–681, Dec. 2017
2017
-
[15]
A Rapid Review of Clustering Algorithms,
H. Yin, A. Aryani, S. Petrie, A. Nambissan, A. Astudillo, and S. Cao, “A Rapid Review of Clustering Algorithms,” Jan. 2024
2024
-
[16]
Maximum Likelihood from Incomplete Data Via theEMAlgorithm,
A. P. Dempster, N. M. Laird, and D. B. Rubin, “Maximum Likelihood from Incomplete Data Via theEMAlgorithm,”Journal of the Royal Statistical Society Series B: Statistical Methodology, vol. 39, pp. 1–22, Sept. 1977
1977
-
[17]
The MNIST Database of Handwrit- ten Digits,
Y. LeCun, C. Cortes, and C. J. C. Burges, “The MNIST Database of Handwrit- ten Digits,” 1998
1998
-
[18]
Maximum likelihood estimation of observer error-rates using the em algorithm,
A. P. Dawid and A. M. Skene, “Maximum likelihood estimation of observer error-rates using the em algorithm,”Applied Statistics, vol. 28, no. 1, p. 20, 1979
1979
-
[19]
Empirical Evaluation of Rectified Activations in Convolutional Network
B. Xu, N. Wang, T. Chen, and M. Li, “Empirical Evaluation of Rectified Activations in Convolutional Network,” Nov. 2015. arXiv:1505.00853 [cs]
work page internal anchor Pith review Pith/arXiv arXiv 2015
-
[20]
DBSCAN Revisited, Revisited: Why and How You Should (Still) Use DBSCAN,
E. Schubert, J. Sander, M. Ester, H. P. Kriegel, and X. Xu, “DBSCAN Revisited, Revisited: Why and How You Should (Still) Use DBSCAN,”ACM Transactions on Database Systems, vol. 42, pp. 1–21, Sept. 2017
2017
-
[21]
OPTICS: Ordering Points to Identify the Clustering Structure,
M. Ankerst, M. M. Breunig, H.-P. Kriegel, and J. Sander, “OPTICS: Ordering Points to Identify the Clustering Structure,”ACM SIGMOD Record, vol. 28, pp. 49–60, June 1999
1999
-
[22]
A tutorial on spectral clustering,
U. Von Luxburg, “A tutorial on spectral clustering,”Statistics and Computing, vol. 17, pp. 395–416, Dec. 2007
2007
-
[23]
Hastie, R
T. Hastie, R. Tibshirani, and J. Friedman,The Elements of Statistical Learning: Data Mining, Inference, and Prediction. Springer, 2017. 2nd edition. 21 IOP PublishingJournalvv(yyyy) aaaaaa Authoret al
2017
-
[24]
Adam: A method for stochastic optimization,
D. P. Kingma and J. Ba, “Adam: A method for stochastic optimization,” 2017
2017
-
[25]
Support-vector networks,
C. Cortes and V. Vapnik, “Support-vector networks,”Machine Learning, vol. 20, pp. 273–297, Sept. 1995
1995
-
[26]
Sparse Subspace Clustering: Algorithm, Theory, and Applications
E. Elhamifar and R. Vidal, “Sparse Subspace Clustering: Algorithm, Theory, and Applications,” Feb. 2013. arXiv:1203.1005 [cs]
work page internal anchor Pith review Pith/arXiv arXiv 2013
-
[27]
A comprehensive survey on deep clustering: Taxonomy, challenges, and future directions,
S. Zhou, H. Xu, Z. Zheng, J. Chen, Z. li, J. Bu, J. Wu, X. Wang, W. Zhu, and M. Ester, “A Comprehensive Survey on Deep Clustering: Taxonomy, Challenges, and Future Directions,” June 2022. arXiv:2206.07579 [cs]
-
[28]
Improved Deep Embedded Clustering with Local Structure Preservation,
X. Guo, L. Gao, X. Liu, and J. Yin, “Improved Deep Embedded Clustering with Local Structure Preservation,” inProceedings of the Twenty-Sixth International Joint Conference on Artificial Intelligence, (Melbourne, Australia), pp. 1753–1759, International Joint Conferences on Artificial Intelligence Organization, Aug. 2017
2017
-
[29]
Deep clustering with concrete k-means,
B. Gao, Y. Yang, H. Gouk, and T. M. Hospedales, “Deep clustering with concrete k-means,” Oct. 2019. arXiv:1910.08031 [cs]
-
[30]
SPICE: Semantic Pseudo-labeling for Image Clustering,
C. Niu, H. Shan, and G. Wang, “SPICE: Semantic Pseudo-labeling for Image Clustering,” IEEE Transactions on Image Processing, vol. 31, pp. 7264–7278, 2022. arXiv:2103.09382 [cs]
-
[31]
arXiv preprint arXiv:2201.10000 , year=
Z. Li, Y. Chen, Y. LeCun, and F. T. Sommer, “Neural Manifold Clustering and Embedding,” Jan. 2022. arXiv:2201.10000 [cs]
-
[32]
XAI Beyond Classification: Interpretable Neural Clustering,
X. Peng, Y. Li, I. W. Tsang, H. Zhu, J. Lv, and J. T. Zhou, “XAI Beyond Classification: Interpretable Neural Clustering,” Apr. 2022. arXiv:1808.07292 [cs]
-
[33]
Interpretable Deep Clustering for Tabular Data,
J. Svirsky and O. Lindenbaum, “Interpretable Deep Clustering for Tabular Data,” June 2024
2024
-
[34]
Pseudo-supervised Deep Subspace Clustering,
J. Lv, Z. Kang, X. Lu, and Z. Xu, “Pseudo-supervised Deep Subspace Clustering,”IEEE Transactions on Image Processing, vol. 30, pp. 5252–5263, 2021. arXiv:2104.03531 [cs]
-
[35]
SpectralNet: Spectral Clustering using Deep Neural Networks,
U. Shaham, K. Stanton, H. Li, B. Nadler, R. Basri, and Y. Kluger, “SpectralNet: Spectral Clustering using Deep Neural Networks,” Apr. 2018. arXiv:1801.01587 [stat]
-
[36]
Joint Unsupervised Learning of Deep Representations and Image Clusters
J. Yang, D. Parikh, and D. Batra, “Joint Unsupervised Learning of Deep Representations and Image Clusters,” June 2016. arXiv:1604.03628 [cs]
work page internal anchor Pith review Pith/arXiv arXiv 2016
-
[37]
Efficient Deep Embedded Subspace Clustering,
J. Cai, J. Fan, W. Guo, S. Wang, Y. Zhang, and Z. Zhang, “Efficient Deep Embedded Subspace Clustering,” in2022 IEEE/CVF Conference on Computer Vision and Pattern Recognition (CVPR), (New Orleans, LA, USA), pp. 21–30, June 2022
2022
-
[38]
UNSUPERVISED CLUSTERING USING PSEUDO-SEMI- SUPERVISED LEARNING,
D. Gupta and R. Ramjee, “UNSUPERVISED CLUSTERING USING PSEUDO-SEMI- SUPERVISED LEARNING,” inProceedings of 8th International Conference on Learning Representations, (Addis Ababa, Ethiopia), 2020
2020
-
[39]
A SURVEY OF CLUSTERING ENSEMBLE ALGORITHMS,
S. Vega-Pons and J. Ruiz-Shulcloper, “A SURVEY OF CLUSTERING ENSEMBLE ALGORITHMS,”International Journal of Pattern Recognition and Artificial Intelligence, vol. 25, pp. 337–372, May 2011
2011
-
[40]
Combining multiple weak clusterings,
A. Topchy, A. Jain, and W. Punch, “Combining multiple weak clusterings,” inThird IEEE International Conference on Data Mining, (Melbourne, FL, USA), pp. 331–338, IEEE Comput. Soc, 2003
2003
-
[41]
A Mixture Model for Clustering Ensembles,
A. Topchy, A. K. Jain, and W. Punch, “A Mixture Model for Clustering Ensembles,” in Proceedings of the 2004 SIAM International Conference on Data Mining, pp. 379–390, Society for Industrial and Applied Mathematics, Apr. 2004
2004
-
[42]
Clustering ensembles: models of consensus and weak partitions,
A. Topchy, A. Jain, and W. Punch, “Clustering ensembles: models of consensus and weak partitions,”IEEE Transactions on Pattern Analysis and Machine Intelligence, vol. 27, pp. 1866–1881, Dec. 2005
2005
-
[43]
Neural Expectation Maximization,
K. Greff, S. v. Steenkiste, and J. Schmidhuber, “Neural Expectation Maximization,” Nov
-
[44]
Neural Expectation Maximization
arXiv:1708.03498 [cs]. 22 IOP PublishingJournalvv(yyyy) aaaaaa Authoret al
work page internal anchor Pith review Pith/arXiv arXiv
-
[45]
Using the EM Algorithm to Train Neural Networks: Misconceptions and a New Algorithm for Multiclass Classification,
S.-K. Ng and G. McLachlan, “Using the EM Algorithm to Train Neural Networks: Misconceptions and a New Algorithm for Multiclass Classification,”IEEE Transactions on Neural Networks, vol. 15, pp. 738–749, May 2004
2004
-
[46]
Neural mixture models with expectation-maximization for end-to-end deep clustering,
D. Tissera, K. Vithanage, R. Wijesinghe, A. Xavier, S. Jayasena, S. Fernando, and R. Rodrigo, “Neural mixture models with expectation-maximization for end-to-end deep clustering,”Neurocomputing, vol. 505, pp. 249–262, Sept. 2022
2022
-
[47]
Neural Network based Explicit Mixture Models and Expectation-maximization based Learning,
D. Liu, M. T. Vu, S. Chatterjee, and L. K. Rasmussen, “Neural Network based Explicit Mixture Models and Expectation-maximization based Learning,” May 2020. arXiv:1907.13432 [cs]
-
[48]
A Neural Expectation-Maximization Framework for Noisy Multi-Label Text Classification,
J. Chen, R. Zhang, J. Xu, C. Hu, and Y. Mao, “A Neural Expectation-Maximization Framework for Noisy Multi-Label Text Classification,”IEEE Transactions on Knowledge and Data Engineering, vol. 35, pp. 10992–11003, Nov. 2023
2023
-
[49]
Deep Canonical Correlation Analysis,
G. Andrew, R. Arora, J. Bilmes, and K. Livescu, “Deep Canonical Correlation Analysis,” in Proceedings of the 30th International Conference on Machine Learning, vol. 28(3), pp. 1247–1255, 2013
2013
-
[50]
An intercomparison of methods for finding coupled patterns in climate data,
C. S. Bretherton, C. Smith, and J. M. Wallace, “An intercomparison of methods for finding coupled patterns in climate data,”Journal of Climate, vol. 5, no. 6, pp. 541 – 560, 1992
1992
-
[51]
Vitac: Feature sharing between vision and tactile sensing for cloth texture recognition,
S. Luo, W. Yuan, E. Adelson, A. G. Cohn, and R. Fuentes, “Vitac: Feature sharing between vision and tactile sensing for cloth texture recognition,” 2018
2018
-
[52]
Coincident learning for unsupervised anomaly detection of scientific instruments,
R. Humble, Z. Zhang, F. O’Shea, E. Darve, and D. Ratner, “Coincident learning for unsupervised anomaly detection of scientific instruments,”Machine Learning: Science and Technology, vol. 5, p. 035036, Sept. 2024
2024
-
[53]
I. H. Witten and E. Frank,Data Mining: Practical Machine Learning Tools and Techniques. Morgan Kaufmann, 2nd ed., 2005
2005
-
[54]
Comparing partitions,
L. Hubert and P. Arabie, “Comparing partitions,”Journal of Classification, vol. 2, pp. 193–218, Dec. 1985
1985
-
[55]
Scikit-learn: Machine learning in Python,
F. Pedregosa, G. Varoquaux, A. Gramfort, V. Michel, B. Thirion, O. Grisel, M. Blondel, P. Prettenhofer, R. Weiss, V. Dubourg, J. Vanderplas, A. Passos, D. Cournapeau, M. Brucher, M. Perrot, and E. Duchesnay, “Scikit-learn: Machine learning in Python,”Journal of Machine Learning Research, vol. 12, pp. 2825–2830, 2011
2011
-
[56]
Unsupervised Deep Embedding for Clustering Analysis
J. Xie, R. Girshick, and A. Farhadi, “Unsupervised Deep Embedding for Clustering Analysis,” May 2016. arXiv:1511.06335 [cs]
work page internal anchor Pith review Pith/arXiv arXiv 2016
-
[57]
Inductive Representation Learning on Large Graphs
W. L. Hamilton, R. Ying, and J. Leskovec, “Inductive Representation Learning on Large Graphs,” Sept. 2018. arXiv:1706.02216 [cs]
work page internal anchor Pith review Pith/arXiv arXiv 2018
-
[58]
Single-Model Uncertainties for Deep Learning,
N. Tagasovska and D. Lopez-Paz, “Single-Model Uncertainties for Deep Learning,” in Proceedings of 33rd Conference on Neural Information Processing Systems, (Vancouver, Canada), Dec. 2019
2019
-
[59]
Data-driven gradient optimization for field emission management in a superconducting radio-frequency linac,
S. Goldenberg, K. Ahammed, A. Carpenter, J. Li, R. Suleiman, and C. Tennant, “Data-driven gradient optimization for field emission management in a superconducting radio-frequency linac,”Physical Review Accelerators and Beams, vol. 28, p. 044603, Apr. 2025
2025
-
[60]
A mathematical theory of communication,
C. E. Shannon, “A mathematical theory of communication,”The Bell System Technical Journal, vol. 27, no. 3, pp. 379–423, 1948
1948
-
[61]
Automatic differentiation in pytorch,
A. Paszke, S. Gross, S. Chintala, G. Chanan, E. Yang, Z. DeVito, Z. Lin, A. Desmaison, L. Antiga, and A. Lerer, “Automatic differentiation in pytorch,” inNIPS-W, 2017
2017
-
[62]
Goodfellow, Y
I. Goodfellow, Y. Bengio, and A. Courville,Deep Learning. MIT Press, 2016. http://www.deeplearningbook.org
2016
-
[63]
Learning multiple layers of features from tiny images,
A. Krizhevsky and G. Hinton, “Learning multiple layers of features from tiny images,” Tech. Rep. 0, University of Toronto, Toronto, Ontario, 2009. 23 IOP PublishingJournalvv(yyyy) aaaaaa Authoret al
2009
-
[64]
Deep Residual Learning for Image Recognition
K. He, X. Zhang, S. Ren, and J. Sun, “Deep residual learning for image recognition,”CoRR, vol. abs/1512.03385, 2015
work page internal anchor Pith review Pith/arXiv arXiv 2015
-
[65]
Torchvision: Pytorch’s computer vision library
TorchVision maintainers and contributors, “Torchvision: Pytorch’s computer vision library.” https://github.com/pytorch/vision, 2016
2016
-
[66]
Krizhevsky, V
A. Krizhevsky, V. Nair, and G. Hinton.https://www.cs.toronto.edu/ ~kriz/cifar.html, Accessed: 2025-12-16. 24
2025
discussion (0)
Sign in with ORCID, Apple, or X to comment. Anyone can read and Pith papers without signing in.