REVIEW 3 major objections 6 minor 3 cited by
This paper establishes that the MACS0647-JD system at z=10.17 is a pre-coalescence merger in which turbulent, metal-poor gas between the two stellar clumps drives the current starburst.
Reviewed by Pith at T0; open to challenge. T0 means a machine referee read the full paper against a public rubric. the ladder, T0–T4 →
T0 review · deepseek-v4-flash
2026-08-02 19:59 UTC pith:DQ2PQWUB
load-bearing objection First z>10 resolved ISM study with a clever Hβ recovery, but the merger narrative rests on a sub-PSF centroid offset that needs more work. the 3 major comments →
GA-NIFS: Dissecting The Alchemised: JWST reveals turbulent metal-poor gas fuelling a co-spatial starburst in a complex system at z=10.17
The pith
A machine-rendered reading of the paper's core claim, the machinery that carries it, and where it could break.
Core claim
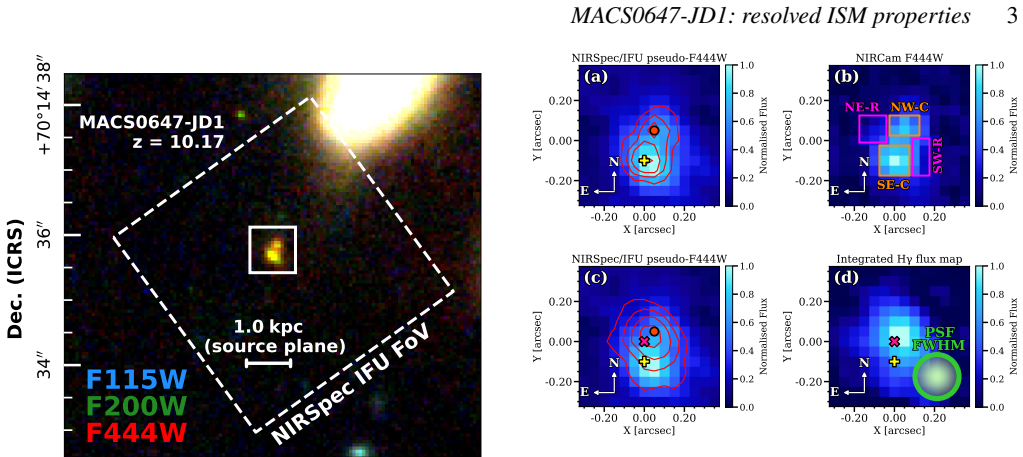
The central claim is that MACS0647-JD1 consists of two stellar components with distinct enrichment histories — the more massive south-east clump at 12+log(O/H)=7.89 and the less massive north-west clump at 7.47 — separated by only ~300 pc in the source plane. The H-gamma line-emission centroid is offset by ~0.1 arcsec (150 pc) from the stellar continuum, which coincides with the main component. Spaxel-by-spaxel maps show the region between the clumps holds the most turbulent gas (FWHM up to ~300 km/s), the lowest metallicities, and the highest star-formation burstiness, while the more massive clump is comparatively quiescent. The authors interpret this as evidence that recently accreted, dyn
What carries the argument
A PSF-matched NIRSpec/IFU data-cube with spaxel-scale spectral fitting; an extended wavelength calibration that recovers H-beta beyond the nominal G395M range; direct electron-temperature metallicities from the [OIII]4363 auroral line; a strong-line photoionisation grid; and spaxel-by-spaxel SED-derived star-formation histories. The load-bearing observable is the spatial offset between line-emission and stellar-continuum centroids, combined with co-spatial maps of metallicity, velocity dispersion, and burstiness that tie the turbulent metal-poor gas to the local starburst.
Load-bearing premise
The ~0.1 arcsec offset between the H-gamma line-emission centroid and the stellar continuum centroid is a real displacement and not a NIRSpec/IFU calibration artifact; the PSF FWHM is 0.22 arcsec, the astrometric re-alignment is a 0.19 arcsec correction, and slice-geometry systematics can create spurious velocity patterns.
What would settle it
Re-observing MACS0647-JD1 at a position angle rotated by 90 degrees, or with an independent astrometric calibration, would settle the question: if the H-gamma centroid offset and the apparent velocity gradient vanish or shrink below ~0.02 arcsec, the merger-driven starburst interpretation collapses. Alternatively, a deep ALMA/NOEMA detection of cold gas showing ordered rotation rather than disturbed kinematics would argue for a disc.
If this is right
- Early galaxies at z>10 can be spatially resolved with JWST IFU, revealing that their ISM is not uniformly enriched but contains metal-poor gas pockets that track recent star formation.
- A metallicity contrast of 0.4 dex over ~300 pc is hard to produce by in-situ clump formation in a single disc, favouring mergers or external gas accretion as the trigger of early starbursts.
- The co-spatiality of high velocity dispersion, low metallicity, and high burstiness suggests that turbulence in the early ISM is powered by gravitational interactions and inflows rather than only by stellar feedback.
- Recovering H-beta beyond the nominal NIRSpec G395M range is feasible and yields flux-calibration uncertainties below ~15%, extending the usable wavelength coverage for z>10 spectroscopy.
- If the merger interpretation holds, MACS0647-JD1 offers a local-scale laboratory for the feedback-inflow cycle thought to regulate bursty star formation before Cosmic Noon.
Where Pith is reading between the lines
- The method of using emission-line-to-continuum centroid offsets as a merger/starburst diagnostic could be applied to other JWST IFU targets; the real test will be whether re-observations at a rotated position angle reproduce the same offset.
- The apparent anti-correlation between FWHM and the O3Hg line ratio, if confirmed at lower redshift, implies that high-dispersion spaxels are preferentially ionised by harder radiation fields — a selection effect that could bias integrated metallicity measurements in turbulent galaxies.
- A direct extension of this work is to measure the cold gas content of the same system; if the rough gas-mass estimate (log M_gas/M_sun ~ 8.2) is confirmed, the system is gas-dominated, meaning the next starburst could be even stronger once the inflowing gas reaches the clumps.
- The tentative AGN-like signatures in the south-west region, which the authors disfavour, could be tested by deeper auroral-line or X-ray observations; if AGN contribution is present, the strong-line metallicities in that region would be biased.
Editorial analysis
A structured set of objections, weighed in public.
Referee Report
Summary. This paper presents NIRSpec/IFU G395M observations of the gravitationally lensed z=10.17 system MACS0647-JD1. The authors perform spaxel-by-spaxel and aperture-averaged emission-line fitting, recover H-beta beyond the nominal G395M wavelength range, derive direct-Te and strong-line gas-phase metallicities, and fit SEDs with prospector to map stellar mass and star-formation burstiness. They report two stellar components with different metallicities (SE clump 12+log(O/H)=7.89±0.11; NW clump 7.47±0.14, direct method), a ~0.1 arcsec (150 pc) offset between the H-gamma emission centroid and the F444W stellar continuum centroid, and spatially correlated turbulent, metal-poor gas in the north-east region. They interpret these as evidence for a merger-driven starburst with infalling low-metallicity gas. The paper includes extensive cross-checks: direct and strong-line abundances agree, H-beta-based and H-gamma-based abundances agree, the MIRI-based H-beta flux is consistent, and bootstrap resampling retains only the FWHM-O3Hg anti-correlation.
Significance. The work is potentially important: it is the first spatially resolved ISM study at z>10, provides the highest-redshift NIRSpec direct-Te metallicity, and demonstrates a technically challenging H-beta recovery beyond the nominal grating range. The internal consistency checks are a strength, and the paper is generally careful in acknowledging systematics (e.g., Appendix C). However, the central physical narrative—a merger-driven starburst between two clumps—rests heavily on the 0.1 arcsec line/continuum centroid offset, which is sub-PSF and comparable to known NIRSpec/IFU calibration uncertainties. The velocity-field evidence is explicitly inconclusive. If the offset is not real, the merger interpretation loses its strongest spatial argument, although the metallicity asymmetry and burstiness maps remain interesting. The manuscript merits major revision to either robustly establish the offset or soften the causal claims.
major comments (3)
- [Section 2.4 / 5.1.1 / Appendix A] The claim that the H-gamma (and [NeIII]) emission centroid is offset by ~0.1'' from the stellar continuum centroid is load-bearing for the merger-driven starburst interpretation (Section 5.1.1; first bullet of Section 6). The offset is two 0.05'' spaxels, while the PSF FWHM is 0.22'' and the astrometric re-alignment itself is 0.19''. Appendix A reports that ~1-spaxel centroid shifts between emission-line maps are expected from filter transmission and NIRSpec/IFU calibration imperfections and dismisses them as 'not worrying'; it does not demonstrate that a 2-spaxel shift is above the systematic floor for an extended source. The cited Beck (2025) 0.02'' residual applies to point sources, and Appendix C shows that slice-geometry systematics can create spurious spatial/kinematic patterns. To support the offset, the authors should quantify the systematic centroid uncertainty for this specific
- [Section 5.1.5 / Appendix C] The kinematic evidence does not discriminate between a merger and a rotating disc. The paper states in Appendix C that it is 'not able to fully rule out the hypothesis that this kinematic pattern might be real', and that a rotating disc is a possible interpretation. The slit-width model reproduces a substantial fraction (44 vs 114 km/s, 5th-95th percentile) of the observed gradient, and Beck (2025) reports artificial shifts of ~1.6 spectral pixels for G395M, similar to the observed gradient. Therefore the merger conclusion cannot rest on kinematics; it rests on the centroid offset and the metallicity contrast. If the offset is confirmed, the merger story is supported, but as written the discussion in Section 5.1.5 overstates the case.
- [Section 5.1.4 / Fig. 13] The burstiness map SFR_Hgamma/SFR100 is based on the same H-gamma line fluxes used to define the line centroid. If the line centroid is biased by the systematic offset discussed in Major Comment 1, the NE burstiness enhancement could be partly a spatial artifact. The SFR10/SFR100 map is a more independent tracer, but it is derived from prospector fits with a flexible non-parametric SFH and may suffer from degeneracies. The authors should show that the NE enhancement persists when the line-flux map is re-centered on the continuum centroid, or when only continuum-derived SFR10 is used. This is necessary to support the conclusion that the starburst is genuinely located in the metal-poor, turbulent region between the clumps.
minor comments (6)
- [Figure D2 caption] The panel labelled 'Spectro-photometric fit for the SE clump' in Figure D2 actually shows the NW clump results; the caption should be corrected.
- [Section 3.2] The noise re-scaling factor is a free parameter. Please state explicitly whether the reported uncertainties include this re-scaling in the final covariance, and whether the re-scaling is applied consistently to spaxel and aperture spectra.
- [Eq. (5)] Define the units of L_Hgamma explicitly (erg/s) and clarify the origin of the -40.5 constant and the -0.3 dex correction (Kennicutt & Evans 2012 with the Reddy et al. 2022 / Shapley et al. 2023 adjustment). Without these details the reader cannot reproduce the SFR scale.
- [Section 4.3] For the four spaxels with below-case-B Balmer ratios, setting A_V,cont = 0 is an ad hoc assumption. The paper acknowledges this, but a systematic uncertainty or a prior-based marginalization would better reflect the resulting metallicity uncertainty.
- [Abstract / Section 5.1.1] The phrase 'co-spatial starburst' is ambiguous: the starburst region (NE) is spatially offset from the two stellar components. Please define what is meant by 'co-spatial' (presumably co-spatial with the turbulent metal-poor gas, not with the stellar continuum).
- [Section 2.2] The sentence on background subtraction using 'H-gamma and [NeIII] 3869 to obtain the source mask' is unclear. Specify how these lines define the mask and whether continuum-only regions were used for background estimation.
Circularity Check
No significant circularity; the metallicity, stellar-population, and line-offset results rest on external calibrations and direct observations rather than on fitted inputs or self-citation.
full rationale
I walked the paper's derivation chain. Gas-phase metallicities are obtained from observed line ratios through external calibrations (Witstok et al. 2021; Gutkin et al. 2016) that are not fitted to this target, and the [OIII]5007 flux inferred from the Witstok relation is checked against the MIRI measurement of Hsiao et al. (2024b), so the agreement between the direct and strong-line methods is not purely by construction. Stellar masses and star-formation histories come from Prospector SED fits with stated priors, independent of the gas metallicity fits. The H-gamma/F444W centroid offset is an observational measurement; the merger/starburst narrative is an interpretation drawn from that offset plus the spatially resolved metallicity, FWHM, and burstiness maps, not a fitted parameter renamed as a prediction. Self-citations are to instrument-calibration and reduction methodology (PSF size, outlier rejection, slit-width effects) and are not load-bearing for the astrophysical conclusion in a circular way. The paper itself flags calibration limitations: Appendix A notes ~1-spaxel wavelength-dependent centroid drift 'caused by a combination of filter transmission effects and imperfect NIRSpec/IFU calibrations,' and Appendix C shows that slit-geometry systematics can produce artificial rotation patterns. These are acknowledged robustness concerns that could weaken the offset-based interpretation, but they do not make any derivation reduce to its own input. No equation is shown to be equivalent to the input by construction, and no fitted quantity is presented as a prediction. The only notable shared assumption is that both metallicity methods use the same Witstok et al. (2021) [OIII]5007 extrapolation; however, this is an external calibration with an external MIRI check, not a circular step.
Axiom & Free-Parameter Ledger
free parameters (5)
- Per-spaxel noise rescaling factor =
1.9–2.5
- Prospector SED model parameters (log M*, SFR10, SFR100, Z*, tau2, tau1/tau2, ndust, Zgas, log U) =
SE clump: log M*=7.77+/-0.09, log SFR10=0.04+/-0.07, log SFR100=0.26+/-0.09; NW clump: log M*=7.41+/-0.07, log SFR10=-0.
- A_V,cont = 0 for below-case-B Balmer spaxels =
0 mag (hand-set)
- NIRSpec LSF pre-launch FWHM x 0.8 correction factor =
0.8
- H-delta / H-zeta Gaussian prior =
2.46 +/- 0.3
axioms (8)
- standard math Flat LambdaCDM cosmology with H0=67.4 km/s/Mpc and Omega_m=0.315
- domain assumption Lensing magnification mu=8+/-1 for MACS0647-JD1
- domain assumption Witstok et al. (2021) Eq. (3) relation between [OIII]5007/[OII] and [NeIII]/[OII] holds at z=10.17
- domain assumption Case-B recombination ratios apply (H-beta/H-gamma=2.105, H-alpha/H-gamma=5.79, H-delta/H-zeta=2.46)
- domain assumption NIRSpec/IFU PSF is circular Gaussian with stpsf FWHM and residual astrometric/centroid systematics below 0.02 arcsec
- domain assumption Oxygen exists only as O+ and O++; O3+ is negligible, so direct-Te abundances via PyNeb are valid
- domain assumption Star formation dominates the photoionization, with AGN and shocks disfavored
- domain assumption Gutkin et al. (2016) photoionization grid with C/O=0.72(C/O)_sun, xi_d=0.1, n_H=10^3 cm^-3, and 100 Msun IMF cutoff is appropriate for this system
Cite this review
Pith. "Pith review of GA-NIFS: Dissecting The Alchemised: JWST reveals turbulent metal-poor gas fuelling a co-spatial starburst in a complex system at $z=10.17$." pith.science (2026). https://pith.science/paper/DQ2PQWUB
@misc{pith2026260300232,
  author       = {Pith},
  title        = {Pith review of: GA-NIFS: Dissecting The Alchemised: JWST reveals turbulent metal-poor gas fuelling a co-spatial starburst in a complex system at $z=10.17$},
  year         = {2026},
  howpublished = {\url{https://pith.science/paper/DQ2PQWUB}},
  note         = {Machine review of arXiv:2603.00232}
}
read the original abstract
Recent observations revealed that distant galaxies have bursty star formation histories, regulated by stellar or active galactic nuclei (AGN) feedback and gas inflows. According to theoretical models, feedback preferentially removes metal-rich gas, while subsequent starbursts are triggered by mergers and newly accreted gas that is generally less enriched than the galaxy's interstellar medium (ISM). Therefore, gas-phase metallicity provides key insights into the baryonic processes shaping early galaxies. We present the first NIRSpec/IFU study of spatially resolved ISM properties in the MACS0647-JD system ($z=10.17$). The system consists of two stellar components detected in NIRSpec/IFU and NIRCam photometry. The main component ($\log \left(M_{\ast}/M_{\odot}\right)=7.77 \pm0.09$; $12+\log\left(\rm O/H\right)=7.89 \pm 0.16$) is more massive and significantly more metal-rich compared to its companion ($\log \left(M_{\ast}/M_{\odot}\right)=7.42\pm0.07$; $12+\log\left(\rm O/H\right)=7.47 \pm 0.20$), suggesting an older stellar population and a prolonged chemical enrichment history. We find that the H$\gamma$ line emission centroid is spatially offset by $\sim 0.1^{\prime \prime}$ (150 pc in the source plane) from the stellar continuum centroid; the latter coincides with the location of the main stellar component. This offset provides possible evidence of a merger-driven starburst in this system. By comparing the spatial distributions of the metallicity, velocity dispersion, and the burstiness of star formation history, we infer the presence of turbulent, metal-poor gas outside the stellar components. %detected in both NIRSpec/IFU and NIRCam photometry. This metal-poor, dynamically unstable gas is likely responsible for the enhanced recent star formation in the north-east region of the system.
Figures


Forward citations
Cited by 3 Pith papers
-
JADES: the mass-metallicity relation at $z=1-10$. New calibrations, extremely metal-poor galaxies, and chemical diversity
New stack-based strong-line calibrations from ~1500 spectra yield mass-metallicity relations at z=1-10 with decreasing metallicity toward higher redshift and no slope change, plus 50 EMPG candidates at 1-4% solar meta...
-
JWST Advanced Deep Extragalactic Survey (JADES) Data Release 5: stellar population catalogue for galaxies in GOODS-N and GOODS-S
JADES DR5 delivers a public catalog of Bayesian-inferred stellar masses, SFRs, SFHs, dust, metallicities, and AGN contributions for ~500k galaxies via Prospector with an evolving SFMS prior.
-
Unveiling the Cosmic Dawn with SHARP: Probing extended Lyman-$\alpha$ nebulae in a Universe less than 600 Myr old
SHARP on ELT will enable the first mapping of z>9 Lyα nebulae at scales from 150 pc to 100 kpc.
Reference graph
Works this paper leans on
-
[1]
Abdurro’uf et al., 2024, ApJ, 973, 47 Agertz O., et al., 2020, MNRAS, 491, 1656 Alarie A., Morisset C., 2019, Rev. Mex. Astron. Astrofis., 55, 377 Allen M. G., Groves B. A., Dopita M. A., Sutherland R. S., Kewley L. J., 2008, ApJS, 178, 20 Álvarez-Márquez J., et al., 2025, A&A, 695, A250 Arellano-Córdova K. Z., et al., 2022, ApJ, 940, L23 Arribas S., et a...
arXiv 2024
-
[4]
We also indicate the position angle of the aperture of these observations, PA=38.83 ◦, i.e
Figure C2.This figure shows the spatially resolvedΔ𝑣(the velocity field) map derived from single-Gaussian component spaxel-by-spaxel spectral fits (Fig.C2a).WeonlyshowthespaxelswithasoliddetectionofH𝛾(S/N>5). We also indicate the position angle of the aperture of these observations, PA=38.83 ◦, i.e. the direction of the NIRSpec/IFU slices. The velocity gr...
2025
-
[2020]
In particular, Isobe et al
and, more recently, in high spectral resolu- tion IFU studies of high-redshift galaxies. In particular, Isobe et al. (2023a) demonstrated that a differential effective slit width across theIFUslicescanintroducespuriousvelocitygradientsalignedwith the instrumental geometry, thereby mimicking ordered rotation in emission-line velocity fields. While the geom...
2016
-
[2024]
We can remark that, in contrast to the results based on the diagnosticO3Hg−Ne3O2(from Fig
are illustrated: O3Hg-O32(top panels)and O3Hg-O33(bottom panels). We can remark that, in contrast to the results based on the diagnosticO3Hg−Ne3O2(from Fig. 6, showing the presence of a south-southwest AGN-dominated region), if we use eitherO3Hg−O32orO3Hg−O33diagnostics, we would observe that all regions of the MACS0647-JD1 system are either dominated by ...
2026
discussion (0)
Sign in with ORCID, Apple, or X to comment. Anyone can read and Pith papers without signing in.