REVIEW 4 major objections 6 minor 13 references
Quantifying surfactant adsorption at fluid interfaces by combining X-ray reflectivity and simulations
T0 review · 4 major / 6 minor · reviewed 2026-08-03 · deepseek-v4-flash
Pith's one-line read Simulation-assisted X-ray reflectivity can extract surfactant adsorption isotherms for label-free non-ionic surfactants.
desk verdict The paper extends a proven MD-plus-XRR workflow to soluble, label-free non-ionic surfactants and produces new Gamma(c) data, but the central reliability claim is stronger than the validation supports—the surface-tension check is partly circular and there is no independent Gamma benchmark. read the letter →
The pith
A machine-rendered reading of the paper's core claim, the machinery that carries it, and where it could break.
The reading
What carries the argument
The carrying element is the electron density profile ρe(z) of the surfactant monolayer, obtained from molecular dynamics simulations at fixed Γ. This profile is converted into a theoretical X-ray reflectivity curve by a phase-correct summation of Fresnel reflections, optionally convolved with a Gaussian roughness of width σ. A fit-quality function measuring the log-space deviation between theoretical and experimental reflectivity (or GIXOS) curves is scanned over Γ and σ to locate the coverage matching each experimental bulk concentration. A second ingredient is the equation of state γ(Γ), computed from the pressure tensor in the same simulations, which lets the authors convert the adsorptio
What would settle it
An independent neutron reflectometry measurement on deuterated C12EO6 and β-C12G2 at the same bulk concentrations (for example c = 10 µM for C12EO6, where the method returns about 2.0 molecules per square nanometer) would settle the matter: if the neutron-derived surface excess differs from the simulation-matched Γ by more than the stated error bars, the simulated electron density profiles are biased and the central claim fails.
Extended reading notes
Core claim
The central claim is that Γ(c) can be extracted reliably from XRR and GIXOS data when the structural interpretation is supplied by molecular dynamics simulations. Simulations impose a desired Γ by placing a fixed number of surfactant molecules at a simulated air/water interface; because exchange with bulk water is slow on the simulation timescale, Γ stays fixed over hundreds of nanoseconds. From the simulated electron density profiles, the authors compute theoretical reflectivity curves and scan Γ together with a roughness parameter σ to find the best match to experimental curves at each bulk concentration c. This yields monotonically increasing adsorption isotherms for both surfactants, wit
Load-bearing premise
The load-bearing premise is that the computer model of surfactant and water, run for a few hundred nanoseconds with a fixed number of molecules at the interface, produces the same electron density profile as the real equilibrated monolayer at the same coverage; if the model misrepresents molecular volumes, conformations, or hydration, every extracted Γ is shifted by that bias.
Editorial extensions
If this is right
- Adsorption isotherms for label-free non-ionic surfactants become measurable with a conventional laboratory X-ray reflectometer, removing the need for neutron or synchrotron facilities in routine work.
- Because the simulated electron density profiles already contain molecular volumes, conformations, and hydration, Γ is obtained without the ambiguous subtraction of displaced-water electron density that complicates slab-model fits.
- The method creates a direct bridge between tensiometry and simulation: once Γ(c) is known, the simulated equation of state can be tested against measured surface tensions, turning XRR into a force-field validation tool.
- The successful transfer to GIXOS means the same analysis can be applied where faster or time-resolved measurements are needed, including synchrotron-based studies.
- For surfactants with strong in-plane cohesion, the simulated equation of state can display negative surface pressures, flagging possible gas–condensed coexistence that would appear as a kink or jump in the surface-tension isotherm.
Reading between the lines
- The matching procedure should transfer to oil–water interfaces and to mixed surfactant systems, because it relies only on simulated electron density profiles at chosen coverages; testing that would broaden the method beyond air–water surfaces.
- The finite roughness needed to fit β-C12G2 GIXOS data at higher coverages is left unexplained by the paper; if it reflects real nanoscale lateral heterogeneity rather than a capillary-wave cutoff, it could become a probe of monolayer structure, and neutron reflectometry would help decide.
- The agreement between reconstructed and measured surface-tension isotherms suggests a practical force-field benchmarking workflow: measure XRR and tensiometry on the same surfactant and tune interaction parameters until both isotherms match simultaneously.
- If a surfactant undergoes a genuine gas–condensed phase transition, Γ(c) should jump discontinuously at coexistence; the method's concentration resolution could be focused on that region to look for the jump, which tensiometry alone cannot identify unambiguously.
Signed reviews
Editorial analysis
A structured set of objections, weighed in public.
Referee Report
Summary. The paper proposes a simulation-assisted route to determine the adsorption isotherm Γ(c) of non-ionic surfactants at air/water interfaces from X-ray reflectivity (XRR) or GIXOS data. For each surfactant, atomistic MD simulations with prescribed surface coverages Γ are used to generate electron-density profiles, from which theoretical reflectivity/GIXOS curves are computed and compared with experimental curves; the best-matching Γ at each bulk concentration c defines the isotherm. The method is demonstrated for C12EO6 using laboratory XRR and for β-C12G2 using synchrotron GIXOS with complementary XRR. The authors further combine the inferred Γ(c) with the simulated equation of state γ(Γ) to reconstruct γ(c), which for C12EO6 agrees with tensiometric measurements when plotted in reduced units γ/γ0.
Significance. If the method is valid, it would fill a practical gap: neutron reflectometry—the current gold standard for Γ determination of non-ionic surfactants—requires deuteration and large-scale facilities, whereas the proposed approach uses laboratory XRR plus MD, and the paper supplies simulation run files in the Supporting Information. The systematic heat-map comparisons and the use of two chemically different surfactants and two X-ray techniques are strengths, as is the encouraging reproduction of the C12EO6 surface-tension isotherm. However, the central claim that Γ is extracted 'reliably' is currently supported mainly by self-consistency between MD-generated templates and MD-generated surface tensions, not by an independent experimental benchmark of Γ. The absolute values also sit above earlier estimates, and the uncertainty treatment does not include force-field error. The manuscript is a promising methods contribution, but the validation falls short of the strength of the headline claim.
major comments (4)
- [Results and discussion, C12EO6; Fig. 8B] The main external validation is the reconstruction of γ(c) from Γ(c) and the simulated EoS γ(Γ). This is not an independent test of Γ: the same force field generates both the electron-density templates used to infer Γ and the EoS used to convert Γ to γ, and the comparison is made in reduced units γ/γ0, so force-field errors in the absolute tension and in molecular packing can partially cancel. The paper itself states (p. 11) that the EoS is more force-field-sensitive than the electron-density profiles. To support the claim that Γ is extracted reliably, an independent benchmark is required—e.g., neutron reflectometry on a deuterated surfactant at one or two concentrations, or a force-field sensitivity study—rather than self-consistency between two MD-derived quantities.
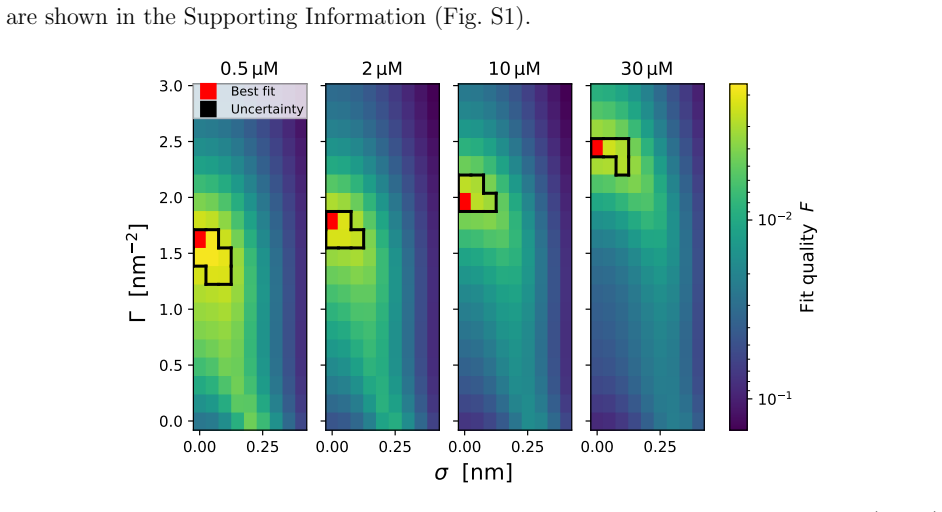
- [Results and discussion, C12EO6; Fig. 7 and p. 10] The extracted Γ(30 µM) ≈ 2.4 nm⁻² (0.42 nm² per molecule) lies above the maximal coverages 1.6–2.0 nm⁻² from thermodynamic model fits (refs 36–38) and above the earlier 0.50 nm² estimate (ref 29). The authors attribute this to limitations of the thermodynamic models, but without an independent Γ measurement the discrepancy is equally consistent with a systematic bias in the MD-template mapping (molecular volume, hydration, conformation, or in-plane order). Please quantify how force-field uncertainties propagate into Γ, or benchmark against an experimental method that does not use the same MD profiles. Also clarify whether the reported 2.4 nm⁻² value corresponds to an actually simulated coverage or to interpolation between the discrete simulated Γ grid; the Methods currently do not state this.
- [Results and discussion, β-C12G2; Figs. 9–10] The second surfactant does not provide an independent validation. The GIXOS/XRR comparison uses the same MD-derived density profiles for both techniques, so agreement mainly shows that the two experiments probe the same interface, not that the MD profile is correct. The unexplained discrepancy at c = 1 µM is acknowledged but not resolved. Moreover, no γ(c) check is presented for β-C12G2, and the simulated EoS is non-monotonic with a metastable 'hump', so a macroscopic comparison would require an ad hoc coexistence construction. The claim of general applicability would be much stronger with at least one β-C12G2 tensiometric validation or an independent benchmark.
- [Methods, Fitting procedure and fit quality assessment] The uncertainty regions are defined by an arbitrary factor 1.3 increase in F (Eqs. 7 and 8). This may be a reasonable heuristic, but it does not include the dominant model error—the force-field dependence of the electron-density templates—and therefore the error bars in Figs. 7 and 10 do not represent the actual uncertainty in Γ. The adsorption isotherm described as 'very reliable' should either be reworded to 'precise under the adopted force field' or supplemented by an estimate of force-field-induced uncertainty, e.g., by repeating the mapping with an alternative force field or by an independent structural benchmark.
minor comments (6)
- [Abstract] Typographical error: 'β-C12G2}' contains an extra closing brace. Please also check the title for consistency between 'X-ray reflection' and 'X-ray reflectivity'.
- [Fig. 8B] No error bars are shown on the reconstructed γ(c) curve, although Γ(c) has quoted uncertainties. Propagating the Γ uncertainty through the EoS would clarify how much of the agreement with tensiometry is significant.
- [Supporting Information, Fig. S5] The caption states 'theoretical GIXOS curves' but the panels show XRR fit-quality heat maps. Please correct the caption.
- [Eq. 7] The fit quality uses log(R q_z^4), but R q_z^4 carries units of nm⁻⁴. Please specify that a dimensionless normalization is used; otherwise the logarithm is formally undefined without stated units.
- [Results and discussion, C12EO6, p. 10] The statement that molecular volumes and conformational flexibility are 'generally well captured by all force fields' is asserted without a citation or quantitative support. Please provide a reference or temper the statement.
- [Conclusion] The phrase 'determine Γ(c) accurately' is stronger than the evidence presented. Recommend 'determine Γ(c) within the adopted force-field framework' until an independent benchmark is added.
Circularity Check
No circular derivation: Γ(c) is obtained by forward-model matching of MD templates against experimental XRR/GIXOS, and the γ(c) check uses an independent tensiometric dataset.
full rationale
The derivation chain is not circular. The paper's own description is a forward-model matching procedure: "we use atomistic molecular dynamics simulations of surfactant-loaded air/water interfaces with prespecified Γ to obtain interfacial electron density profiles. From these profiles, we then compute theoretical X-ray reflectivity curves, which we compare with experimental measurements to find the matching c." Each experimental XRR/GIXOS curve is measured at a known bulk concentration c; Γ is a pre-assigned label of the MD simulation, and the fit adjusts only the scale, background, and angular offset (s, Ibg, Δqz) together with a scanned roughness parameter σ. Thus Γ is not fitted from the XRR data in a way that defines it as the output of its own fit; it is the label of the MD template that best reproduces an independent experimental observable. The reconstructed γ(c) is formed by composing the inferred Γ(c) with the simulated equation of state γ(Γ) and is then compared with measured tensiometry from the present work and from Angarska et al. This comparison is a genuine external check, not an equality forced by construction; the fact that both legs of the composition come from the same force field makes it a combined consistency test rather than a standalone Γ benchmark. The paper itself flags the main limitations: the extracted C12EO6 coverage at 30 µM (≈2.4 nm−2) lies above earlier thermodynamic-model estimates (1.6–2.0 nm−2), the low-concentration β-C12G2 GIXOS/XRR points disagree "where we currently have no explanation for the discrepancy", and the β-C12G2 equation-of-state hump leaves the reality of a gas/condensed coexistence open. These are accuracy and force-field-fidelity concerns, not circular steps. Self-citations (e.g., refs 28, 32, 33) appear for methods or secondary physical statements; the force-field and reflectivity formalisms are cited to external bodies of work (GROMOS force fields, Parratt recursion, Vineyard approximation). No equation in the paper reduces a prediction to its own input by construction.
Assumptions & free parameters
free parameters (4)
- Surface coverage Gamma (fit target) =
C12EO6: ~1.1, 2.0, 2.4 nm^-2 at 2, 10, 30 uM; beta-C12G2: rising to ~2.0 nm^-2 near CMC
- Roughening width sigma =
0 for C12EO6 XRR; <=0.2 nm for beta-C12G2 GIXOS
- Per-curve nuisance parameters s, I_bg, Delta_q_z =
Per experimental curve
- Uncertainty threshold factor =
1.3
assumptions (4)
- domain assumption The GROMOS 2016H66 / 53a6 force fields and SPC/E water model faithfully represent molecular volumes, conformations, hydration, and lateral ordering of C12EO6 and beta-C12G2 monolayers.
- domain assumption An interface with surfactant number fixed at a chosen Gamma in a 300 ns NVT simulation represents the equilibrated experimental interface at the same Gamma; bulk exchange is negligible on simulation timescales.
- standard math The one-dimensional electron density profile plus Gaussian roughness fully determines the measured XRR/GIXOS response; Parratt recursion and the Vineyard approximation apply.
- domain assumption SPC/E's bare-water tension deficit (gamma0 = 60 vs 72 mN/m) can be corrected by comparing reduced tension gamma/gamma0.
Cite this review
Pith. "Pith review of Quantifying surfactant adsorption at fluid interfaces by combining X-ray reflectivity and simulations." pith.science (2026). https://pith.science/paper/DT6PTEKK
@misc{pith2026251123248,
  author       = {Pith},
  title        = {Pith review of: Quantifying surfactant adsorption at fluid interfaces by combining X-ray reflectivity and simulations},
  year         = {2026},
  howpublished = {\url{https://pith.science/paper/DT6PTEKK}},
  note         = {Machine review of arXiv:2511.23248}
}
abstract
Adsorption of surfactants to fluid interfaces occurs in numerous daily-life and technological contexts. The surfactant surface coverage $\Gamma$ governs interface characteristics like tension $\gamma$, viscoelastic properties, and the stability of thin foam films. Directly measuring $\Gamma$ as a function of the bulk concentration $c$ is highly desirable but challenging, particularly for non-ionic surfactants that lack easily detectable labels. Neutron reflectometry is currently the only generally applicable method, but it is not available for routine experiments. Here, we propose a simulation-assisted approach to deduce the adsorption isotherm $\Gamma(c)$ from X-ray reflectivity data: As a first step, we use atomistic molecular dynamics simulations of surfactant-loaded air/water interfaces with prespecified $\Gamma$ to obtain interfacial electron density profiles. From these profiles, we compute theoretical X-ray reflectivity curves and compare them with experimental measurements to determine the matching bulk concentration. We focus on two non-ionic surfactants (C$_{12}$EO$_6$ and $\beta$-C$_{12}$G$_2$}) with previously established force fields to illustrate how this combined approach of experiments and simulations can determine the adsorption isotherm. Additional insights are gained through comparison with the measured surface tension isotherms $\gamma(c)$, based on the equation of state $\gamma(\Gamma)$ from simulations.
Figures


Figures from the paper (7 more)




Reference graph
Works this paper leans on
-
[1]
Stability of foam films and su rface rheology: an oscillating bubble study at low frequencies
(1) Stubenrauch, C.; Miller, R. Stability of foam films and su rface rheology: an oscillating bubble study at low frequencies. The Journal of Physical Chemistry B 2004, 108, 6412–6421. 21 (2) Georgieva, D.; Cagna, A.; Langevin, D. Link between surfa ce elasticity and foam sta- bility. Soft Matter 2009, 5, 2063–2071. (3) Langevin, D. Recent Advances on Emul...
2004
-
[2]
Soft Matter 2008, 4, 840–848
with cationic and non-ionic surfactants: micelle a nd surface compositions. Soft Matter 2008, 4, 840–848. (30) Rosen, M. J.; Kunjappu, J. T. Surfactants and interfacial phenomena ; John Wiley & Sons,
2008
-
[114]
M.; Zhang, Z.; Williams, S
(35) Mitrinovic, D. M.; Zhang, Z.; Williams, S. M.; Huang, Z.; S chlossman, M. L. X-ray reflectivity study of the water- hexane interface. The Journal of Physical Chemistry B 1999, 103, 1779–1782. 25 (36) Eastoe, J.; Dalton, J. S.; Rogueda, P. G.; Crooks, E. R.; Pi tt, A. R.; Simister, E. A. Dynamic Surface Tensions of Nonionic Surfactant Solutions. Journa...
1999
-
[359]
R.; Robinson, D
(56) Bevington, P. R.; Robinson, D. K.; Blair, J. M.; Mallinck rodt, A. J.; McKay, S. Data reduction and error analysis for the physical sciences. Computers in Physics 1993, 7, 415–416. (57) Rodriguez-Loureiro, I.; Scoppola, E.; Bertinetti, L. ; Barbetta, A.; Fragneto, G.; Sch- neck, E. Neutron reflectometry yields distance-dependent st ructures of nanomet...
1993
-
[443]
Intersurfact ant H-bonds between head groups of n-dodecyl- β-d-maltoside at the air-water interface
24 (28) Kanduˇ c, M.; Schneck, E.; Stubenrauch, C. Intersurfact ant H-bonds between head groups of n-dodecyl- β-d-maltoside at the air-water interface. Journal of colloid and interface science 2021, 586, 588–595. (29) Patil, S. R.; Buchavzov, N.; Carey, E.; Stubenrauch, C. B inary mixtures of β- dodecylmaltoside ( β-C 12 G
2021
-
[694]
Thermodyn amic and structural properties of phospholipid Langmuir monolayers on hydrosol surfaces
(21) Wiegart, L.; Struth, B.; Tolan, M.; Terech, P. Thermodyn amic and structural properties of phospholipid Langmuir monolayers on hydrosol surfaces. Langmuir 2005, 21, 7349–
2005
-
[770]
X-ray surfac e scattering investigation of 23 Langmuir films: Phase transitions and elastic properties
(20) Mora, S.; Daillant, J.; Luzet, D.; Struth, B. X-ray surfac e scattering investigation of 23 Langmuir films: Phase transitions and elastic properties. EPL (Europhysics Letters) 2004, 66,
2004
-
[1039]
X-ray near total external fluorescence me thod: Experiment and analysis
(16) Yun, W.; Bloch, J. X-ray near total external fluorescence me thod: Experiment and analysis. Journal of applied physics 1990, 68, 1421–1428. (17) Daillant, J.; Bosio, L.; Benattar, J.; Blot, C. Interacti on of cations with a fatty acid monolayer. A grazing incidence x-ray fluorescence and reflec tivity study. Langmuir 1991, 7, 611–614. (18) Als-Nielsen, ...
1990
Show all 13 references
-
[1676]
J.; Grigera, J
(48) Berendsen, H. J.; Grigera, J. R.; Straatsma, T. P. The missi ng term in effective pair potentials. Journal of Physical Chemistry 1987, 91, 6269–6271. (49) Supporting Information: GROMACS simulation files. https://doi.org/10.48328/ tudatalib-2024. (50) Van Der Spoel, D.; Lin...
1987
-
[2012]
Grazing-incidence X-ray diffraction elucidates structural correlations in fluid mon olayers of lipids and surfac- tants
(31) Reed, J.; Grava, M.; Shen, C.; Brezesinski, G.; Schneck, E. Grazing-incidence X-ray diffraction elucidates structural correlations in fluid mon olayers of lipids and surfac- tants. Nanoscale 2025, 17, 3257–3269. (32) Kanduˇ c, M.; Stubenrauch, C.; Miller, R.; Schneck, E. I ...
2025
-
[2020]
Electrocapillary curve of higher aliphatic a cids and the state equation of the surface layer
(5) Frumkin, A. Electrocapillary curve of higher aliphatic a cids and the state equation of the surface layer. Z. Phys. Chem 1925, 116, 466–470. (6) Liggieri, L.; Ferrari, M.; Massa, A.; Ravera, F. Molecular reorientation in the adsorption of some CiEj at the water-air interfa...
1925
-
[4146]
A.; Merz, P
(43) Horta, B. A.; Merz, P. T.; Fuchs, P. F.; Dolenc, J.; Riniker, S .; H¨ unenberger, P. H. A GROMOS-Compatible Force Field for Small Organic Molecules in the Condensed Phase: The 2016H66 Parameter Set. Journal of Chemical Theory and Computation 2016, 12, 3825–3850. 26 (44) S...
2016
-
[7357]
Phase Transitions in Soft Condensed Matter ; Springer, 1989; pp 113–138
(22) Als-Nielsen, J.; Kjær, K. Phase Transitions in Soft Condensed Matter ; Springer, 1989; pp 113–138. (23) Kuhl, T.; Majewski, J.; Howes, P.; Kjaer, K.; Von Nahmen, A.; Lee, K.; Ocko, B.; Israelachvili, J.; Smith, G. Packing Stress Relaxation in Po lymer- Lipid Monolayers at...
1989
Reviewed August 3, 2026 · model on record in the stance chip above.
Discussion (0). Continue with ORCID to comment.