REVIEW 4 major objections 4 minor 78 references
Story Ribbons: Reimagining Storyline Visualizations with Large Language Models
T0 review · 4 major / 4 minor · reviewed 2026-08-05 · deepseek-v4-flash
Pith's one-line read An almost fully automated LLM pipeline can extract story data from raw novels and scripts well enough to power interactive storyline visualizations that match human study guides on the vast majority of key characters and events.
desk verdict Solid systems contribution; the headline accuracy numbers need stronger evidence, but the artifact and user study carry it. read the letter →
The pith
A machine-rendered reading of the paper's core claim, the machinery that carries it, and where it could break.
The reading
What carries the argument
The load-bearing mechanism is the LLM chaining pipeline, organized as decomposition (splitting the story into chapters, then into scenes defined by location change, with per-scene summaries, ratings, character and theme extraction, and quoted evidence) and aggregation (building chapter, character, and location summaries from the scene data). Two correction loops are essential: an exact-string-match check that replaces hallucinated or modified quotes with LLM explanations, and a second LLM that groups duplicate character and location names. The visualization itself adapts the ribbon storyline technique, with each character as a weighted path whose thickness encodes importance, a y-axis that c
What would settle it
Re-run the study-guide comparison on the same six works with two independent annotators who do the diff-style matching blind to the paper's results; if their agreement (e.g., Cohen's kappa on character and event matches) is below 0.6, or if a gold-standard event list shows that the pipeline's 90% event overlap does not survive an exact-match criterion, the central reliability claim is falsified.
Extended reading notes
Core claim
The paper's central claim is that an almost fully automated pipeline—LLM chaining with decomposition into chapters and scenes, aggregation into summaries, and correction loops for hallucinated quotes and duplicated names—can extract narrative data from unstructured novels, plays, and poems well enough to be genuinely useful in practice. On six well-known works, the pipeline matched 94.3% of the characters listed by one popular study guide and 83.3% of those on another, identified 90.4% and 90.1% of the same key events with 100% chronological accuracy, and was the only source to detect roughly 43% of characters and 91% of themes. A 16-participant user study found the resulting Story Ribbons t
Load-bearing premise
The reported reliability numbers rest on the authors' own qualitative matching of LLM outputs to human-written study guides, with no inter-rater reliability check or public annotation set; if that matching is looser than it looks, the claim that the pipeline is 'sufficiently reliable to be helpful' loses its quantitative footing.
Editorial extensions
If this is right
- A near-automated pipeline can produce structured story data for any novel-length text in minutes (2.2 minutes for The Great Gatsby, 3.9 for Little Women), removing the manual tagging bottleneck that limited prior storyline systems.
- Because the pipeline is genre- and target-agnostic, the same decomposition and aggregation structure can be pointed at themes, locations, or user-defined traits, enabling custom visualization dimensions without additional data preparation.
- The correction loops are portable design patterns: exact quote verification and duplicate-entity grouping are generally useful guards for any LLM-based text-extraction task.
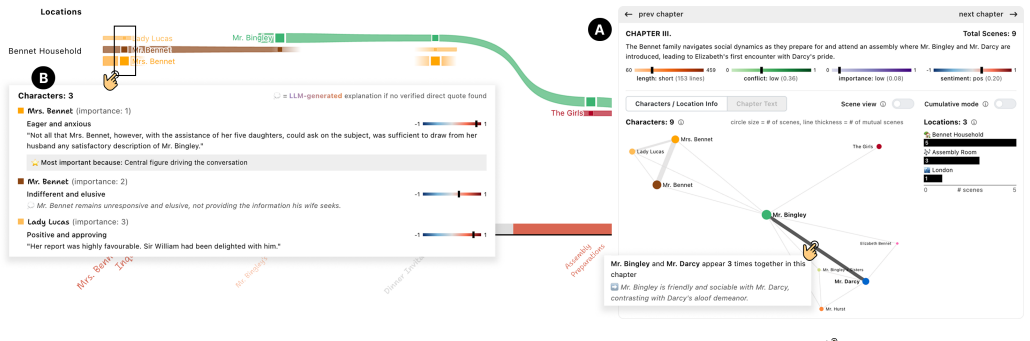
- When LLM outputs are transparent—with explanations and links to the raw text—users can treat disagreements as interpretive prompts rather than errors, as when readers noticed the model rated Mr. Bennet as initially most important in Pride and Prejudice.
- The system is best used by readers who already know the story; users explicitly said it would spoil discovery for unfamiliar texts, which constrains the tool's intended use cases.
Reading between the lines
- The unblinded, qualitative diff against human study guides is a lenient yardstick; a stricter test would be inter-annotator agreement on a gold-standard corpus, and the exact overlap figures may shift under such a test.
- The scene-definition choice (location change) is itself an interpretive commitment; the pipeline's 72.7% adherence to that definition shows LLMs impose their own genre-dependent scene semantics, which could be surfaced as a user-controllable parameter.
- The finding that LLM-only themes vastly outnumber study-guide themes (91.3% LLM-only) suggests a complementary relationship: guides curate, LLMs enumerate; a tool that merges both could offer a criticism layer beyond the text.
- Because the pipeline relies on two specific commercial LLMs (one for extraction, another for corrections), the reported reliability is tied to those models and may not transfer to open-weight alternatives.
Editorial analysis
A structured set of objections, weighed in public.
Referee Report
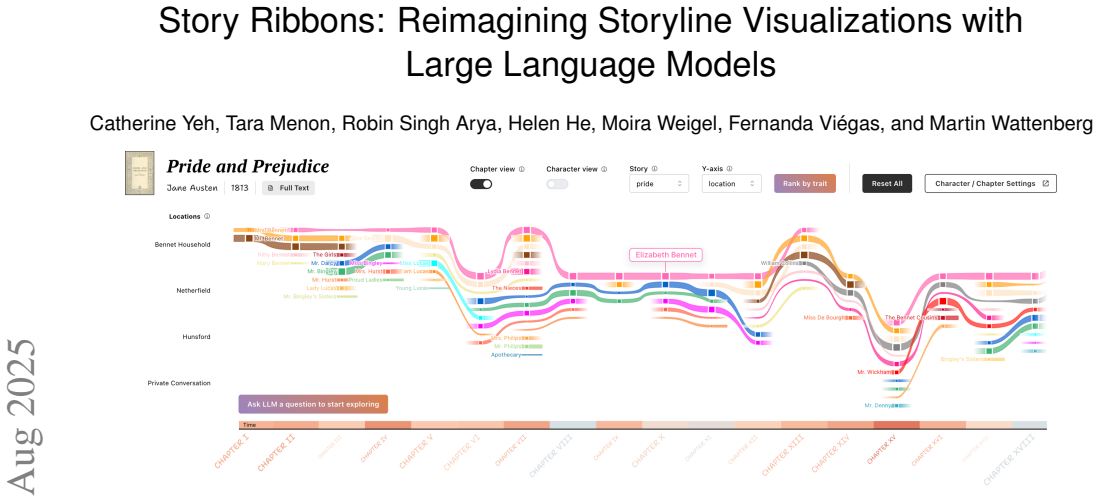
Summary. The paper introduces Story Ribbons, an interactive literary-analysis visualization system, together with an LLM-based pipeline that extracts structured narrative data (chapters, scenes, characters, locations, themes, quotes, and ratings) from novels, plays, poems, and nonfiction. The pipeline decomposes stories into chapters and scenes, applies correction loops for hallucinated quotes and duplicate entities, then aggregates the results into a JSON representation. Story Ribbons visualizes characters and themes as ribbons over time, with customizable y-axes, color encodings, explanations on demand, and natural-language query/dimension features. The authors evaluate the pipeline on 36 texts, compare extracted characters/themes/events against SparkNotes and LitCharts for six canonical works, report quote-accuracy rates, and conduct a 16-participant user study plus expert interviews. The central claim is that, despite known limitations, LLMs can meaningfully augment traditional text visualizations and that the pipeline is 'sufficiently reliable to be helpful to users.'
Significance. If the reliability claims hold, this paper makes a useful contribution to narrative visualization and LLM-supported literary analysis. Its strengths include a rare focus on the full data-extraction pipeline rather than only on layout; the explicit use of correction loops to combat hallucinated quotes and duplicate entities; the inclusion of synthetic novels as a partial control against training-data memorization; evaluation against external human-authored study guides rather than only self-generated ground truth; and transparent reporting of LLM failures in Sec. 7.3. The design process is strengthened by co-design with literary scholars, and the user study provides concrete evidence that the interactive features (explanations, custom dimensions, 'ask LLM') can support interpretation and discussion. The main quantitative support for the 'sufficiently reliable' claim, however, rests on the study-guide overlap analysis in Sec. 4.2.2, which is the paper's weakest point and needs substantial strengthening before the claim is fully established.
major comments (4)
- [Sec. 4.2.2, Study Guide Analysis] The 94.3%/83.3% character overlap and 90.4%/90.1% event overlap figures are the primary quantitative basis for the abstract and conclusion claims that the pipeline is 'sufficiently reliable to be helpful.' The method is described only as a 'diff-style comparison' in which characters and themes are 'qualitatively matched when different names likely referred to the same entity.' No matching rubric, no inter-rater reliability, and no released annotation set are provided, and the comparison is unblinded. These overlap percentages are therefore not independently checkable and may be optimistic. This is a load-bearing issue. I ask the authors to release the matching data and to report either dual independent annotation with agreement statistics or a transparent, rule-based matching procedure. In addition, the six compared texts are all canonical works likely present in LLM training data; the s
- [Sec. 4.2.3, Scene Boundary Analysis] The scene-boundary analysis labels each of the n = 3796 boundaries by 'examining the explanation provided by the LLM when starting a new scene and grouping these thematically.' This measures the LLM's stated rationale, not whether the boundary is correct. Because the LLM can rationalize an incorrect scene division, the percentages in Fig. 3B (72.7% location-related, etc.) do not validate the quality of scene segmentation; they only characterize the model's self-reported reasoning. The paper also does not report agreement between LLM scene divisions and human annotations of scene boundaries. Given that scene data is the foundation of the ribbon visualization, the authors should either reframe this analysis as an exploratory taxonomy of LLM explanations or add an independent human-annotation comparison to support the assumption that the extracted scenes are meaningful.
- [Sec. 4.2.1, Quote Accuracy] The exact-string-match quote check is a welcome objective measure, but the reported mean character-quote accuracy of 0.79 means that roughly one in five character quotes is replaced by a brief LLM explanation. The paper does not report how often this replacement occurs per story or how the displayed explanations are generated, nor does it evaluate whether the replacement explanations are faithful. Since the interface presents both quotes and explanations as evidence (e.g., Fig. 6B), the trust-calibration argument in Secs. 5.2 and 7.3.3 would be strengthened by reporting the proportion of displayed evidence items that are verbatim quotes versus generated explanations, and by assessing the correctness of the latter.
- [Sec. 4.2.1, Performance comparisons] The text states that 'there were no significant performance differences based on story length, or between well- and lesser-known texts,' but no statistical test, effect size, or confidence interval is reported. This claim is used to support the pipeline's generality. Please provide the actual test results (e.g., correlation coefficient, t-test or ANOVA output, or a nonparametric equivalent) or soften the claim to a descriptive observation.
minor comments (4)
- [Sec. 4.2.2, Results] The statements that '42.6% of total characters and 91.3% of themes were only detected by the LLM' should be interpreted carefully: study guides are curated and intentionally selective, so one-sided 'extra' detections are not necessarily a quality signal. The authors acknowledge this in part, but the presentation would benefit from a clearer distinction between coverage and precision.
- [Sec. 5.4, Implementation] The paper states that 'Our LLM prompts and example user queries are included in the supplementary materials,' but no supplementary file is visible in the submitted version. Prompts are central to reproducibility in LLM-based systems; please make them available in the final version.
- [Fig. 3 and Table 2] Figure 3A reports means and 95% CIs but does not state the number of stories in each category (e.g., plays vs. non-plays) or the statistical method behind 'no significant differences.' A small note in the caption would help.
- [Sec. 7.3.1, Context and granularity challenges] The examples of Polyphemus/Cyclops and 'Gregor's parents' are useful concrete limitations, but they also suggest that the duplicate-grouping correction loop fails in cases where entities are semantically related but not identical. A sentence connecting these user-observed failures to the quantitative limits of the correction loop would sharpen the reliability discussion.
Circularity Check
No central circularity: the reliability claim rests on external study-guide comparisons and exact string matches; only a minor self-confirming scene-boundary analysis and a non-load-bearing self-citation keep the score at 2.
-
self definitional
[Sec. 4.2.3, Fig. 3B; cf. Sec. 4.1.1 Step 2]
"defining scenes based on changes in story location felt most sensible, which we implemented in our final pipeline. ... Each boundary was labeled by examining the explanation provided by the LLM when starting a new scene and grouping these thematically. ... the most common type was location change, as expected, making up 72.7% of all scene boundaries."
The pipeline explicitly instructs the LLM to treat a change in story location as the basis for a new scene, and the evaluation then labels each boundary by reading the LLM's own explanation of why it started a new scene. Reporting that 72.7% of boundaries are location changes is therefore partly a restatement of the prompt plus the model's self-report, not an independent measure of the LLM's scene concept. The paper does acknowledge deviations (character change, focus shift, time change), and this finding is not load-bearing for the central reliability claim, so the circularity is localized and minor.
full rationale
The central derivation is self-contained. The pipeline's quantitative reliability is supported by external anchors: exact string-match quote accuracy against the raw text (Sec. 4.2.1), overlap with human-written SparkNotes/LitCharts study guides (Sec. 4.2.2), and user studies. None of these reduce by construction to fitted parameters or to self-authored results. The only self-citation found is reference [62] (Van Ham, Wattenberg, and Viégas, 'Mapping text with phrase nets'), cited in related work for exploring dependency links; it is not load-bearing. The one localized self-confirming evaluation is the scene-boundary classification in Sec. 4.2.3, where the LLM's own explanations are used as labels for a definition the pipeline itself supplied. Since that analysis does not support the central claim that the pipeline is 'sufficiently reliable to be helpful to users,' the score remains low. Concerns about unblinded qualitative matching in the study-guide comparison and possible memorization of canonical texts are validity threats, not circularity: the comparison is still made against external human-written guides, and the paper separately reports exact string-match quote accuracy and includes LLM-generated synthetic novels as a training-data control.
Assumptions & free parameters
assumptions (4)
- domain assumption Scenes in a novel are best operationalized as changes in story location.
- domain assumption A second LLM (claude-3-5-sonnet) can reliably group duplicate character/location names and character groups without independent verification.
- domain assumption LLM explanations for scene boundaries are faithful enough to classify boundary types.
- domain assumption SparkNotes and LitCharts provide a reasonable ground-truth proxy for characters, themes, and events in well-known works.
Cite this review
Pith. "Pith review of Story Ribbons: Reimagining Storyline Visualizations with Large Language Models." pith.science (2026). https://pith.science/paper/E74WJNXC
@misc{pith2026250806772,
  author       = {Pith},
  title        = {Pith review of: Story Ribbons: Reimagining Storyline Visualizations with Large Language Models},
  year         = {2026},
  howpublished = {\url{https://pith.science/paper/E74WJNXC}},
  note         = {Machine review of arXiv:2508.06772}
}
read the original abstract
Analyzing literature involves tracking interactions between characters, locations, and themes. Visualization has the potential to facilitate the mapping and analysis of these complex relationships, but capturing structured information from unstructured story data remains a challenge. As large language models (LLMs) continue to advance, we see an opportunity to use their text processing and analysis capabilities to augment and reimagine existing storyline visualization techniques. Toward this goal, we introduce an LLM-driven data parsing pipeline that automatically extracts relevant narrative information from novels and scripts. We then apply this pipeline to create Story Ribbons, an interactive visualization system that helps novice and expert literary analysts explore detailed character and theme trajectories at multiple narrative levels. Through pipeline evaluations and user studies with Story Ribbons on 36 literary works, we demonstrate the potential of LLMs to streamline narrative visualization creation and reveal new insights about familiar stories. We also describe current limitations of AI-based systems, and interaction motifs designed to address these issues.
Figures


Figures from the paper (5 more)



Reference graph
Works this paper leans on
-
[1]
S. Antol, A. Agrawal, J. Lu, M. Mitchell, D. Batra, C. L. Zitnick, and D. Parikh. Vqa: Visual question answering. In Proceedings of the IEEE international conference on computer vision, pp. 2425–2433, 2015. doi: 10.1109/ICCV.2015.279 9
-
[2]
D. Arendt and M. Pirrung. The “y” of it matters, even for storyline visualization. In 2017 IEEE Conference on Visual Analytics Science and Technology (VAST), pp. 81–91, 2017. doi: 10.1109/V AST.2017.8585487 2, 5
arXiv 2017
- [3]
-
[4]
M. S. Bernstein, G. Little, R. C. Miller, B. Hartmann, M. S. Ackerman, D. R. Karger, D. Crowell, and K. Panovich. Soylent: a word processor with a crowd inside. In Proceedings of the 23nd annual ACM symposium on User interface software and technology, pp. 313–322, 2010. doi: 10. 1145/1866029.1866078 3, 4
arXiv 2010
-
[5]
I. Burkett. An introduction to co-design. Sydney: Knode, 12:12, 2012. 2
work page 2012
-
[6]
K. E. Chu, P. Keikhosrokiani, and M. P. Asl. A topic modeling and sentiment analysis model for detection and visualization of themes in literary texts. Pertanika Journal of Science & Technology, 30(4):2535– 2561, 2022. doi: 10.47836/pjst.30.4.14 1, 3
-
[7]
J. J. Y . Chung, W. Kim, K. M. Yoo, H. Lee, E. Adar, and M. Chang. Tale- brush: Sketching stories with generative pretrained language models. In Proceedings of the 2022 CHI Conference on Human Factors in Computing Systems, pp. 1–19, 2022. doi: 10.1145/3491102.3501819 9
arXiv 2022
-
[8]
J. J. Y . Chung and M. Kreminski. Patchview: Llm-powered worldbuilding with generative dust and magnet visualization. In Proceedings of the 37th Annual ACM Symposium on User Interface Software and Technology, pp. 1–19, 2024. doi: 10.1145/3654777.3676352 9
arXiv 2024
Show all 78 references
-
[9]
Costa and S
M. Costa and S. Nunes. Newslines: Narrative visualization of news stories. In Text2Story@ ECIR, pp. 37–46, 2023. 2
2023
-
[10]
Daniel, P
F. Daniel, P. Kucherbaev, C. Cappiello, B. Benatallah, and M. Allahbakhsh. Quality control in crowdsourcing: A survey of quality attributes, assess- ment techniques, and assurance actions. ACM Computing Surveys (CSUR), 51(1):1–40, 2018. doi: 10.1145/3148148 3
2018 doi
-
[12]
Di Giacomo, W
E. Di Giacomo, W. Didimo, G. Liotta, F. Montecchiani, and A. Tap- pini. Storyline visualizations with ubiquitous actors. In International Symposium on Graph Drawing and Network Visualization, pp. 324–332. Springer, 2020. doi: 10.1007/978-3-030-68766-3_25 2
2020 doi
-
[13]
V . Dibia. Lida: A tool for automatic generation of grammar-agnostic visualizations and infographics using large language models. In Proceed- ings of the 61st Annual Meeting of the Association for Computational Linguistics (Volume 3: System Demonstrations), pp. 113–126, 2023. ...
2023 doi
-
[14]
Dobson, P
T. Dobson, P. Michura, S. Ruecker, M. Brown, and O. Rodriguez. Inter- active visualizations of plot in fiction. Visible Language, 45(3):169–191,
-
[15]
K. Elkins. The shapes of stories: sentiment analysis for narrative. Cam- bridge University Press, 2022. doi: 10.1017/9781009270403 3
2022 doi
-
[16]
Frermann, J
L. Frermann, J. Li, S. Khanehzar, and G. Mikolajczak. Conflicts, villains, resolutions: Towards models of narrative media framing. InProceedings of the 61st Annual Meeting of the Association for Computational Linguistics (Volume 1: Long Papers), pp. 8712–8732, 2023. doi: 10.18...
2023 doi
-
[17]
G. Freytag. Technique of the drama: An exposition of dramatic composi- tion and art. S. Griggs, 1895. 2
-
[18]
Grunde-McLaughlin, M
M. Grunde-McLaughlin, M. S. Lam, R. Krishna, D. S. Weld, and J. Heer. Designing llm chains by adapting techniques from crowdsourcing work- flows. ACM Trans. Comput.-Hum. Interact., 2025. doi: 10.1145/3716134 3, 4
2025 doi
- [19]
-
[20]
M. N. Hoque, B. Ghai, K. Kraus, and N. Elmqvist. Portrayal: Leveraging nlp and visualization for analyzing fictional characters. In Proceedings of the 2023 ACM Designing Interactive Systems Conference, pp. 74–94,
2023
-
[21]
House and A
N. House and A. Johnston. Clover connections: Visualising character dynamics in novels for non-experts. In Proceedings of the 35th Australian Computer-Human Interaction Conference, pp. 191–201, 2023. doi: 10. 1145/3638380.3638384 1, 2, 3
2023
-
[22]
Huang, J
Y . Huang, J. Song, Z. Wang, S. Zhao, H. Chen, F. Juefei-Xu, and L. Ma. Look before you leap: An exploratory study of uncertainty measurement for large language models. IEEE Trans. Softw. Eng., 51(2):413–429, 17 pages, 2025. doi: 10.1109/TSE.2024.3519464 9
2025
-
[23]
Hulstein, V
G. Hulstein, V . Peña-Araya, and A. Bezerianos. Geo-storylines: Integrat- ing maps into storyline visualizations. IEEE Transactions on Visualization and Computer Graphics , 29(1):994–1004, 2022. doi: 10.1109/TVCG. 2022.3209480 2
2022
- [24]
-
[25]
M. John, M. Baumann, D. Schuetz, S. Koch, and T. Ertl. A visual approach for the comparative analysis of character networks in narrative texts. In IEEE Pacific Visualization Symposium (PacificVis), pp. 247–256, 2019. doi: 10.1109/PacificVis.2019.00037 6
2019
- [26]
-
[27]
D. A. Keim and D. Oelke. Literature fingerprinting: A new method for visual literary analysis. In IEEE Symposium on Visual Analytics Science and Technology, pp. 115–122, 2007. doi: 10.1109/V AST.2007.4389004 2
2007
-
[28]
N. W. Kim, B. Bach, H. Im, S. Schriber, M. Gross, and H. Pfister. Vi- sualizing nonlinear narratives with story curves. IEEE transactions on visualization and computer graphics, 24(1):595–604, 2017. doi: 10.1109/ TVCG.2017.2744118 1, 2, 5
2017
- [29]
-
[30]
Labatut and X
V . Labatut and X. Bost. Extraction and analysis of fictional character networks: A survey. ACM Computing Surveys (CSUR), 52(5):1–40, 2019. doi: 10.1145/3344548 6
2019 doi
-
[31]
Lewis, E
P. Lewis, E. Perez, A. Piktus, F. Petroni, V . Karpukhin, N. Goyal, H. Küt- tler, M. Lewis, W.-t. Yih, T. Rocktäschel, et al. Retrieval-augmented generation for knowledge-intensive nlp tasks. In Proceedings of the 34th International Conference on Neural Information Processing ...
2020
-
[32]
S. Liu, Y . Wu, E. Wei, M. Liu, and Y . Liu. Storyflow: Tracking the evolution of stories. IEEE Transactions on Visualization and Computer Graphics, 19(12):2436–2445, 2013. doi: 10.1109/TVCG.2013.196 1, 2, 5
2013 doi
-
[33]
J. Lu, B. Pan, J. Chen, Y . Feng, J. Hu, Y . Peng, and W. Chen. Agentlens: Visual analysis for agent behaviors in llm-based autonomous systems. IEEE Transactions on Visualization and Computer Graphics, 2024. doi: 10.1109/TVCG.2024.3394053 2
2024
-
[34]
Masson, Z
D. Masson, Z. Zhao, and F. Chevalier. Visual writing: Writing by manipu- lating visual representations of stories. arXiv preprint arXiv:2410.07486,
-
[35]
McCurdy, J
N. McCurdy, J. Lein, K. Coles, and M. Meyer. Poemage: Visualizing the sonic topology of a poem. IEEE transactions on visualization and com- puter graphics, 22(1):439–448, 2015. doi: 10.1109/TVCG.2015.2467811 2, 3
2015
-
[36]
Michel, E
G. Michel, E. V . Epure, R. Hennequin, and C. Cerisara. Improving quotation attribution with fictional character embeddings. In Findings of the Association for Computational Linguistics: EMNLP 2024, pp. 12723– 12735, 2024. doi: 10.18653/v1/2024.findings-emnlp.744 4
2024 doi
-
[37]
Min and J
S. Min and J. Park. Modeling narrative structure and dynamics with net- works, sentiment analysis, and topic modeling.PloS one, 14(12):e0226025,
-
[38]
F. Moretti. Distant reading. Verso Books, 2013. doi: 10.1093/llc/fqu010 9
2013 doi
-
[39]
M. E. Mortenson. Mathematics for computer graphics applications. In- dustrial Press Inc., 1999. doi: 10.5555/520335 6
1999 doi
-
[40]
R. Munroe. Movie narrative charts. https://xkcd.com/657/, Decem- ber 2009. 2, 5
2009
-
[41]
Narechania, A
A. Narechania, A. Srinivasan, and J. Stasko. Nl4dv: A toolkit for gener- ating analytic specifications for data visualization from natural language queries. IEEE Transactions on Visualization and Computer Graphics , 27(2):369–379, 2020. doi: 10.1109/TVCG.2020.3030378 2, 9
2020
-
[42]
Oelke, D
D. Oelke, D. Kokkinakis, and M. Malm. Advanced visual analytics methods for literature analysis. In Proceedings of the 6th Workshop on Language Technology for Cultural Heritage, Social Sciences, and Humanities, pp. 35–44, 2012. doi: 10.5555/2390357.2390364 2
2012
-
[43]
Otake, S
T. Otake, S. Yokoi, N. Inoue, R. Takahashi, T. Kuribayashi, and K. Inui. Modeling event salience in narratives via barthes’ cardinal functions. In Proceedings of the 28th International Conference on Computational Lin- guistics, pp. 1784–1794, 2020. doi: 10.18653/v1/2020.coling...
2020 doi
-
[44]
Padia, K
K. Padia, K. H. Bandara, and C. G. Healey. A system for generating story- line visualizations using hierarchical task network planning. Computers & Graphics, 78:64–75, 2019. doi: 10.1016/j.cag.2018.11.004 2
2019 doi
-
[45]
Peña-Araya, T
V . Peña-Araya, T. Xue, E. Pietriga, L. Amsaleg, and A. Bezerianos. Hy- perstorylines: Interactively untangling dynamic hypergraphs. Information Visualization, 21(1):38–62, 2022. doi: 10.1177/14738716211045007 2
2022 doi
-
[46]
Piper and S
A. Piper and S. Bagga. Using large language models for understanding narrative discourse. In Proceedings of the The 6th Workshop on Narrative Understanding, pp. 37–46, 2024. doi: 10.18653/v1/2024.wnu-1.4 2
2024 doi
-
[47]
Piper, M
A. Piper, M. Xu, and D. Ruths. The social lives of literary characters: Combining citizen science and language models to understand narrative social networks. In Proceedings of the 4th International Conference on Natural Language Processing for Digital Humanities, pp. 472–482,...
2024 doi
-
[48]
Qiang and C
L. Qiang and C. Bingjie. Storycake: A hierarchical plot visualization method for storytelling in polar coordinates. In International Conference on Cyberworlds (CW), pp. 211–218. IEEE, 2016. doi: 10.1109/CW.2016. 43 2
2016 doi
-
[49]
Rashkin, A
H. Rashkin, A. Celikyilmaz, Y . Choi, and J. Gao. Plotmachines: Outline- conditioned generation with dynamic plot state tracking. In Proceedings of the Conference on Empirical Methods in Natural Language Processing (EMNLP), pp. 4274–4295, 2020. doi: 10.18653/v1/2020.emnlp-main.349 4
2020 doi
-
[50]
Rebora et al
S. Rebora et al. Sentiment analysis in literary studies. a critical survey. Digital Humanities Quarterly, 17(2):1–17, 2023. 3
2023
-
[51]
Schwan, J
H. Schwan, J. Jacke, R. Kleymann, J.-E. Stange, and M. Dörk. Narrela- tions—visualizing narrative levels and their correlations with temporal phenomena. DHQ: Digital Humanities Quarterly, 13(3), 2019. 2
2019
-
[52]
Scrivner and J
O. Scrivner and J. Davis. Interactive text mining suite: Data visualization for literary studies. In CDH@ TLT, pp. 29–38, 2017. 2, 3
2017
-
[53]
Segel and J
E. Segel and J. Heer. Narrative visualization: Telling stories with data. IEEE transactions on visualization and computer graphics, 16(6):1139– 1148, 2010. doi: 10.1109/TVCG.2010.179 1, 2
2010 doi
-
[54]
J. Shen, J. Mire, H. W. Park, C. Breazeal, and M. Sap. Heart-felt narra- tives: Tracing empathy and narrative style in personal stories with llms. In Proceedings of the 2024 Conference on Empirical Methods in Natu- ral Language Processing, pp. 1026–1046, 2024. doi: 10.18653/v1...
2024 doi
-
[55]
Shneiderman
B. Shneiderman. The eyes have it: A task by data type taxonomy for information visualizations. In Proceedings IEEE Symposium on Visual Languages, pp. 336–343, 1996. doi: 10.1109/VL.1996.545307 5
1996
-
[56]
J. D. Spence. The memory palace of Matteo Ricci. Penguin, 1985. doi: 10. 2307/2056104 9
1985
-
[57]
M. Steen. Co-design as a process of joint inquiry and imagination. Design issues, 29(2):16–28, 2013. doi: 10.1162/DESI_a_00207 2
2013 doi
-
[58]
Tanahashi and K.-L
Y . Tanahashi and K.-L. Ma. Design considerations for optimizing story- line visualizations. IEEE Transactions on Visualization and Computer Graphics, 18(12):2679–2688, 2012. doi: 10.1109/TVCG.2012.212 2
2012 doi
-
[59]
T. Tang, R. Li, X. Wu, S. Liu, J. Knittel, S. Koch, T. Ertl, L. Yu, P. Ren, and Y . Wu. Plotthread: Creating expressive storyline visualizations using reinforcement learning. IEEE Transactions on Visualization and Computer Graphics, 27(2):294–303, 2020. doi: 10.1109/TVCG.2020....
2020
-
[60]
T. Tang, S. Rubab, J. Lai, W. Cui, L. Yu, and Y . Wu. istoryline: Effective convergence to hand-drawn storylines. IEEE transactions on visualization and computer graphics, 25(1):769–778, 2018. doi: 10.1109/TVCG.2018. 2864899 2, 5
2018 doi
-
[61]
Vaithilingam, E
P. Vaithilingam, E. L. Glassman, J. P. Inala, and C. Wang. Dynavis: Dy- namically synthesized ui widgets for visualization editing. In Proceedings of the CHI Conference on Human Factors in Computing Systems, pp. 1–17,
-
[62]
Van Ham, M
F. Van Ham, M. Wattenberg, and F. B. Viégas. Mapping text with phrase nets. IEEE transactions on visualization and computer graph- ics, 15(6):1169–1176, 2009. doi: 10.1109/TVCG.2009.165 2
2009 doi
-
[63]
Venkatraman, N
S. Venkatraman, N. I. Tripto, and D. Lee. Collabstory: Multi-llm col- laborative story generation and authorship analysis. In Findings of the Association for Computational Linguistics: NAACL 2025, pp. 3665–3679,
2025
-
[64]
T. Wang, J. He, and C. Xiong. Ragviz: Diagnose and visualize retrieval- augmented generation. In Proceedings of the 2024 Conference on Empir- ical Methods in Natural Language Processing: System Demonstrations, pp. 320–327, 2024. doi: 10.18653/v1/2024.emnlp-demo.33 9
2024 doi
-
[65]
doi: 10.1145/3613904.3642639 2, 9
-
[66]
Watson, S
K. Watson, S. S. Sohn, S. Schriber, M. Gross, C. M. Muniz, and M. Ka- padia. Storyprint: An interactive visualization of stories. In Proceedings of the 24th international conference on intelligent user interfaces , pp. 303–311, 2019. doi: 10.1145/3301275.3302302 1, 2, 3, 5
2019
-
[67]
J. Wei, X. Wang, D. Schuurmans, M. Bosma, F. Xia, E. Chi, Q. V . Le, D. Zhou, et al. Chain-of-thought prompting elicits reasoning in large language models. In Proceedings of the 36th International Conference on Neural Information Processing Systems, article no. 1800, 14 pages,...
2022
-
[68]
A. Wu, Y . Wang, X. Shu, D. Moritz, W. Cui, H. Zhang, D. Zhang, and H. Qu. Ai4vis: Survey on artificial intelligence approaches for data visualization. IEEE Transactions on Visualization and Computer Graphics, 28(12):5049–5070, 2021. doi: 10.1109/TVCG.2021.3099002 2
2021
-
[69]
W. Yang, M. Liu, Z. Wang, and S. Liu. Foundation models meet visual- izations: Challenges and opportunities. Computational Visual Media, pp. 1–26, 2024. doi: 10.1007/s41095-023-0393-x 2
2024 doi
-
[70]
Ware and R
S. Ware and R. Young. Modeling narrative conflict to generate interesting stories. In Proceedings of the AAAI Conference on Artificial Intelligence and Interactive Digital Entertainment, vol. 6, pp. 210–215, 2010. doi: 10. 1609/aiide.v6i1.12411 3
2010
- [71]
-
[72]
Zamenopoulos and K
T. Zamenopoulos and K. Alexiou. Co-design as collaborative research. Bristol University/AHRC Connected Communities Programme, 2018. 2
2018
-
[73]
A. Zehe, L. Konle, L. K. Dümpelmann, E. Gius, A. Hotho, F. Jannidis, L. Kaufmann, M. Krug, F. Puppe, N. Reiter, et al. Detecting scenes in fiction: A new segmentation task. In Proceedings of the 16th conference of the European chapter of the association for computational lingu...
2021 doi
-
[74]
Zhang, M
X. Zhang, M. Chen, and J. May. Salience-aware event chain modeling for narrative understanding. In Proceedings of the 2021 Conference on Empirical Methods in Natural Language Processing, pp. 1418–1428, 2021. doi: 10.18653/v1/2021.emnlp-main.107 3
2021 doi
- [75]
-
[2019]
doi: 10.1371/journal.pone.0226025 1, 2, 3, 6
-
[2023]
doi: 10.1145/3563657.3596000 1, 2, 3
- [2024]
-
[2025]
doi: 10.18653/v1/2025.findings-naacl.203 7
2025 doi
Reviewed August 5, 2026 · model on record in the stance chip above.
Discussion (0). Continue with ORCID to comment.