Anomalies in Multivariate Time Series Benchmarks Are Mostly Univariate
Pith reviewed 2026-06-28 15:27 UTC · model grok-4.3
The pith
Anomalies in standard multivariate time series benchmarks almost always show up as deviations in single channels.
A machine-rendered reading of the paper's core claim, the machinery that carries it, and where it could break.
Core claim
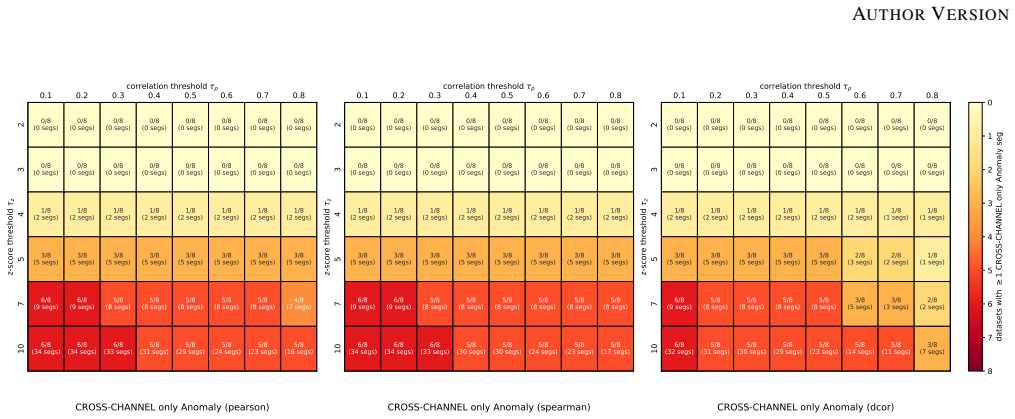
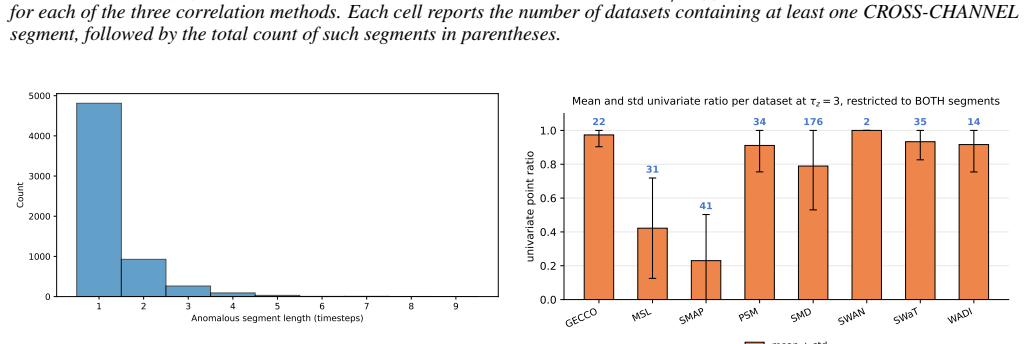
No cross-channel rupture occurs without an accompanying univariate deviation across a range of reasonable thresholds. On six of the eight benchmarks, at least half of the labeled anomaly segments deviate univariately on 89 percent to 100 percent of their timesteps. The same diagnostic correctly identifies engineered cross-channel anomalies in synthetic data, yet channel-dependent models show no measurable advantage over channel-independent ones on the real benchmarks.
What carries the argument
The per-segment diagnostic framework that classifies each labeled anomaly segment by the presence of univariate channel deviation, cross-channel correlation change, or both.
If this is right
- Channel-dependent models bring no measurable gain on these benchmarks compared with channel-independent ones.
- Current public MTSAD benchmarks cannot validate the value of cross-channel modeling.
- New evaluation sets containing anomalies whose structure genuinely spans multiple channels are required.
Where Pith is reading between the lines
- Effort spent on cross-channel components in MTSAD models may be misdirected for the domains represented by these benchmarks.
- Univariate anomaly detection methods may already be sufficient for the majority of cases these benchmarks contain.
- Real-world multivariate anomaly problems outside these eight datasets could still benefit from cross-channel modeling if they contain different anomaly structures.
Load-bearing premise
The diagnostic correctly separates univariate deviations from cross-channel changes when run on the actual benchmark data.
What would settle it
Finding even one benchmark in which a substantial fraction of labeled anomaly segments exhibit cross-channel rupture with no univariate deviation at the thresholds used in the study.
Figures
read the original abstract
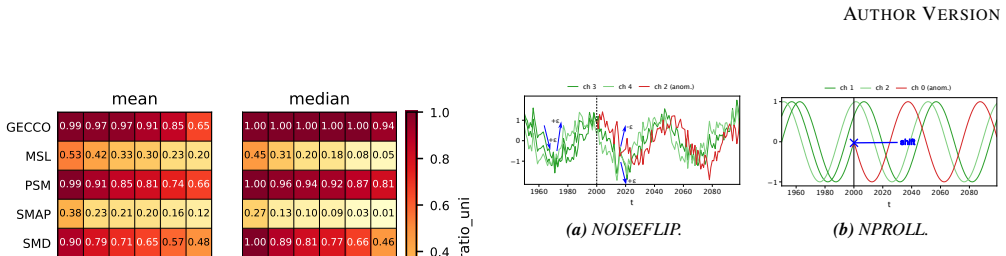
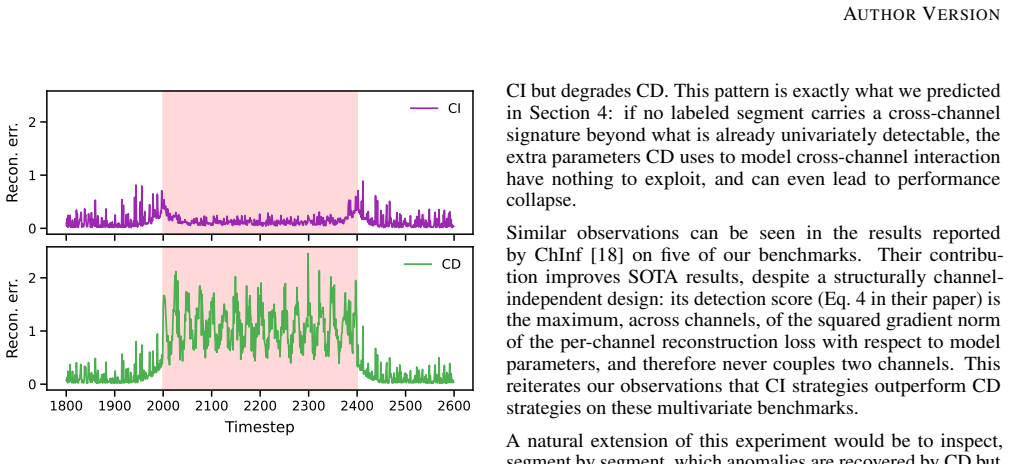
Many recent multivariate time series anomaly detection (MTSAD) models incorporate cross-channel modeling, under the implicit assumption that the structure of anomalies may be spread across multiple channels. We evaluate this assumption on eight widely used public benchmarks by introducing a per-segment diagnostic framework that flags, for each labeled anomaly, whether at least one channel deviates individually from its normal history, whether the cross-channel correlation structure changes, or both. The framework shows that no cross-channel rupture occurs without an accompanying univariate deviation across a range of reasonable thresholds. A complementary metric also reveals that on six of the eight benchmarks, at least half of the labeled anomaly segments deviate univariately on 89% to 100% of their timesteps, reaching 100% on three of these datasets. To verify that our framework captures cross-channel structure when present, we construct synthetic data of phase-shifted sinusoidal channels with shared noise. Each anomalous segment is altered through one of two channel-wise corruptions that preserve the per-channel marginal distribution while breaking cross-channel structure, and our framework correctly characterizes these segments as cross-channel-only. On these data, channel-dependent (CD) models successfully exploit the cross-channel signal whereas channel-independent (CI) ones fail. The CI/CD comparison of a recent SOTA detector on real benchmarks further confirms that CD modeling brings no measurable gain. We conclude that current MTSAD benchmarks are unsuitable for validating cross-channel modeling capabilities, and we call for the development of more structurally diverse evaluation sets. The code for this study is publicly available.
Editorial analysis
A structured set of objections, weighed in public.
Referee Report
Summary. The manuscript evaluates the assumption underlying many MTSAD models that anomalies involve cross-channel structure. On eight public benchmarks it applies a per-segment diagnostic framework that classifies each labeled anomaly segment by the presence of univariate channel deviations, changes in cross-channel correlation structure, or both. The framework finds no cross-channel ruptures without accompanying univariate deviations across thresholds; a complementary per-timestep metric shows that on six benchmarks at least half the anomaly segments deviate univariately on 89–100 % of their timesteps. A synthetic dataset of phase-shifted sinusoids with controlled channel-wise corruptions (preserving marginals while breaking cross-channel dependence) is used to verify that the framework correctly flags cross-channel-only anomalies. Channel-dependent vs. channel-independent model comparisons on both synthetic and real data show no measurable benefit from cross-channel modeling, leading to the conclusion that current benchmarks are unsuitable for validating such capabilities.
Significance. If the central empirical findings hold, the work identifies a structural limitation in existing MTSAD benchmarks that could redirect dataset construction and model evaluation practices. Credit is due for the synthetic control experiment that isolates cross-channel effects while preserving per-channel marginals, the public release of code, and the consistency of results across thresholds. These elements make the claims more falsifiable and reproducible than typical benchmark critiques.
minor comments (2)
- [Abstract and §3] Abstract and §3: the phrase 'a range of reasonable thresholds' should be accompanied by the concrete numerical values (or a table) actually used for the univariate deviation and correlation-change detectors so that readers can assess sensitivity without consulting the released code.
- [§4] §4 (synthetic data): the precise parameters of the phase-shifted sinusoids and the two channel-wise corruption operators should be stated explicitly (e.g., shift amounts, noise variance, corruption magnitude) rather than left to the code repository.
Simulated Author's Rebuttal
We thank the referee for the positive summary of our manuscript, the recognition of the synthetic control experiment, code release, and threshold consistency, and the recommendation for minor revision. No major comments were listed in the report.
Circularity Check
No significant circularity
full rationale
The paper's central claims rest on an explicitly defined per-segment diagnostic framework applied directly to eight public benchmark datasets and validated on independently constructed synthetic data (phase-shifted sinusoids with controlled channel-wise corruptions that preserve marginals). No equations, fitted parameters, or self-citations are used to derive the reported metrics; the framework is tested for its ability to detect cross-channel structure when present, and the real-data results follow from direct measurement of labeled segments. This structure is self-contained against external benchmarks and does not reduce any prediction or uniqueness claim to its own inputs by construction.
Axiom & Free-Parameter Ledger
free parameters (1)
- univariate deviation threshold
axioms (1)
- domain assumption An anomaly segment can be classified by the presence of univariate deviation, cross-channel correlation change, or both.
Reference graph
Works this paper leans on
-
[1]
Ad- vances in Time-Series Anomaly Detection: Algorithms, Benchmarks, and Evaluation Measures
J. Paparrizos, P. Boniol, Q. Liu, and T. Palpanas. “Ad- vances in Time-Series Anomaly Detection: Algorithms, Benchmarks, and Evaluation Measures”. In:KDD. KDD ’25: The 31st ACM SIGKDD Conference on Knowl- edge Discovery and Data Mining. Toronto, ON, Canada: ACM, Aug. 3, 2025, pp. 6151–6161. DOI: 10.1145/ 3711896.3736565
-
[2]
Graph Neural Network-Based Anomaly Detection in Multivariate Time Series
A. Deng and B. Hooi. “Graph Neural Network-Based Anomaly Detection in Multivariate Time Series”. In: AAAI. V ol. 35. 5. 2021, pp. 4027–4035.DOI: 10.1609/ aaai.v35i5.16523
2021
-
[3]
Multivariate Time- Series Anomaly Detection via Graph Attention Net- work
H. Zhao, Y . Wang, J. Duan, C. Huang, D. Cao, Y . Tong, B. Xu, J. Bai, J. Tong, and Q. Zhang. “Multivariate Time- Series Anomaly Detection via Graph Attention Net- work”. In: ICDM. 2020 IEEE International Conference on Data Mining (ICDM). IEEE, Nov. 2020, pp. 841–850. DOI: 10.1109/ICDM50108.2020.00093
-
[4]
CATCH: Channel-Aware Multivariate Time Series Anomaly Detection via Frequency Patch- ing
X. Wu, X. Qiu, Z. Li, Y . Wang, J. Hu, C. Guo, H. Xiong, and B. Yang. “CATCH: Channel-Aware Multivariate Time Series Anomaly Detection via Frequency Patch- ing”. In: ICLR. 2025
2025
-
[5]
XCTFormer: Leveraging Cross-Channel and Cross-Time Dependencies for En- hanced Time-Series Analysis
I. Zexer and O. Azencot. “XCTFormer: Leveraging Cross-Channel and Cross-Time Dependencies for En- hanced Time-Series Analysis”. In: TMLR (Mar. 18, 2026)
2026
-
[6]
A Time Series Is Worth 64 Words: Long-Term Forecast- ing with Transformers
Y . Nie, N. H. Nguyen, P. Sinthong, and J. Kalagnanam. “A Time Series Is Worth 64 Words: Long-Term Forecast- ing with Transformers”. In: ICLR. 2023
2023
-
[7]
L. Han, H.-J. Ye, and D.-C. Zhan. “The Capacity and Robustness Trade-Off: Revisiting the Channel Indepen- dent Strategy for Multivariate Time Series Forecasting”. In: IEEE TKDE 36.11 (Nov. 2024), pp. 7129–7142. DOI: 10.1109/TKDE.2024.3400008
-
[8]
X. Qiu, H. Cheng, X. Wu, J. Lu, J. Hu, C. Guo, C. S. Jensen, and B. Yang. A Comprehensive Survey of Deep Learning for Multivariate Time Series Forecasting: A Channel Strategy Perspective. Jan. 27, 2026. DOI: 10. 48550 / arXiv . 2502 . 10721. URL: http : / / arxiv . org/abs/2502.10721 (visited on 04/11/2026). Pre- published
-
[9]
DCde- tector: Dual Attention Contrastive Representation Learn- ing for Time Series Anomaly Detection
Y . Yang, C. Zhang, T. Zhou, Q. Wen, and L. Sun. “DCde- tector: Dual Attention Contrastive Representation Learn- ing for Time Series Anomaly Detection”. In: KDD. Aug. 6, 2023, pp. 3033–3045. DOI: 10.1145/3580305. 3599295
-
[10]
KAN-AD: Time Series Anomaly Detection with Kolmogorov–Arnold Networks
Q. Zhou, C. Pei, F. Sun, H. Jing, Z. Gao, H. Zhang, G. Xie, D. Pei, and J. Li. “KAN-AD: Time Series Anomaly Detection with Kolmogorov–Arnold Networks”. In: ICML. V ol. 267. Proceedings of Machine Learning Re- search. PMLR, 2025, pp. 79136–79149
2025
-
[11]
CrossAD: Time Series Anomaly Detection with Cross-Scale Associations and Cross- Window Modeling
B. Li, Q. Shentu, Y . Shu, H. Zhang, M. Li, N. Jin, B. Yang, and C. Guo. “CrossAD: Time Series Anomaly Detection with Cross-Scale Associations and Cross- Window Modeling”. In: NeurIPS. 2025
2025
-
[12]
Towards a General Time Series Anomaly Detector with Adaptive Bottlenecks and Dual Adversarial Decoders
Q. Shentu, B. Li, K. Zhao, Y . Shu, Z. Rao, L. Pan, B. Yang, and C. Guo. “Towards a General Time Series Anomaly Detector with Adaptive Bottlenecks and Dual Adversarial Decoders”. In: ICLR. 2025
2025
-
[13]
CiTranGAN: Channel-Independent Based-Anomaly De- tection for Multivariate Time Series Data
X. Chen, T. Li, Z. Ma, J. Chen, J. Guo, and Z. Liu. “CiTranGAN: Channel-Independent Based-Anomaly De- tection for Multivariate Time Series Data”. In: Elec- tronics 14.9 (May 2, 2025), p. 1857. DOI: 10.3390/ electronics14091857
2025
-
[14]
The Distance Corre- lation T-test of Independence in High Dimension
G. J. Sz ´ekely and M. L. Rizzo. “The Distance Corre- lation T-test of Independence in High Dimension”. In: J. Multivar. Anal. 117 (May 2013), pp. 193–213. DOI: 10.1016/j.jmva.2013.02.012
-
[15]
PatchAD: A Lightweight Patch-Based MLP-Mixer for Time Series Anomaly Detection
Z. Zhong, Z. Yu, Y . Yang, W. Wang, K. Yang, and C. L. P. Chen. “PatchAD: A Lightweight Patch-Based MLP-Mixer for Time Series Anomaly Detection”. In: IEEE TBD 11 (2025), pp. 3460–3473. DOI: 10.1109/ TBDATA.2025.3596745
-
[16]
Cluster-Aware Causal Mixer for Online Anomaly Detection in Multivariate Time Series
M. M. N. Murad and Y . Yilmaz. “Cluster-Aware Causal Mixer for Online Anomaly Detection in Multivariate Time Series”. In: ICML. 2026. DOI: 10.48550/arXiv. 2506.00188
work page internal anchor Pith review Pith/arXiv arXiv doi:10.48550/arxiv 2026
-
[17]
DBAD: A Dual-Branch Time Series Anomaly Detec- tion Method Based on Transformer and MLP
Y . Sun, N. Zhang, C. Zhang, M. Wang, and C. Shi. “DBAD: A Dual-Branch Time Series Anomaly Detec- tion Method Based on Transformer and MLP”. In: AICI. AICI 2025: 2025 International Conference on Artifi- cial Intelligence and Computational Intelligence. Kuala 9 AUTHOR VERSION Lumpur Malaysia: ACM, Feb. 14, 2025, pp. 440–446. DOI: 10.1145/3730436.3730510
-
[18]
arXiv preprint arXiv:2408.14763 , year=
M. Wang, Z. Xie, B. Chen, H. Liu, and J. Kwok. “Chan- nel Matters: Estimating Channel Influence for Multivari- ate Time Series”. In: NeurIPS. 2026. DOI: 10.48550/ arXiv.2408.14763
-
[19]
R. Wu and E. Keogh. “Current Time Series Anomaly Detection Benchmarks Are Flawed and Are Creating the Illusion of Progress”. In: IEEE TKDE (2021), pp. 1–1. DOI: 10.1109/TKDE.2021.3112126
-
[20]
Y . Su, Y . Zhao, C. Niu, R. Liu, W. Sun, and D. Pei. “Robust Anomaly Detection for Multivariate Time Se- ries through Stochastic Recurrent Neural Network”. In: KDD. KDD ’19: The 25th ACM SIGKDD Conference on Knowledge Discovery and Data Mining. Anchorage AK USA: ACM, July 25, 2019, pp. 2828–2837. DOI: 10.1145/3292500.3330672
-
[21]
TimeSeAD: Benchmarking Deep Multivariate Time-Series Anomaly Detection
D. Wagner, T. Michels, F. C. F. Schulz, A. Nair, M. Rudolph, and M. Kloft. “TimeSeAD: Benchmarking Deep Multivariate Time-Series Anomaly Detection”. In: TMLR (2023)
2023
-
[22]
Position: Quo Vadis, Unsupervised Time Series Anomaly Detection?
M. S. Sarfraz, M.-Y . Chen, L. Layer, K. Peng, and M. Koulakis. “Position: Quo Vadis, Unsupervised Time Series Anomaly Detection?” In: ICML. V ol. 235. Pro- ceedings of Machine Learning Research. PMLR, 2024, pp. 43461–43476
2024
-
[23]
In: Globerson, A., Mackey, L., Belgrave, D., Fan, A., Paquet, U., Tomczak, J., Zhang, C
Q. Liu and J. Paparrizos. “The Elephant in the Room: To- wards a Reliable Time-Series Anomaly Detection Bench- mark”. In: NeurIPS. V ol. 37. Curran Associates, Inc., 2024, pp. 108231–108261. DOI: 10.52202/079017- 3437
-
[24]
mTSBench: Bench- marking Multivariate Time Series Anomaly Detection and Model Selection at Scale
X. Zhou, C. Brif, and I. Lourentzou. “mTSBench: Bench- marking Multivariate Time Series Anomaly Detection and Model Selection at Scale”. In: TMLR (2026)
2026
-
[25]
An Evaluation of Anomaly Detection and Diagno- sis in Multivariate Time Series
A. Garg, W. Zhang, J. Samaran, R. Savitha, and C. -S. Foo. “An Evaluation of Anomaly Detection and Diagno- sis in Multivariate Time Series”. In:IEEE TNNLS 33.6 (June 2022), pp. 2508–2517. DOI: 10 . 1109 / TNNLS . 2021.3105827
-
[26]
Anomaly Detectors for Multivariate Time Series: The Proof of the Pudding is in the Eating
P. Wenig, S. Schmidl, and T. Papenbrock. “Anomaly Detectors for Multivariate Time Series: The Proof of the Pudding is in the Eating”. In: ICDEW. 2024, pp. 96–101. DOI: 10.1109/ICDEW61823.2024.00018
-
[27]
C.-C. M. Yeh, Y . Zhu, L. Ulanova, N. Begum, Y . Ding, H. A. Dau, D. F. Silva, A. Mueen, and E. Keogh. “Ma- trix Profile I: All Pairs Similarity Joins for Time Series: A Unifying View That Includes Motifs, Discords and Shapelets”. In: ICDM. 2016 IEEE 16th International Conference on Data Mining (ICDM). Barcelona, Spain: IEEE, Dec. 2016, pp. 1317–1322. DOI...
-
[28]
Mea- suring and Testing Dependence by Correlation of Dis- tances
G. J. Sz ´ekely, M. L. Rizzo, and N. K. Bakirov. “Mea- suring and Testing Dependence by Correlation of Dis- tances”. In: Ann. Statist. 35.6 (Dec. 2007), pp. 2769–
2007
-
[29]
DOI: 10.1214/009053607000000505
-
[30]
Im- proved distance correlation estimation
B. E. Monroy-Castillo, M. A. J´acome, and R. Cao. “Im- proved distance correlation estimation”. In: Applied In- telligence 55.4 (2025), p. 263. DOI: 10.1007/s10489- 024-05940-x
-
[31]
Rethinking Channel Dependence for Multivariate Time Series Forecasting: Learning from Leading Indicators
L. Zhao and Y . Shen. “Rethinking Channel Dependence for Multivariate Time Series Forecasting: Learning from Leading Indicators”. In: ICLR. 2024
2024
-
[32]
To- wards a Rigorous Evaluation of Time-Series Anomaly Detection
S. Kim, K. Choi, H.-S. Choi, B. Lee, and S. Yoon. “To- wards a Rigorous Evaluation of Time-Series Anomaly Detection”. In: AAAI. V ol. 36. 7. June 30, 2022, pp. 7194–7201. DOI: 10.1609/aaai.v36i7.20680
-
[33]
Anomaly Detection in Time Series: A Comprehensive Evaluation
S. Schmidl, P. Wenig, and T. Papenbrock. “Anomaly Detection in Time Series: A Comprehensive Evaluation”. In: PVLDB 15.9 (May 2022), pp. 1779–1797. DOI: 10. 14778/3538598.3538602
-
[34]
S. Moritz, F. Rehbach, S. Chandrasekaran, M. Rebolledo, and T. Bartz-Beielstein. GECCO Industrial Challenge 2018 Dataset: A Water Quality Dataset for the ’Internet of Things: Online Anomaly Detection for Drinking Water Quality’ Competition at the Genetic and Evolutionary Computation Conference 2018, Kyoto, Japan. Zenodo, Feb. 1, 2018. DOI: 10.5281/ZENODO.3884398
-
[35]
K. Hundman, V . Constantinou, C. Laporte, I. Colwell, and T. Soderstrom. “Detecting Spacecraft Anomalies Us- ing LSTMs and Nonparametric Dynamic Thresholding”. In: KDD. KDD ’18: The 24th ACM SIGKDD Interna- tional Conference on Knowledge Discovery and Data Mining. London United Kingdom: ACM, July 19, 2018, pp. 387–395. DOI: 10.1145/3219819.3219845
-
[36]
Practical Approach to Asynchronous Multivariate Time Series Anomaly Detection and Localization
A. Abdulaal, Z. Liu, and T. Lancewicki. “Practical Approach to Asynchronous Multivariate Time Series Anomaly Detection and Localization”. In: KDD. KDD ’21: The 27th ACM SIGKDD Conference on Knowledge Discovery and Data Mining. Virtual Event Singapore: ACM, Aug. 14, 2021, pp. 2485–2494. DOI: 10.1145/ 3447548.3467174
-
[37]
J. Goh, S. Adepu, K. N. Junejo, and A. Mathur. “A Dataset to Support Research in the Design of Secure Wa- ter Treatment Systems”. In:CRITIS. V ol. 10242. Lecture Notes in Computer Science. Cham: Springer Interna- tional Publishing, 2017, pp. 88–99. DOI: 10.1007/978- 3-319-71368-7_8
-
[38]
Multivariate Time Series Dataset for Space Weather Data Analytics
R. A. Angryk, P. C. Martens, B. Aydin, D. Kempton, S. S. Mahajan, S. Basodi, A. Ahmadzadeh, X. Cai, S. Filali Boubrahimi, S. M. Hamdi, M. A. Schuh, and M. K. Georgoulis. “Multivariate Time Series Dataset for Space Weather Data Analytics”. In: Sci. Data 7.1 (July 10, 2020), p. 227. DOI: 10.1038/s41597-020-0548-x
-
[39]
In: Proceedings of the 3rd international workshop on cyber-physical systems for smart water networks
C. M. Ahmed, V . R. Palleti, and A. P. Mathur. “WADI: A Water Distribution Testbed for Research in the Design of Secure Cyber Physical Systems”. In: CySWater. CPS Week ’17: Cyber Physical Systems Week 2017. Pitts- burgh Pennsylvania: ACM, Apr. 21, 2017, pp. 25–28. DOI: 10.1145/3055366.3055375
-
[40]
Tsay, Aaron Elmore, and Michael J
J. Paparrizos, P. Boniol, T. Palpanas, R. S. Tsay, A. El- more, and M. J. Franklin. “V olume under the Surface: A New Accuracy Evaluation Measure for Time-Series 10 AUTHOR VERSION Anomaly Detection”. In: PVLDB 15.11 (July 2022), pp. 2774–2787. DOI: 10.14778/3551793.3551830
-
[41]
PUPAE: Intuitive and Actionable Explanations for Time Series Anoma- lies
A. Der, C.-C. M. Yeh, Y . Zheng, J. Wang, Z. Zhuang, L. Wang, W. Zhang, and E. Keogh. “PUPAE: Intuitive and Actionable Explanations for Time Series Anoma- lies”. In: SDM. 2024, pp. 37–45. DOI: 10 . 1137 / 1 . 9781611978032.5. 11
2024
discussion (0)
Sign in with ORCID, Apple, or X to comment. Anyone can read and Pith papers without signing in.