REVIEW 4 major objections 7 minor 58 references
STRisk: A Socio-Technical Approach to Assess Hacking Breaches Risk
T0 review · 4 major / 7 minor · reviewed 2026-08-12 · deepseek-v4-flash
Pith's one-line read Combining external network scans with Twitter engagement separates breached from non-breached US organizations with an AUC above 98%, 12 points higher than technical features alone.
desk verdict The 98% AUC headline is a same-window classification score with label leakage, not a predictive result; still, the socio-technical feature combination and data effort deserve a fair shot under a temporal evaluation. read the letter →
The pith
A machine-rendered reading of the paper's core claim, the machinery that carries it, and where it could break.
The reading
What carries the argument
The load-bearing object is the per-organization socio-technical profile, a feature vector that pairs externally measured network misconfigurations (number and ratio of open ports, expired certificates, blacklisted IPs, darknet IPs, and spam domains) with Twitter-derived engagement and sentiment statistics (mentions, unique accounts, retweet and like ratios, and polarity counts). In the paper's naming, spreadability is retweets per tweet, agreeability is likes per tweet, and debatability is retweets per reply. The second piece of machinery is the label-correction step: a noise transition matrix estimated by confident learning from out-of-sample predictions of six classifiers, which identifies non-victim organizations whose profiles look like victims and flips their labels before supervised training. The profile carries the prediction; the label correction removes the main known bias in the training set.
What would settle it
Strictly temporal validation would settle the claim: train STRisk only on organizations and features observed before a cutoff, measure test features only up to each test organization's breach or disclosure date, and compare AUC against the reported 98%. The paper's own forecasting-mode test reports 42.85% accuracy with three months of prior data and 71.42% with six months; re-running under a strict temporal split would show whether the 98% AUC survives without same-period aggregation.
Extended reading notes
Core claim
The central claim is that a socio-technical profile constructed entirely from external observations separates breached from non-breached organizations on the studied sample with an area under the ROC curve above 98%. XGBoost and CatBoost reach AUCs of 98.43% and 98.31% using technical features, Twitter features, sector, and organization size, versus roughly 86% with technical features alone; the paper interprets the gap as evidence that social posture carries independent predictive information. A secondary claim is that the negative sample is noisy, and that a confident-learning procedure over six classifiers can identify and flip 347 of 3,016 supposed non-victims, reducing label noise before training. The paper additionally reports that in a forecasting-style test with features measured only before new incidents from March 2020 to March 2021, accuracy rises from 42.85% with three months of prior data to 71.42% with six months, suggesting the model benefits from a longer pre-incident history.
Load-bearing premise
The evaluation assumes that features aggregated over January 2016 to September 2019 can be used to predict breaches from the same period without lookahead; if future events in a breach's own history leak into its profile, the 98% AUC measures contemporaneous correlation rather than predictive risk.
Editorial extensions
If this is right
- Organizations can be ranked by breach risk using only public data: port scans, certificate checks, blacklists, and Twitter engagement, without any internal access.
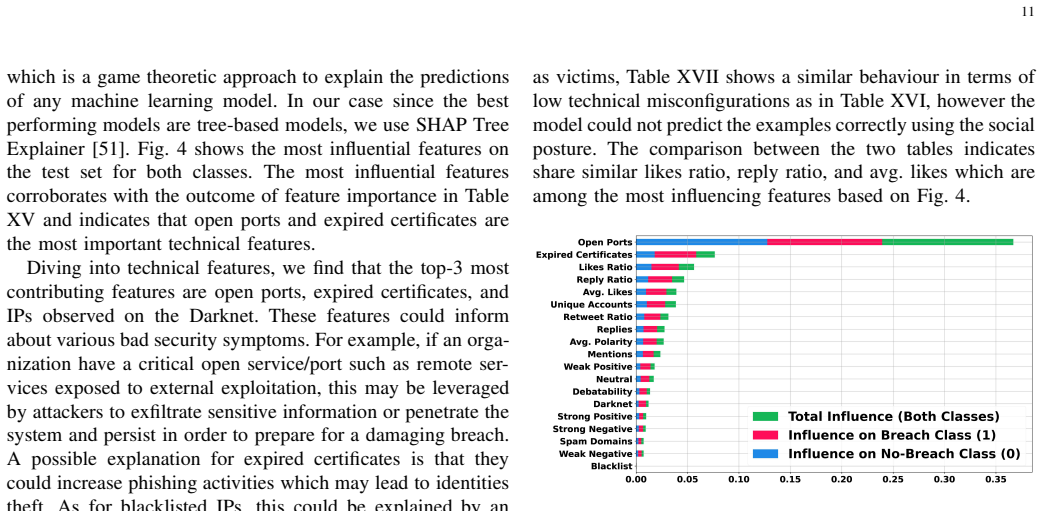
- Twitter-derived features contribute roughly 42% of model importance and, used alone, match the AUC of technical features alone, so social reputation is not a minor supplement.
- The label-flipping procedure implies that around 11% of apparently breach-free US organizations in the sample share victim-like profiles, a measurable estimate of unreported incidents.
- The forecasting-mode result suggests that prediction quality depends on the observation window; six months of accumulated socio-technical history beats three months.
Reading between the lines
- A natural stress test is to rebuild the profiles with a strict temporal lag, using only data from before each organization's breach date; if the 12-point social gain disappears, the same-period aggregation rather than social signals drove the result.
- The same socio-technical profile could be transferred to other reputational channels such as LinkedIn, Reddit, or dark-web forums to see whether spreadability reflects genuine exposure or just Twitter-specific attention.
- If the noise-correction step is re-run with only pre-breach features, the 347 flipped labels could shrink; comparing the two flipped sets would quantify how much leakage the confident-learning procedure absorbs.
- For insurers, the practical extension is a rolling risk score: retrain monthly on the trailing 12 months of external signals and test on the next month's publicly disclosed breaches, which would convert the 98% AUC into a usable forward forecast.
Signed reviews
Editorial analysis
A structured set of objections, weighed in public.
Referee Report
Summary. The paper proposes STRisk, a supervised learning system that combines externally measurable technical indicators (open ports, blacklists, darknet sightings, SSL certificates, spam domains) with Twitter-derived social signals (volume, retweet/like ratios, sentiment) to classify US organizations as likely or unlikely to experience a hacking breach. The dataset contains about 3,800 organizations, with reported incidents from PRC and VCDB between January 2016 and September 2019 and an ARIN-sampled negative set. The authors introduce a noise-correction procedure that flips some negative labels to positive based on out-of-sample predictions from six models, then train and evaluate tree-based, linear, and stacked classifiers. They report an AUC exceeding 98% for the combined socio-technical features, about 12% higher than technical features alone, and offer a SHAP-based feature importance analysis. A smaller forecasting experiment using features measured before incidents from March 2020 to March 2021 reports accuracies of 42.85% (3 months) and 71.42% (6 months).
Significance. If validated, STRisk would be an interesting demonstration that externally observable technical and social signals can contribute to organizational cyber-risk assessment, and the explicit treatment of unreported breaches is a useful direction. The data collection is substantial, and the feature-importance analysis with SHAP is a strength. However, the headline result is not supported by the current evaluation protocol: the random split and the use of model-generated flipped labels allow lookahead and circularity, so the 98% AUC cannot be interpreted as predictive skill. The forecasting experiment, while correctly using prior data, is far too small to compensate. The contribution is therefore plausible but unproven, and requires a substantially revised evaluation.
major comments (4)
- [Section VI.B and Section III] The evaluation does not enforce a temporal ordering between features and incidents. Both the socio-technical profiles and the labels are aggregated over January 2016 to September 2019 (Section III), and the 70/30 split in Section VI.B is random. Consequently, for any organization whose breach occurred early in that window, the aggregated features include measurements taken after the breach (e.g., open ports, expired certificates, tweets posted later in the period). The model can therefore learn post-breach correlates, and the AUC values in Table XII are contemporaneous association metrics rather than predictive performance. The paper's own limitation statement in Section VIII ('STRisk is trained on aggregated data over the considered period') acknowledges this issue.
- [Section V.C and Section VI.B] The label-correction step in Section V.C flips 347 negative examples to class 1 using predictions from six models, and the final classifiers in Section VI.B are trained and tested on the corrected dataset. Because the six models are fit on the full dataset (including the test portion) before the split, the test labels are partly generated by models that have already seen the test features. No nested cross-validation or separate holdout is described to prevent this circularity. This can substantially inflate the reported AUC in Table XII. The authors should either evaluate on a holdout set whose labels are never modified by the correction procedure, or apply noise correction only within training folds.
- [Section VII.B] The forecasting experiment cannot substitute for a proper temporal evaluation. It uses only 7 incidents (the reported accuracies 42.85% and 71.42% correspond to 3 and 5 correct predictions, respectively), reports only accuracy with no AUC, confidence intervals, or baseline comparison, and uses only victim organizations. With such a small sample, the difference between the 3-month and 6-month results is not statistically meaningful. This experiment does not support the statement that STRisk 'performs well in predicting future data breaches.'
- [Section V.B] The validation of the noise-detection method is performed on artificial noise injected into the positive sample, not on the actual negative sample where the correction is applied. The reported mean detection accuracy (e.g., 82.1% for all models combined) may not transfer to the negative sample, which has a different class distribution and feature characteristics. Since the noise correction changes 347 labels (Table IX), the validity of this estimate directly affects the reliability of the corrected dataset.
minor comments (7)
- [Abstract] The abstract says 'a Area Under Curve'; it should read 'an Area Under the Curve'.
- [Section IV.B] The sentiment neutrality condition is written as '−0.1 <= p <= −0.1'; it should be '−0.1 <= p <= 0.1'.
- [Table VI] The 'Org Size' column appears misaligned: the mean is 1.600 while the standard deviation is 414912 and the maximum is 22404, which is internally inconsistent; the column likely contains different statistics or a formatting error.
- [Table XII] The word 'Satcking' is a typo for 'Stacking' in two rows of the table.
- [Table XIII] The label 'T echnical' should be 'Technical'.
- [Section VII.C] The text says 'the feature importance returned by catboost' but then discusses XGBoost; please clarify which model's importances are presented in Table XV and Fig. 5.
- [References] Reference [44] (Confident Learning) lacks volume, issue, and page numbers.
Circularity Check
The 98% AUC is partially circular: 347 negative samples are relabeled as breaches by the same model families and features, then used as ground truth in the train/test evaluation.
-
fitted input called prediction
[Section V.C (Labels Correction) and Section VI.B (Training-Inference Process)]
"We use the six models combined to discover the corrupted labels in the negative sample, and flip their value to 'class 1'. [...] After preparing the data and selecting the predictive models, we split our dataset into a training set consisting of 70% of the whole dataset, and use the remaining 30% as a test set."
The 347 flipped labels are not independent ground truth: they are the outputs of a six-model ensemble (including CatBoost and XGBoost, the same families later evaluated) applied to the same feature matrix. Because the correction happens before the 70/30 split, these model-generated labels enter the test set and are scored as actual classes when computing the 98.43% AUC and the 12% social-feature gain. For each flipped example, the test label is a deterministic function of its features via the correction ensemble, so the final classifier's test performance partly measures agreement with the noise-correction model rather than with reported breach records. This makes a large share of the headline 'prediction' fitted by construction.
full rationale
The central derivation chain has one genuine circular step. Section V.C relabels 347 of 3016 non-victim organizations as breach victims using out-of-sample predictions from six models on the same socio-technical feature set, and Section VI.B then randomly splits this corrected dataset and reports XGBoost/CatBoost AUCs on it. Since the noise-correction ensemble contains the same model families and features that are later declared the predictors, a substantial fraction of the positive test labels are model outputs, not observed incidents; the reported 98.43% AUC is therefore in part a measure of self-consistency between two models trained on identical inputs, not of predictive validity against PRC/VCDB ground truth. This is a fitted-input-called-prediction circularity. Separately, the paper acknowledges in Section VIII that 'STRisk is trained on aggregated data over the considered period' while features and incidents both span January 2016 to September 2019 and the main evaluation uses a random split; that is a lookahead/leakage validity concern rather than a definitional circularity, and it does not affect the circularity score beyond reinforcing that the headline metric is not demonstrated to be predictive. No load-bearing self-citation was found: the self-citations ([9], [27], [52]) are background or interpretative and are not used to justify the core result. The paper also contains a small forecasting experiment (Section VII.B) using features measured before March-2020 through March-2021 incidents, which is temporally cleaner but reports only accuracy (42.85% at 3 months, 71.42% at 6 months) without AUC or intervals, so it cannot redeem the headline claim.
Assumptions & free parameters
free parameters (6)
- Label correction confidence threshold =
around 0.86; exact value not stated
- Noise matrix thresholds =
t_j=1 (Eq. 5) and 0.5 for confusion matrix
- Sentiment polarity cutoffs =
-0.5, -0.1, +0.1, +0.5
- Negative-to-positive sample ratio =
about 4x: 3016 negatives vs 795 positives
- Train/test split ratio =
70/30
- Model hyperparameters =
not reported
assumptions (5)
- domain assumption Reported breach records from PRC and VCDB are accurate and complete for the victim class.
- domain assumption Organizations in ARIN not appearing in breach reports are non-victims up to a correctable label-noise process.
- standard math Confident learning estimates of the noise transition matrix are valid on this data.
- domain assumption Twitter activity about an organization measures its social reputation and is predictively related to hacking risk.
- domain assumption External technical scans are correctly mapped to the right organizations.
Cite this review
Pith. "Pith review of STRisk: A Socio-Technical Approach to Assess Hacking Breaches Risk." pith.science (2026). https://pith.science/paper/EJ4WNNQF
@misc{pith2026241112435,
  author       = {Pith},
  title        = {Pith review of: STRisk: A Socio-Technical Approach to Assess Hacking Breaches Risk},
  year         = {2026},
  howpublished = {\url{https://pith.science/paper/EJ4WNNQF}},
  note         = {Machine review of arXiv:2411.12435}
}
read the original abstract
Data breaches have begun to take on new dimensions and their prediction is becoming of great importance to organizations. Prior work has addressed this issue mainly from a technical perspective and neglected other interfering aspects such as the social media dimension. To fill this gap, we propose STRisk which is a predictive system where we expand the scope of the prediction task by bringing into play the social media dimension. We study over 3800 US organizations including both victim and non-victim organizations. For each organization, we design a profile composed of a variety of externally measured technical indicators and social factors. In addition, to account for unreported incidents, we consider the non-victim sample to be noisy and propose a noise correction approach to correct mislabeled organizations. We then build several machine learning models to predict whether an organization is exposed to experience a hacking breach. By exploiting both technical and social features, we achieve a Area Under Curve (AUC) score exceeding 98%, which is 12% higher than the AUC achieved using only technical features. Furthermore, our feature importance analysis reveals that open ports and expired certificates are the best technical predictors, while spreadability and agreeability are the best social predictors.
Figures


Figures from the paper (2 more)

Reference graph
Works this paper leans on
-
[1]
Y ear end data breach quickview report,
R. B. Security, “Y ear end data breach quickview report,” 2019. [Online]. Available: https://pages.riskbasedsecurity.com/2019-year-end-data-breach-quickview-report
work page 2019
-
[2]
IBM, “Cost of a data breach study,” 2019. [Online]. Avail able: https://www.ibm.com/security/data-breach
work page 2019
-
[3]
Cloudy with a chance of breach: Forecasting cyber se curity incidents,
Y . Liu, A. Sarabi, J. Zhang, P . Naghizadeh, M. Karir, M. Ba iley, and M. Liu, “Cloudy with a chance of breach: Forecasting cyber se curity incidents,” in 24th {USENIX} Security Symp. ( {USENIX} Security 15) , 2015, pp. 1009–1024
work page 2015
-
[4]
Risky busin ess: Fine- grained data breach prediction using business profiles,
A. Sarabi, P . Naghizadeh, Y . Liu, and M. Liu, “Risky busin ess: Fine- grained data breach prediction using business profiles,” Journal of Cybersecurity, vol. 2, no. 1, pp. 15–28, 2016
work page 2016
-
[5]
Modelin g and predicting cyber hacking breaches,
M. Xu, K. M. Schweitzer, R. M. Bateman, and S. Xu, “Modelin g and predicting cyber hacking breaches,” IEEE Trans. Inf. F orensics Security, vol. 13, no. 11, pp. 2856–2871, 2018
work page 2018
-
[6]
Weakly s upervised extraction of computer security events from twitter,
A. Ritter, E. Wright, W. Casey, and T. Mitchell, “Weakly s upervised extraction of computer security events from twitter,” in Proc. of the 24th int. conf. on W orld Wide W eb , 2015, pp. 896–905
work page 2015
-
[7]
Discovering Signals from Web Sources to Predict Cyber Attacks
P . Goyal, K. Hossain, A. Deb, N. Tavabi, N. Bartley, A. Abe liuk, E. Ferrara, and K. Lerman, “Discovering signals from web sou rces to predict cyber attacks,” arXiv preprint arXiv:1806.03342 , 2018
work page Pith review arXiv 2018
-
[8]
Data breach investigations report,
V erizon, “Data breach investigations report,” 2019. [O nline]. Available: https://enterprise.verizon.com/resources/reports/dbir/
work page 2019
Show all 58 references
-
[9]
Digging deeper into data breaches: An exploratory data ana lysis of hacking breaches over time,
H. Hammouchi, O. Cherqi, G. Mezzour, M. Ghogho, and M. El K outbi, “Digging deeper into data breaches: An exploratory data ana lysis of hacking breaches over time,” Procedia Computer Science , vol. 151, pp. 1004–1009, 2019
2019
-
[10]
Twitter mood predicts th e stock market,
J. Bollen, H. Mao, and X. Zeng, “Twitter mood predicts th e stock market,” Journal of computational science , vol. 2, no. 1, pp. 1–8, 2011
2011
-
[11]
Analysis of political discourse on twitter in the context of the 2016 us presidenti al elections,
U. Y aqub, S. A. Chun, V . Atluri, and J. V aidya, “Analysis of political discourse on twitter in the context of the 2016 us presidenti al elections,” Government Information Quarterly , vol. 34, no. 4, pp. 613–626, 2017
2016
-
[12]
Social sentiment sensor in twitter for pred icting cyber-attacks using l1 regularization,
A. Hernandez-Suarez, G. Sanchez-Perez, K. Toscano-Me dina, V . Martinez-Hernandez, H. Perez-Meana, J. Olivares-Merca do, and V . Sanchez, “Social sentiment sensor in twitter for pred icting cyber-attacks using l1 regularization,” Sensors, vol. 18, no. 5, p. 1380, 2018
2018
-
[13]
Riskteller: Predi cting the risk of cyber incidents,
L. Bilge, Y . Han, and M. Dell’Amico, “Riskteller: Predi cting the risk of cyber incidents,” in Proc. of the 2017 ACM SIGSAC conf. on Computer and Communications Security , 2017, pp. 1299–1311
2017
-
[14]
Risky business: Assessing security with external measurements,
B. Edwards, J. Jacobs, and S. Forrest, “Risky business: Assessing security with external measurements,” arXiv preprint arXiv:1904.11052, 2019
1904 arXiv
-
[15]
Hype and heavy t ails: A closer look at data breaches,
B. Edwards, S. Hofmeyr, and S. Forrest, “Hype and heavy t ails: A closer look at data breaches,” Journal of Cybersecurity, vol. 2, no. 1, pp. 3–14, 2016
2016
-
[16]
Estimating the contextual risk of d ata breach: An empirical approach,
R. Sen and S. Borle, “Estimating the contextual risk of d ata breach: An empirical approach,” Journal of Management Information Systems , vol. 32, no. 2, pp. 314–341, 2015
2015
-
[17]
The role of corporate r eputation and crisis response strategies in data breach management,
K. L. Gwebu, J. Wang, and L. Wang, “The role of corporate r eputation and crisis response strategies in data breach management,” Journal of Management Information Systems , vol. 35, no. 2, pp. 683–714, 2018
2018
-
[18]
Examining the costs and causes of cyber i ncidents,
S. Romanosky, “Examining the costs and causes of cyber i ncidents,” Journal of Cybersecurity , vol. 2, no. 2, pp. 121–135, 2016
2016
-
[19]
Do data breac h disclosure laws reduce identity theft?
S. Romanosky, R. Telang, and A. Acquisti, “Do data breac h disclosure laws reduce identity theft?” Journal of Policy Analysis and Management, vol. 30, no. 2, pp. 256–286, 2011
2011
-
[20]
Modeling the risk of data bre ach incidents at the firm level,
K. Ikegami and H. Kikuchi, “Modeling the risk of data bre ach incidents at the firm level,” in International Conference on Innovative Mobile and Internet Services in Ubiquitous Computing . Springer, 2020, pp. 135–148
2020
-
[21]
Crowdsourcing cybersecurity: Cyber attack detection usi ng social me- dia,
R. P . Khandpur, T. Ji, S. Jan, G. Wang, C.-T. Lu, and N. Ram akrishnan, “Crowdsourcing cybersecurity: Cyber attack detection usi ng social me- dia,” in Proc. of the 2017 ACM on conf. on Information and Knowledge Management, 2017, pp. 1049–1057
2017
-
[22]
Understanding cyber attack behaviors with sentiment information on social media,
K. Shu, A. Sliva, J. Sampson, and H. Liu, “Understanding cyber attack behaviors with sentiment information on social media,” in Int. Conf. on Social Computing, Behavioral-Cultural Modeling and Predi ction and Behavior Representation in Modeling and Simulation . Springer, 2018,...
2018
-
[23]
Vulnerability disclosure in the age of social media: exploiting twitter for predicting real -world exploits,
C. Sabottke, O. Suciu, and T. Dumitras , , “Vulnerability disclosure in the age of social media: exploiting twitter for predicting real -world exploits,” in 24th {USENIX} Security Symp. ( {USENIX} Security 15) , 2015, pp. 1041–1056
2015
-
[24]
Predicting enterprise cyber incidents using social network analysis o n dark web hacker forums,
S. Sarkar, M. Almukaynizi, J. Shakarian, and P . Shakari an, “Predicting enterprise cyber incidents using social network analysis o n dark web hacker forums,” The Cyber Defense Review , pp. 87–102, 2019
2019
-
[25]
Mentions of security vulnerabilities on reddit, twitter and github,
S. Horawalavithana, A. Bhattacharjee, R. Liu, N. Choud hury, L. O. Hall, and A. Iamnitchi, “Mentions of security vulnerabilities on reddit, twitter and github,” in IEEE/WIC/ACM Int. Conf. on W eb Intelligence , 2019, pp. 200–207
2019
-
[26]
Foreca sting cyberattacks with incomplete, imbalanced, and insignifica nt data,
A. Okutan, G. Werner, S. J. Y ang, and K. McConky, “Foreca sting cyberattacks with incomplete, imbalanced, and insignifica nt data,” Cy- bersecurity, vol. 1, no. 1, p. 15, 2018
2018
-
[27]
P redicting probing rate severity by leveraging twitter sentiments,
H. Hammouchi, G. Mezzour, M. Ghogho, and M. El Koutbi, “P redicting probing rate severity by leveraging twitter sentiments,” i n 2019 15th Int. Wireless Communications & Mobile Computing conf. (IWCMC) . IEEE, 2019, pp. 883–888
2019
-
[28]
Predicting cyber threats through the dynamics of user conn ectivity in darkweb and deepweb forums,
M. Almukaynizi, A. Grimm, E. Nunes, J. Shakarian, and P . Shakarian, “Predicting cyber threats through the dynamics of user conn ectivity in darkweb and deepweb forums,” ACM Computational Social Science , 2017
2017
-
[29]
Privacy rights clearinghouse,
PRC, “Privacy rights clearinghouse,” https://privacyrights.org/data-breaches
-
[30]
V eris community database,
V . RISK, “V eris community database,” http://veriscom munity.net/
-
[31]
North america internet registry,
ARIN, “North america internet registry,” https://www .arin.net/
-
[32]
Africa internet registry,
AFRINIC, “Africa internet registry,” https://www.af rinic.net
-
[33]
Asia internet registry,
APNIC, “Asia internet registry,” https://www.apnic. net
-
[34]
Latin america internet registry,
LACNIC, “Latin america internet registry,” https://w ww.lacnic.net
-
[35]
Europe internet registry,
R. NCC, “Europe internet registry,” https://www.ripe .net
-
[36]
[Online]
Rapid7. [Online]. Available: https://opendata.rapi d7.com/sonar.tcp/
-
[37]
Firehol ip lists,
FireHOL, “Firehol ip lists,” http://iplists.firehol. org
-
[38]
Spam domain blacklist,
jwSpamSpy, “Spam domain blacklist,” https://www.joewein.de/sw/blacklist.htm
-
[39]
[Online]
Crunchbase. [Online]. Available: https://www.crunc hbase.com/
-
[40]
twitterscraper
A. Taspinar, “twitterscraper.” [Online]. Available: https://github.com/taspinar/twitterscraper
-
[41]
A sentim ent polarity categorization technique for online product reviews,
S. Kausar, X. Huahu, M. Y . Shabir, and W. Ahmad, “A sentim ent polarity categorization technique for online product reviews,” IEEE Access, 2019
2019
-
[42]
Learning with noisy labels
N. Natarajan, I. S. Dhillon, P . Ravikumar, and A. Tewari , “Learning with noisy labels.” in NIPS, vol. 26, 2013, pp. 1196–1204
2013
-
[43]
Learning classifiers from only pos itive and unlabeled data,
C. Elkan and K. Noto, “Learning classifiers from only pos itive and unlabeled data,” in Proc. of the 14th ACM SIGKDD int. conf. on Knowledge discovery and data mining , 2008, pp. 213–220
2008
-
[44]
Confident le arning: Es- timating uncertainty in dataset labels,
C. G. Northcutt, L. Jiang, and I. L. Chuang, “Confident le arning: Es- timating uncertainty in dataset labels,” Journal of Artificial Intelligence Research, 2021. 14
2021
-
[45]
Catboost: unbiased boosting with categorical features,
L. Prokhorenkova, G. Gusev, A. V orobev, A. V . Dorogush, and A. Gulin, “Catboost: unbiased boosting with categorical features,” in Advances in neural information processing systems , 2018, pp. 6638–6648
2018
-
[46]
Lightgbm: A highly efficient gradient boosting deci sion tree,
G. Ke, Q. Meng, T. Finley, T. Wang, W. Chen, W. Ma, Q. Y e, an d T.- Y . Liu, “Lightgbm: A highly efficient gradient boosting deci sion tree,” in Advances in neural information processing systems , 2017, pp. 3146– 3154
2017
-
[47]
Xgboost: A scalable tree boost ing system,
T. Chen and C. Guestrin, “Xgboost: A scalable tree boost ing system,” in Proc. of the 22nd acm sigkdd int. conf. on knowledge discover y and data mining , 2016, pp. 785–794
2016
-
[48]
Scikit-learn: Machine learning in Python,
F. Pedregosa, G. V aroquaux, A. Gramfort, V . Michel, B. T hirion, O. Grisel, M. Blondel, P . Prettenhofer, R. Weiss, V . Dubourg, J. V ander- plas, A. Passos, D. Cournapeau, M. Brucher, M. Perrot, and E. Duch- esnay, “Scikit-learn: Machine learning in Python,” Journal of Mach...
2011
-
[49]
Tabnet: Attentive interpreta ble tabular learning,
S. O. Arik and T. Pfister, “Tabnet: Attentive interpreta ble tabular learning,” Proceedings of the AAAI Conference on Artificial Intelligen ce, vol. 35, no. 8, pp. 6679–6687, May 2021. [Online]. Available : https://ojs.aaai.org/index.php/AAAI/article/view/16826
2021
-
[50]
A unified approach to inter preting model predictions,
S. M. Lundberg and S.-I. Lee, “A unified approach to inter preting model predictions,” in Proceedings of the 31st international conference on neural information processing systems , 2017, pp. 4768–4777
2017
-
[51]
Fr om local explanations to global understanding with explainab le ai for trees,
S. M. Lundberg, G. Erion, H. Chen, A. DeGrave, J. M. Prutk in, B. Nair, R. Katz, J. Himmelfarb, N. Bansal, and S.-I. Lee, “Fr om local explanations to global understanding with explainab le ai for trees,” Nature Machine Intelligence , vol. 2, no. 1, pp. 2522–5839, 2020
2020
-
[52]
Global varia tion in attack encounters and hosting,
G. Mezzour, K. M. Carley, and L. R. Carley, “Global varia tion in attack encounters and hosting,” in Proc. of the Hot Topics in Science of Security: Symp. and Bootcamp , 2017, pp. 62–73
2017
-
[53]
Compliance, identification, and interna lization three processes of attitude change,
H. C. Kelman, “Compliance, identification, and interna lization three processes of attitude change,” Journal of conflict resolution , vol. 2, no. 1, pp. 51–60, 1958
1958
-
[54]
Social cyber- security,
K. M. Carley, G. Cervone, N. Agarwal, and H. Liu, “Social cyber- security,” in Int. Conf. on Social Computing, Behavioral-Cultural Mod- eling and Prediction and Behavior Representation in Modeli ng and Simulation. Springer, 2018, pp. 389–394
2018
-
[55]
Beyond simple human threats to cybersecurit y: the need for strong proactive measures and resilient responses to cyber risk,
M. Hills, “Beyond simple human threats to cybersecurit y: the need for strong proactive measures and resilient responses to cyber risk,” Cyber Security Review, no. 2015, pp. 26–30, 2015
2015
-
[56]
Sok: Quantifying cyber risk,
D. W. Woods and R. Bohme, “Sok: Quantifying cyber risk,” in IEEE Symposium on Security and Privacy (SP) . Los Alamitos, CA, USA: IEEE Computer Society, may 2021, pp. 211–228
2021
-
[57]
The spread of low-credibility content by socia l bots,
C. Shao, G. L. Ciampaglia, O. V arol, K.-C. Y ang, A. Flamm ini, and F. Menczer, “The spread of low-credibility content by socia l bots,” Nature communications, vol. 9, no. 1, pp. 1–9, 2018
2018
-
[58]
Is this the era of mis information yet: combining social bots and fake news to deceive the masse s,
P . Wang, R. Angarita, and I. Renna, “Is this the era of mis information yet: combining social bots and fake news to deceive the masse s,” in Companion Proc. of the The W eb conf. 2018 , 2018, pp. 1557–1561
2018
Reviewed August 12, 2026 · model on record in the stance chip above.
Discussion (0). Continue with ORCID to comment.