REVIEW 3 major objections 6 minor 31 references
A combinatorial Bayesian optimizer selects wavelength regions that are more reproducible and locally stable than genetic-algorithm or simulated-annealing selection for sugar-content prediction.
Reviewed by Pith at T0; open to challenge. T0 means a machine referee read the full paper against a public rubric. the ladder, T0–T4 →
T0 review · deepseek-v4-flash
2026-08-01 04:07 UTC pith:EKGFTWLX
load-bearing objection Competent BOCS-for-wavelength-selection paper with an honest limitations section, but every headline number is in-sample — gets a serious referee, not a desk reject. the 3 major comments →
Robust Wavelength Selection for Partial Least Squares Sugar Content Estimation Using Combinatorial Bayesian Optimization
The pith
A machine-rendered reading of the paper's core claim, the machinery that carries it, and where it could break.
Core claim
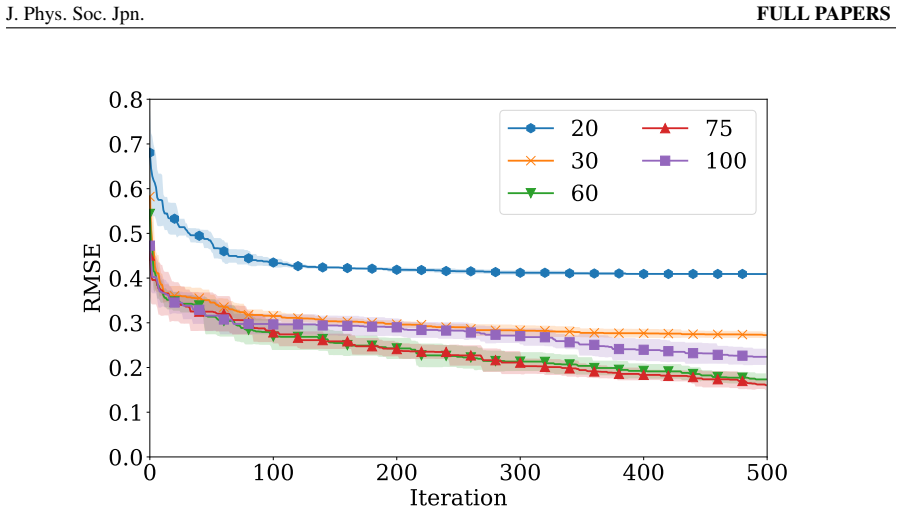
The central claim is that Bayesian optimization with a sparse quadratic surrogate finds wavelength subsets that lie in broad, flat basins of the prediction-error landscape rather than isolated overfitted minima. Quantitatively, repeated runs give a mean Hamming distance of 19.2±0.4 between selected subsets, versus 25.6±0.5 for GA and 27.1±0.5 for SA, and a mean RMSE increase under one-bit removal of 0.044±0.003, versus 0.147±0.005 and 0.219±0.007. The few bands whose removal does hurt coincide with bands that are consistently selected across runs. The paper interprets this as convergence to smoother regions of the error landscape, and reports that the objective value after 500 iterations imp
What carries the argument
The machinery is a quadratic surrogate model, f(x)=α0+Σαi xi+Σαij xi xj, with a horseshoe prior on the coefficients that shrinks most terms to zero while letting a few one-body and two-body terms stay large. At each iteration the model's coefficients are sampled from the posterior via Gibbs sampling, and Thompson sampling proposes the next selection vector by minimizing the sampled surrogate. Because the surrogate is quadratic in binary variables, that minimization is a QUBO problem, solvable by simulated annealing or by quantum annealing on Ising hardware. The expensive PLS cross-validation objective is evaluated only once per proposed vector, which is what makes the search sample-efficient
Load-bearing premise
The whole comparison assumes that robustness and consistency measured on the same cross-validation folds used to pick wavelengths predict how the method will behave on genuinely new samples; because no independent test set is held out, the reported advantages could partly reflect tuning to the validation set.
What would settle it
Hold out a test set of plum spectra, select wavelengths using only the training folds, then measure RMSE and one-bit-removal sensitivity on the test set. If BOCS's selected regions show no better test RMSE, or if its one-bit-removal advantage disappears, compared with GA and SA, the robustness claim is refuted.
If this is right
- With BOCS, repeated runs select nearly the same spectral regions, so the bands can be handed to analysts as stable candidates for chemical interpretation rather than stochastic artifacts.
- Because one-bit removal barely changes prediction error, the chosen model is resilient to a noisy or failing spectrometer channel at the selected wavelength.
- The expensive PLS objective is evaluated only once per proposed subset, meaning the method reaches low RMSE with fewer objective evaluations than the GA baseline.
- Since the acquisition step is QUBO, the method is naturally compatible with quantum annealing hardware and should scale to finer wavelength resolution or denser pairwise interactions as annealers improve.
- The same surrogate-and-Thompson-sampling recipe transfers to any high-dimensional feature-selection task with an expensive black-box objective and a demand for reproducible subsets.
Where Pith is reading between the lines
- A direct extension would be to run the same comparison with a held-out test set that is never used in selection or in choosing n; the paper itself notes this is missing, and it would settle how much of the reported stability reflects genuine generalization.
- The coincidence of consistently selected bands with high-sensitivity removal bands suggests a practical protocol: use BOCS selection frequencies as a confidence map to propose wavelength bands for chemical assignment, then validate those bands spectroscopically.
- Because the surrogate is strictly quadratic, the method can only capture pairwise interactions among wavelength regions; for targets where higher-order spectral interactions matter, the flat-basin advantage may weaken, and a test on a different analyte would show how far the claim extends.
- The n=60 resolution was chosen after looking at prediction results across n; an automatic, data-driven resolution choice would make the method fully parameter-free and would test whether the consistency advantage persists at finer resolutions.
Editorial analysis
A structured set of objections, weighed in public.
Referee Report
Summary. The paper formulates wavelength-region selection for near-infrared PLS-based sugar content estimation as a binary black-box optimization problem, proposes a combinatorial Bayesian optimization method (BOCS) with a sparse quadratic surrogate regularized by a horseshoe prior, and uses Thompson sampling with the acquisition function solved by simulated or quantum annealing. Experiments on 40 plum NIR spectra compare BOCS to GA and SA in terms of cross-validated RMSE, run-to-run consistency (mean Hamming distance and per-bit Shannon entropy), and local robustness (mean RMSE increase under one-bit removal). The authors report that BOCS achieves lower and more consistent RMSE than GA and SA, with mean Hamming distance 19.2 vs 25.6/27.1 and mean ΔRMSE under one-bit removal 0.044 vs 0.147/0.219. The paper is clearly written and includes an explicit discussion of limitations, but its central empirical claim rests entirely on cross-validated metrics computed on the same folds used for selection.
Significance. If substantiated with proper out-of-sample evaluation, the work would be a useful application of combinatorial Bayesian optimization to spectral feature selection, and the proposed consistency and local-robustness metrics are a practical addition to the wavelength-selection literature. The formulation is clear, the dataset is publicly referenced, and the authors are candid about the need for nested validation. However, the headline generalization claim is not yet established: all key numbers (Table I, Figs. 2–4) come from the same K-fold cross-validation objective L(x) (Eq. 3) that is optimized, and the resolution n=60 was selected after inspecting prediction results. The paper's strengths—careful algorithmic description, explicit evaluation metrics, and honest discussion—are offset by this selection-bias issue and by missing experimental hyperparameters.
major comments (3)
- [§4.1, §4.2, §5] All accuracy and robustness claims (Table I, Figs. 2–4) are computed on the same K-fold cross-validation objective L(x) (Eq. 3) that the selection procedures optimize, and the resolution n=60 was chosen after inspecting prediction results for n∈{20,30,40,60,75,100} (§4.1). The paper acknowledges in Sec. 5 that a more reliable estimate may require nested validation with an independent test set. Because the abstract's claim is a generalization claim, this selection bias is load-bearing. The reported RMSEs are minima over a search on a fixed validation split and are optimistically biased; the local-robustness improvement under one-bit removal is likewise a property of L(x) on those same folds. An independent test set or a nested CV protocol is required to substantiate the claimed advantage.
- [§3.2.3, Algorithm 2] The number of folds K in L(x) and the initial dataset size t0 in Algorithm 2 are never specified. With N=40 spectra, K determines the fold size and the variance of the cross-validated estimate, and t0 controls the amount of data used to fit the initial surrogate. Both are necessary to assess the magnitude of selection bias and to reproduce the experiments. Please report these values and include a sensitivity analysis (e.g., K=5 vs K=10).
- [§4.2] The sample-efficiency comparison is confounded. The text says the GA requires 60 objective evaluations per iteration while BOCS uses one, but the SA baseline also uses 60 evaluations per iteration; the 'SA_1flip' variant uses one evaluation and, according to the text, reaches the same validation loss as BOCS-SA after 200 iterations. Thus the claim of 'fewer objective evaluations' holds only against the GA baseline, not against SA. The advantage over SA lies only in reproducibility and local robustness, and this should be stated explicitly to avoid overclaiming.
minor comments (6)
- [Eq. (1)] The displayed formula for R_i(r,x) is not typeset correctly in the manuscript; the inner norm appears broken. Please fix the equation.
- [§3.3, Table I] The per-bit Shannon entropy is said to be normalized to [0,1], but the table header reads 'Shannon entropy/# bits', which is ambiguous. Clarify the normalization and the maximum value used.
- [§3.3] The number of repeated runs R used to compute mean Hamming distance and entropy is not stated. Please report R.
- [Fig. 4 caption] Typo: 'consisitent' should be 'consistent'.
- [§3.2.3] 'advantage system4.1' should be 'Advantage system 4.1'.
- [§4.2] The total number of BOCS iterations T and the number of independent trials are not explicitly stated; please include these to aid reproducibility.
Circularity Check
No circularity: the paper is an empirical application of a known Bayesian-optimization method, and the acknowledged validation limitations are statistical rather than derivational.
full rationale
The paper does not derive its conclusions from its inputs by construction. It applies an existing method, BOCS (external reference 7), to a wavelength-selection problem, with an objective L(x) (Eq. 3) that is the cross-validated PLS RMSE used uniformly by BOCS, GA, and SA. The reported consistency metrics (Hamming distance and Shannon entropy) and one-bit-removal robustness are post-hoc measurements on selected subsets, not algebraic identities with the fitted objective, and the horseshoe-prior surrogate is an external statistical model, not an ansatz imported from the authors' prior work. The QA-related self-citations (refs 9–22) are background examples and are not load-bearing; the paper explicitly reports no clear difference between SA and QA within BOCS. The manuscript's own Sec. 5 caveat — 'a more reliable estimate of the generalization performance may require nested validation with an independent test set, which may also clarify the extent of any selection bias in the reported errors' — and the choice of n=60 after inspecting prediction results are genuine limitations concerning external validity and selection bias, but they do not make the claimed comparisons circular: all methods are evaluated on the same objective and the reported improvements are benchmark outcomes, not derived predictions. Hence no circular step is present.
Axiom & Free-Parameter Ledger
free parameters (4)
- Number of wavelength regions n =
60
- Maximum PLS components mx =
min(||x||0, 35)
- Number of cross-validation folds K =
not specified
- Initial dataset size t0 for BOCS =
not specified
axioms (6)
- domain assumption PLS regression with cross-validation is an appropriate objective for sugar content prediction.
- domain assumption The 40 plum spectra are representative and the public dataset is reliable.
- domain assumption Averaging wavelength intensities into n contiguous regions preserves the information needed for prediction.
- standard math The horseshoe-prior Gibbs sampler converges and provides valid posterior samples in this underdetermined setting.
- ad hoc to paper A sparse quadratic surrogate captures the relevant structure of the PLS wavelength-selection objective.
- ad hoc to paper Local stability under one-bit perturbations indicates a 'smoother error landscape' and better generalization.
invented entities (1)
-
None
no independent evidence
read the original abstract
Wavelength selection is one of the important preprocessing methods in near-infrared spectroscopy to improve prediction accuracy and interpretability of spectral data. We formulate wavelength-region selection for sugar content estimation as a binary black-box optimization problem and propose a method based on Bayesian optimization. The proposed method constructs a sparse quadratic surrogate model and sequentially extracts interested wavelength regions by Thompson sampling. Minimizing an acquisition function is performed as a quadratic unconstrained binary optimization problem by simulated or quantum annealing. Experiments show that the proposed method improves the prediction accuracy of partial least squares regression and yields more consistent wavelength regions than genetic-algorithm-based selection and simulated annealing. Under one-bit local perturbations, the selected wavelength regions show minimal fluctuations in root mean square errors between observed and predicted values of a validation set. This local stability suggests that our method converges to a smoother error landscape and avoids isolated overfitted solutions. These results indicate that combinatorial Bayesian optimization is a useful framework for robust feature selection in spectroscopic prediction tasks.
Figures


Reference graph
Works this paper leans on
-
[1]
J. A. Guthrie, C. J. Liebenberg, and K. B. Walsh, Aust. J. Agric. Res.57, 411 (2006)
2006
-
[2]
Koguchi, Y
H. Koguchi, Y . Sankai, K. Hanzawa, T. Jikuya, T. Tsutsui, and Y . Sakakibara, Proc. Second Jt. 24th Annu. Conf. Eng. Med. Biol. Soc. Annu. Fall Meet. Biomed. Eng. Soc., Houston, TX, 2002, V ol. 3, p. 1807
2002
-
[3]
K. B. Be ´c, J. Grabska, and C. W. Huck, Trends Anal. Chem.189, 118254 (2025)
2025
-
[4]
W. Ni, L. Nørgaard, and M. Mørup, Anal. Chim. Acta813, 1 (2014)
2014
-
[5]
Kawamura, M
S. Kawamura, M. Arakawa, and K. Funatsu, J. Comput. Aided Chem.7, 10 (2006) [in Japanese]
2006
-
[6]
Kirkpatrick, C
S. Kirkpatrick, C. D. Gelatt, and M. P. Vecchi, Science220, 671 (1983)
1983
-
[7]
Baptista and M
R. Baptista and M. Poloczek, inProc. 35th Int. Conf. Mach. Learn., ed. J. Dy and A. Krause, (2018) V ol. 80, p. 462
2018
-
[8]
Kadowaki and H
T. Kadowaki and H. Nishimori, Phys. Rev. E58, 5355 (1998)
1998
-
[9]
Tanaka, M
T. Tanaka, M. Sako, M. Chiba, C. Lee, H. Cha, and M. Ohzeki, J. Phys. Soc. Jpn.92, 023001 (2023)
2023
-
[10]
M. Doi, Y . Nakao, T. Tanaka, M. Sako, and M. Ohzeki, Front. Comput. Sci.5, 1286226 (2023)
2023
-
[11]
Rosenberg, P
G. Rosenberg, P. Haghnegahdar, P. Goddard, P. Carr, K. Wu, and M. L. De Prado, IEEE J. Sel. Top. Signal Process.10, 1053 (2016)
2016
-
[12]
Venturelli and A
D. Venturelli and A. Kondratyev, Quantum Mach. Intell.1, 17 (2019)
2019
-
[13]
Or ´us, S
R. Or ´us, S. Mugel, and E. Lizaso, Phys. Rev. A99, 060301 (2019)
2019
-
[14]
Mugel, C
S. Mugel, C. Kuchkovsky, E. S ´anchez, S. Fern ´andez-Lorenzo, J. Luis-Hita, E. Lizaso, and R. Or´us, Phys. Rev. Res.4, 013006 (2022)
2022
-
[15]
Neukart, G
F. Neukart, G. Compostella, C. Seidel, D. V on Dollen, S. Yarkoni, and B. Parney, Front. ICT4, 29 (2017)
2017
-
[16]
Shikanai, M
R. Shikanai, M. Ohzeki, and K. Tanaka, J. Phys. Soc. Jpn.94, 024001 (2025)
2025
-
[17]
S. Feld, C. Roch, T. Gabor, C. Seidel, F. Neukart, I. Galter, W. Mauerer, and C. Linnhoff- Popien, Front. ICT6, 13 (2019)
2019
- [18]
-
[19]
Ohzeki, A
M. Ohzeki, A. Miki, M. J. Miyama, and M. Terabe, Front. Comput. Sci.1(2019). 18/19 J. Phys. Soc. Jpn.FULL PAPERS
2019
-
[20]
R. Haba, M. Ohzeki, and K. Tanaka, Sci. Rep.12, 17753 (2022)
2022
-
[21]
Yonaga, M
K. Yonaga, M. Miyama, M. Ohzeki, K. Hirano, H. Kobayashi, and T. Kurokawa, ISIJ Int.62, 1874 (2022)
2022
-
[22]
Nishimura, K
N. Nishimura, K. Tanahashi, K. Suganuma, M. J. Miyama, and M. Ohzeki, Front. Com- put. Sci.1, 2 (2019)
2019
-
[23]
C. M. Carvalho, N. G. Polson, and J. G. Scott, Biometrika97, 465 (2010)
2010
-
[24]
Makalic and D
E. Makalic and D. F. Schmidt, IEEE Signal Process. Lett.23, 179 (2016)
2016
-
[25]
Bhattacharya, A
A. Bhattacharya, A. Chakraborty, and B. K. Mallick, Biometrika103, 985 (2016)
2016
- [26]
- [27]
-
[28]
Pelliccia,https://github.com/nevernervous78/ nirpyresearch/blob/master/data/NIRplums_brix_firmness.csv
NIRplums brix firmness, D. Pelliccia,https://github.com/nevernervous78/ nirpyresearch/blob/master/data/NIRplums_brix_firmness.csv
-
[29]
Savitzky and M
A. Savitzky and M. J. E. Golay, Anal. Chem.36, 1627 (1964)
1964
-
[30]
McGeoch and Pau Farr ´e, D-Wave Technical Report Series 14-1054A-A (2021)
C. McGeoch and Pau Farr ´e, D-Wave Technical Report Series 14-1054A-A (2021)
2021
- [31]
discussion (0)
Sign in with ORCID, Apple, or X to comment. Anyone can read and Pith papers without signing in.