Integrating national forest inventory, airborne lidar, and satellite imagery for wall-to-wall mapping of forest structure with computer vision
Pith reviewed 2026-06-26 17:54 UTC · model grok-4.3
The pith
A satellite model trained on lidar samples from inventory plots maps US forest attributes at 10m resolution across sparse to dense conditions.
A machine-rendered reading of the paper's core claim, the machinery that carries it, and where it could break.
Core claim
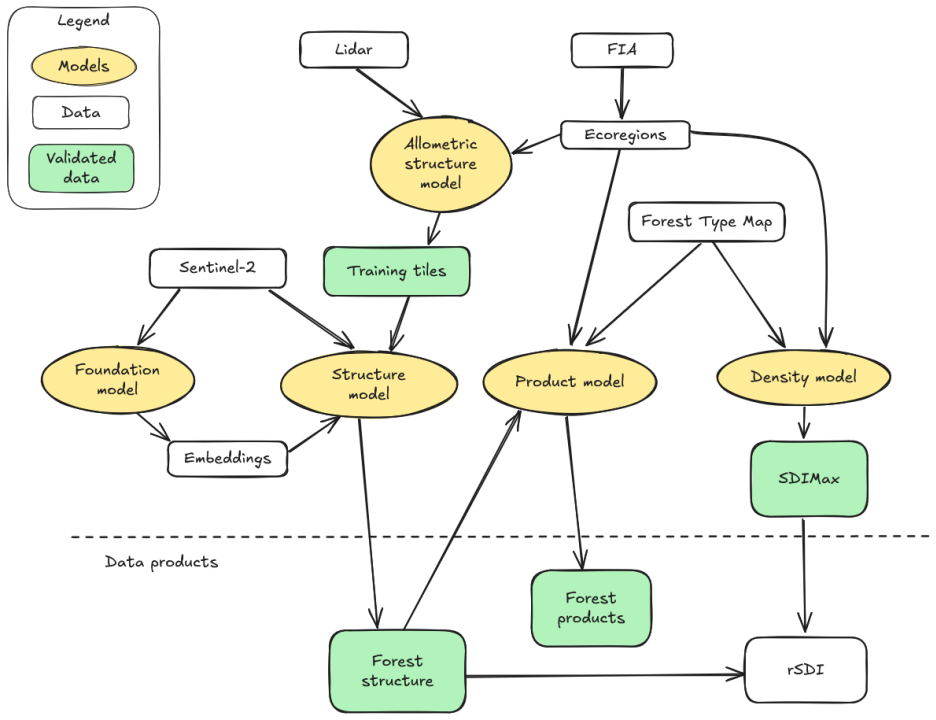
The VibrantForests framework applies a satellite-based model trained on lidar-derived samples from national forest inventory plots to generate concurrent wall-to-wall estimates of canopy cover, canopy height, aboveground live tree biomass, basal area, and quadratic mean diameter at 10-meter resolution across the contiguous United States. This produces predictive capability spanning the full spectrum of forest conditions from sparse-canopy low-biomass to dense-canopy high-biomass, extending the saturation range of comparable passive-sensor models and reducing regression-to-mean behavior that overestimates attributes in small or sparse conditions and underestimates them in large or dense condi
What carries the argument
The VibrantForests satellite-based forest structure model trained on lidar-derived samples from national forest inventory plots and applied via computer vision to map multiple attributes concurrently.
If this is right
- Produces annually updated, coherent 10m maps usable as a single foundation for forest and wildfire planning systems.
- Reduces confounding behavior in operational planning that arises from combining data sources of different vintages and accuracies.
- Delivers management-relevant attributes across the full observed range of forest conditions rather than saturating early.
- Supports wall-to-wall coverage at national scale while maintaining resolution fine enough for local decisions.
Where Pith is reading between the lines
- The same lidar-plus-satellite training pattern could be replicated in countries that maintain comparable national forest inventory programs to generate equivalent maps.
- The 10m outputs might allow wildfire risk models to incorporate finer-scale canopy and biomass variation than products at 30m or coarser resolution.
- Annual cadence updates could enable direct tracking of changes from fire, harvest, or growth without needing separate change-detection layers.
Load-bearing premise
Lidar-derived samples from national forest inventory plots are accurate and representative enough to train a model that generalizes across all contiguous US forest conditions without systematic bias.
What would settle it
Independent field measurements collected in forest conditions or regions underrepresented in the national forest inventory plots that show consistent over- or under-prediction relative to the model's 10m outputs.
Figures
read the original abstract
Remote sensing is increasingly relied upon to deliver actionable science for forest and wildfire risk management across large landscapes. Wall-to-wall, annually updated maps are a persistent need for effective forest management. Many planning systems and data collections combine disparate data sources with different purposes, vintages, and prediction quality, which leads to confounding behavior in operational planning systems. We introduce the VibrantForests framework, developed and applied to map forest attributes and provide a coherent foundation for effective forest and wildfire planning. VibrantForests includes a satellite-based forest structure model trained on lidar-derived samples and applied across the contiguous United States to concurrently generate estimates of canopy cover, canopy height, aboveground live tree biomass, basal area, and quadratic mean diameter at 10-meter resolution. We demonstrate predictive capability spanning the full spectrum of forest conditions ranging from sparse-canopy/low-biomass to dense-canopy/high-biomass. Results show that our model extends the range at which saturation is commonly encountered in comparable passive-sensor models, and reduces regression-to-mean behavior that commonly produces overestimation of forest attributes in small/sparse conditions and underestimation in large/dense conditions. The VibrantForests framework addresses a key limitation in large-area forest and wildfire planning by delivering coherent wall-to-wall estimates of management-relevant attributes at annual cadence and 10m resolution.
Editorial analysis
A structured set of objections, weighed in public.
Referee Report
Summary. The paper introduces the VibrantForests framework for mapping forest attributes (canopy cover, canopy height, aboveground live tree biomass, basal area, and quadratic mean diameter) at 10-meter resolution across the contiguous United States using a satellite-based model trained on lidar-derived samples from national forest inventory plots. It claims to demonstrate predictive capability across the full spectrum of forest conditions from sparse to dense, extending the saturation range and reducing regression-to-mean behavior compared to other passive-sensor models.
Significance. If substantiated, this work would provide coherent, wall-to-wall, annually updated estimates for forest and wildfire management, addressing confounding from disparate data sources. The training on external lidar data is a positive for avoiding circularity, and the focus on reducing common biases in forest attribute estimation is relevant for operational planning.
major comments (1)
- [Abstract] Abstract: The abstract asserts good performance across sparse-to-dense conditions and reduced saturation/regression-to-mean effects, but supplies no quantitative metrics, validation statistics, error bars, or details on training/validation splits. This makes it impossible to assess support for the central claim that the model extends the saturation range and reduces regression-to-mean behavior.
Simulated Author's Rebuttal
We thank the referee for their review and constructive feedback. We address the major comment on the abstract below and will make the requested revisions.
read point-by-point responses
-
Referee: [Abstract] Abstract: The abstract asserts good performance across sparse-to-dense conditions and reduced saturation/regression-to-mean effects, but supplies no quantitative metrics, validation statistics, error bars, or details on training/validation splits. This makes it impossible to assess support for the central claim that the model extends the saturation range and reduces regression-to-mean behavior.
Authors: We agree that the abstract would benefit from including quantitative support for the central claims. The full manuscript reports detailed validation statistics (including R², RMSE, and bias metrics stratified by forest condition, plus training/validation split details) in the Results and Methods sections. To make the abstract more self-contained, we will revise it to incorporate key quantitative metrics demonstrating performance across sparse-to-dense conditions, the extended saturation range relative to other passive-sensor models, and reduced regression-to-mean effects. revision: yes
Circularity Check
No significant circularity
full rationale
The paper trains a satellite-based model on lidar-derived labels from external national forest inventory plots and applies it to generate wall-to-wall maps. No equation or claim reduces by construction to its own inputs; the reported improvements in saturation range and regression-to-mean behavior are presented as empirical outcomes of training and validation rather than definitional or fitted-by-construction results. No self-citation chain is invoked as the sole justification for a uniqueness theorem or ansatz. The derivation chain is self-contained against external benchmarks.
Axiom & Free-Parameter Ledger
Reference graph
Works this paper leans on
-
[1]
Christopher B. Anderson, Maxwell B. Joseph, Camile Söthe, Flávia de Souza Mendes, Thomas Maschler, Ryan C. McCarthy, Joseph Mascaro, Tara O’Shea, Amy Rosenthal, and David C. Marvin. Forest Carbon Diligence: Digital MRV for mapping forest structure and carbon stocks.Forest Ecology and Management, 612:123709, July 2026. ISSN 0378-1127. doi: 10.1016/j.foreco...
-
[2]
Jamie Tolan, Hung-I Yang, Benjamin Nosarzewski, Guillaume Couairon, Huy V. Vo, John Brandt, JustineSpore, SayantanMajumdar, DanielHaziza, JanakiVamaraju, TheoMoutakanni, Piotr Bojanowski, Tracy Johns, Brian White, Tobias Tiecke, and Camille Couprie. Very high resolution canopy height maps from RGB imagery using self-supervised vision transformer and convo...
-
[3]
Siyu Liu, Martin Brandt, Thomas Nord-Larsen, Jerome Chave, Florian Reiner, Nico Lang, Xiaoye Tong, Philippe Ciais, Christian Igel, Adrian Pascual, Juan Guerra-Hernandez, Sizhuo Li, Maurice Mugabowindekwe, Sassan Saatchi, Yuemin Yue, Zhengchao Chen, and Rasmus Fensholt. The overlooked contribution of trees outside forests to tree cover and woody biomass ac...
-
[4]
Above-Ground Biomass (AGB) Stock and Change Product
Chloris Geospatial. Above-Ground Biomass (AGB) Stock and Change Product. Data Specifi- cations, Chloris Geospatial, Boston, MA, 2026. URLhttps://static1.squarespace.com/ static/65ae8dc337ea664cbf34181c/t/6981db51c8bb6f5126514640/1770117969479/Data+ specifications_Chloris+Geospatial_2026.pdf
2026
-
[5]
Hugh Safford, Colton Miller, Danielle Perrot, Sophie Gilbert, Tyler Hoecker, Michael Koontz, Kailey Kornhauser, Matt Thompson, Joe Shannon, Nathan Rutenbeck, Joe Scott, Scott Conway, and Katharyn Duffy. A collaborative, cloud-based decision support system for structured wildfire risk mitigation planning.Ecological Modelling, 514:111464, April 2026. ISSN 0...
-
[6]
Matthew G. Rollins. LANDFIRE: a nationally consistent vegetation, wildland fire, and fuel assessment.International Journal of Wildland Fire, 18(3):235–249, May 2009. ISSN 1049-8001, 1448-5516. doi: 10.1071/WF08088. URL https://connectsci.au/wf/article/18/3/235/ 23183/LANDFIRE-a-nationally-consistent-vegetation
-
[7]
Inga P. La Puma. LANDFIRE Technical Documentation. Open-File Report 2023-1045, U.S. Department of Interior, U.S. Geological Survey, Reston, VA, 2023. URLhttps://doi.org/10 .3133/ofr20231045
2023
-
[8]
Karin L. Riley, Isaac C. Grenfell, Mark A. Finney, and Jason M. Wiener. TreeMap, a tree- level model of conterminous US forests circa 2014 produced by imputation of FIA plot data. Scientific Data, 8(1):11, January 2021. ISSN 2052-4463. doi: 10.1038/s41597-020-00782-x. URLhttps://www.nature.com/articles/s41597-020-00782-x. Number: 1. 24
-
[9]
Crookston and Gary E
Nicholas L. Crookston and Gary E. Dixon. The Forest Vegetation Simulator: A review of its structure, content, and applications.Computers and Electronics in Agriculture, 49(1):60–80,
-
[10]
URL https://research.fs.usda.gov/treesearc h/28474
doi: 10.1016/j.compag.2005.02.003. URL https://research.fs.usda.gov/treesearc h/28474
-
[11]
Remote Sensing of Environment280, 113195 (2022) https://doi.org/10.1016/j.rse.2022.113195
Michael A. Wulder, David P. Roy, Volker C. Radeloff, Thomas R. Loveland, Martha C. Anderson, David M. Johnson, Sean Healey, Zhe Zhu, Theodore A. Scambos, Nima Pahlevan, Matthew Hansen, Noel Gorelick, Christopher J. Crawford, Jeffrey G. Masek, Txomin Hermosilla, Joanne C. White, Alan S. Belward, Crystal Schaaf, Curtis E. Woodcock, Justin L. Huntington, Leo...
-
[12]
Patterson, Wenlu Qi, and Carlos Silva
Ralph Dubayah, James Bryan Blair, Scott Goetz, Lola Fatoyinbo, Matthew Hansen, Sean Healey, Michelle Hofton, George Hurtt, James Kellner, Scott Luthcke, John Armston, Hao Tang, Laura Duncanson, Steven Hancock, Patrick Jantz, Suzanne Marselis, Paul L. Patterson, Wenlu Qi, and Carlos Silva. The Global Ecosystem Dynamics Investigation: High-resolution laser ...
-
[13]
doi: 10.1016/j.srs.2020.100002
ISSN 2666-0172. doi: 10.1016/j.srs.2020.100002. URLhttps://www.sciencedirect.co m/science/article/pii/S2666017220300018
-
[14]
Kennedy, Janet Ohmann, Matt Gregory, Heather Roberts, Zhiqiang Yang, David M
Robert E. Kennedy, Janet Ohmann, Matt Gregory, Heather Roberts, Zhiqiang Yang, David M. Bell, Van Kane, M. Joseph Hughes, Warren B. Cohen, Scott Powell, Neeti Neeti, Tara Larrue, Sam Hooper, Jonathan Kane, David L. Miller, James Perkins, Justin Braaten, and Rupert Seidl. An empirical, integrated forest biomass monitoring system.Environmental Research Lett...
-
[15]
Kellner, John Armston, Ralph Dubayah, David M
Laura Duncanson, James R. Kellner, John Armston, Ralph Dubayah, David M. Minor, Steven Hancock, Sean P. Healey, Paul L. Patterson, Svetlana Saarela, Suzanne Marselis, Carlos E. Silva, Jamis Bruening, Scott J. Goetz, Hao Tang, Michelle Hofton, Bryan Blair, Scott Luthcke, Lola Fatoyinbo, Katharine Abernethy, Alfonso Alonso, Hans-Erik Andersen, Paul Aplin, T...
-
[16]
Tony Chang, Kiarie Ndegwa, Andreas Gros, Vincent A. Landau, Luke J. Zachmann, Bogdan State, Mitchell A. Gritts, Colton W. Miller, Nathan E. Rutenbeck, Scott Conway, and Guy Bayes. VibrantVS: A High-Resolution Vision Transformer for Forest Canopy Height Estimation. Remote Sensing, 17(6):1017, January 2025. ISSN 2072-4292. doi: 10.3390/rs17061017. URL https...
-
[17]
Confronting the Wildfire Crisis: Initial Landscape Investments to Protect Communities and Improve Resilience in America’s Forests
USFS. Confronting the Wildfire Crisis: Initial Landscape Investments to Protect Communities and Improve Resilience in America’s Forests. Technical Report FS-1187d, U.S. Department of Agriculture, Forest Service, April 2022. URLhttps://www.fs.usda.gov/sites/default/fi les/fs_media/fs_document/WCS-Initial-Landscapes.pdf
2022
-
[18]
Andrew N. Gray, Thomas J. Brandeis, John D. Shaw, William H. McWilliams, and Patrick Miles. Forest Inventory and Analysis Database of the United States of America (FIA).In: Dengler, J.; Oldeland, J.; Jansen, F.; Chytry, M.; Ewald, J., Finckh, M.; Glockler, F.; Lopez- Gonzalez, G.; Peet, R. K.; Schaminee, J .H. J., eds. Vegetation databases for the 21st ce...
-
[19]
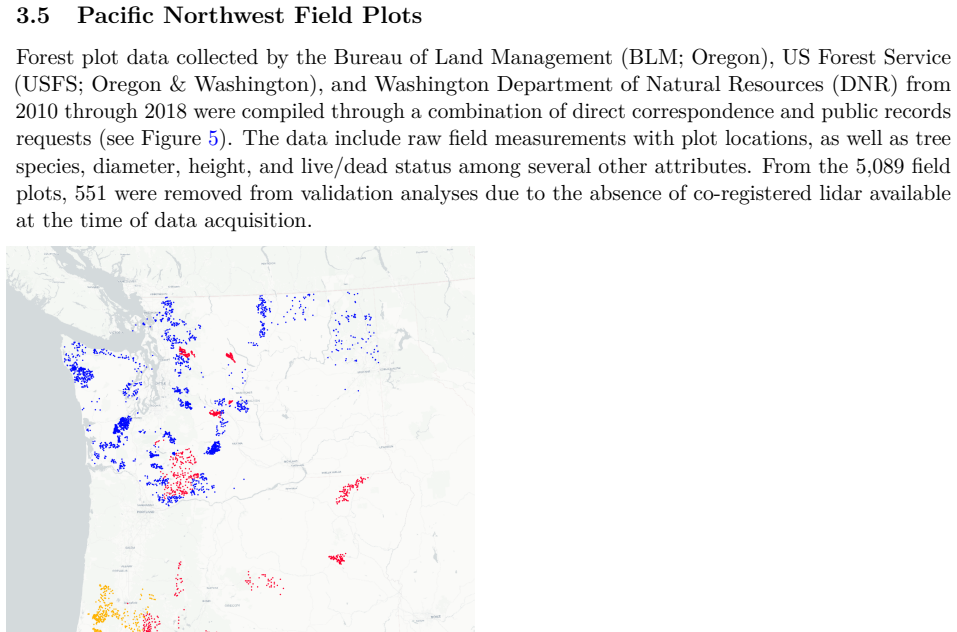
David Daniel Diaz.Leveraging Open Data to Support Forest Mapping, Modeling, and Policy Analysis in the Pacific Northwest, USA. Ph.D. Dissertation, University of Washington, Seattle, WA, February 2024. URLhttp://hdl.handle.net/1773/51176
2024
-
[20]
USGS 3DEP LiDAR Point Clouds, 2026
USGS. USGS 3DEP LiDAR Point Clouds, 2026. URLhttps://registry.opendata.aws/us gs-lidar/
2026
-
[21]
Howard Butler, Bradley Chambers, Preston Hartzell, and Craig Glennie. PDAL: An open source library for the processing and analysis of point clouds.Computers & Geosciences, 148:104680, March 2021. ISSN 00983004. doi: 10.1016/j.cageo.2020.104680. URL https: //linkinghub.elsevier.com/retrieve/pii/S0098300420306518
-
[22]
Howard Butler, Andrew Bell, Michael P. Gerlek, chambbj, Pete Gadomski, Connor Manning, Mateusz Łoskot, Bas Couwenberg, Norman Barker, Paul Ramsey, Even Rouault, Julia Dark, Kyle Mann, Guilhem Villemin, Nicolas Chaulet, Claire Foster, Michael Rosen, Ogi Moore, Scott Lewis, Grigory, Kirk McKelvey, Martin Dobias, Isaac Bell, Michael D. Smith, Bram, xantares,...
-
[23]
URLhttps://zenodo.org/doi/10.5281/zenodo.2616780
-
[24]
M. Drusch, U. Del Bello, S. Carlier, O. Colin, V. Fernandez, F. Gascon, B. Hoersch, C. Isola, P. Laberinti, P. Martimort, A. Meygret, F. Spoto, O. Sy, F. Marchese, and P. Bargellini. Sentinel-2: ESA’s Optical High-Resolution Mission for GMES Operational Services.Remote Sensing of Environment, 120:25–36, May 2012. ISSN 0034-4257. doi: 10.1016/j.rse.2011.11...
-
[25]
Earth Search STAC API, April 2026
Element84. Earth Search STAC API, April 2026. URLhttps://github.com/Element84/ear th-search. original-date: 2023-05-09T02:21:20Z. 26
2026
-
[26]
Fabian Pedregosa, Gaël Varoquaux, Alexandre Gramfort, Vincent Michel, Bertrand Thirion, Olivier Grisel, Mathieu Blondel, Peter Prettenhofer, Ron Weiss, Vincent Dubourg, Jake Vanderplas, Alexandre Passos, David Cournapeau, Matthieu Brucher, Matthieu Perrot, and Édouard Duchesnay. Scikit-learn: Machine Learning in Python.The Journal of Machine Learning Rese...
-
[27]
Level III and IV Ecoregions of the Continental United States, November 2015
US EPA. Level III and IV Ecoregions of the Continental United States, November 2015. URL https://www.epa.gov/eco-research/level-iii-and-iv-ecoregions-continental-uni ted-states
2015
-
[28]
Feature pyramid networks for object detection,
Tsung-Yi Lin, Piotr Dollar, Ross Girshick, Kaiming He, Bharath Hariharan, and Serge Belongie. Feature Pyramid Networks for Object Detection. In2017 IEEE Conference on Computer Vision and Pattern Recognition (CVPR), pages 936–944, Honolulu, HI, July 2017. IEEE. ISBN 978-1-5386-0457-1. doi: 10.1109/CVPR.2017.106. URL http://ieeexplore.ieee.org/docu ment/8099589/
-
[29]
Masked Autoencoders Are Scalable Vision Learners
Kaiming He, Xinlei Chen, Saining Xie, Yanghao Li, Piotr Dollar, and Ross Girshick. Masked Autoencoders Are Scalable Vision Learners. In2022 IEEE/CVF Conference on Computer Vision and Pattern Recognition (CVPR), pages 15979–15988, New Orleans, LA, USA, June
-
[30]
InProceedings of the IEEE/CVF Conference on Computer Vision and Pattern Recognition (CVPR)
IEEE. ISBN 978-1-6654-6946-3. doi: 10.1109/CVPR52688.2022.01553. URL https: //ieeexplore.ieee.org/document/9879206/
-
[31]
PyTorchLightning/pytorch-lightning: 0.7.6 release, May 2020
William Falcon, Jirka Borovec, Adrian Wälchli, Nic Eggert, Justus Schock, Jeremy Jordan, Nicki Skafte, Ir1dXD, Vadim Bereznyuk, Ethan Harris, Tullie Murrell, Peter Yu, Sebastian Præsius, Travis Addair, Jacob Zhong, Dmitry Lipin, So Uchida, Shreyas Bapat, Hendrik Schröter, Boris Dayma, Alexey Karnachev, Akshay Kulkarni, Shunta Komatsu, Martin.B, Jean-Bapti...
arXiv 2020
-
[32]
Decoupled Weight Decay Regularization
Ilya Loshchilov and Frank Hutter. Decoupled Weight Decay Regularization. InICLR 2019, September 2018. URLhttps://openreview.net/forum?id=Bkg6RiCqY7
2019
-
[33]
Andrew N. Gray, Anne C.S. McIntosh, Steven L. Garman, and Michael A. Shettles. Predicting canopy cover of diverse forest types from individual tree measurements.Forest Ecology and Management, 501:119682, December 2021. ISSN 03781127. doi: 10.1016/j.foreco.2021.119682. URLhttps://linkinghub.elsevier.com/retrieve/pii/S0378112721007726
-
[34]
James Menlove and Sean P. Healey. A comprehensive forest biomass dataset for the USA allows customized validation of remotely sensed biomass estimates.Remote Sensing, 12:4141, 2020. doi: 10.3390/rs12244141. URLhttps://research.fs.usda.gov/treesearch/63383. 27
discussion (0)
Sign in with ORCID, Apple, or X to comment. Anyone can read and Pith papers without signing in.