REVIEW 3 major objections 5 minor 47 references
Slow dynamic nonlinearity in unconsolidated glass bead packs
T0 review · 3 major / 5 minor · reviewed 2026-08-14 · deepseek-v4-flash
Pith's one-line read Unconsolidated glass bead packs exhibit slow dynamic nonlinearity after impulsive, harmonic, and quasi-static conditioning, with quasi-static pumping demonstrated for the first time.
desk verdict Careful bead-pack study convincingly shows slow dynamics after three pump types, including a new quasi-static protocol; the quantitative strain-dependence claims are shakier, and the stress-test's arithmetic inconsistency does not hold up. read the letter →
The pith
A machine-rendered reading of the paper's core claim, the machinery that carries it, and where it could break.
The reading
What carries the argument
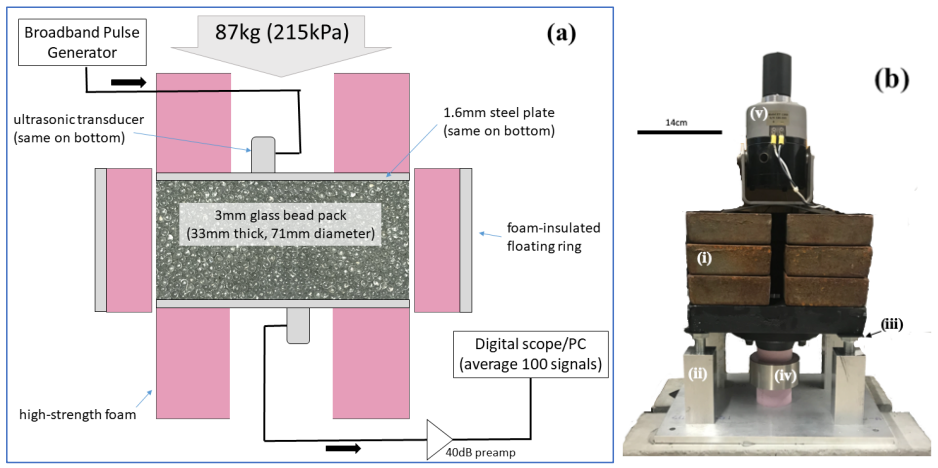
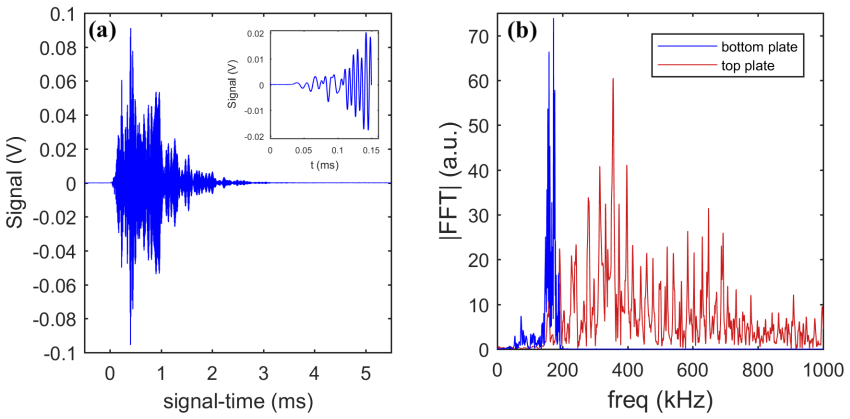
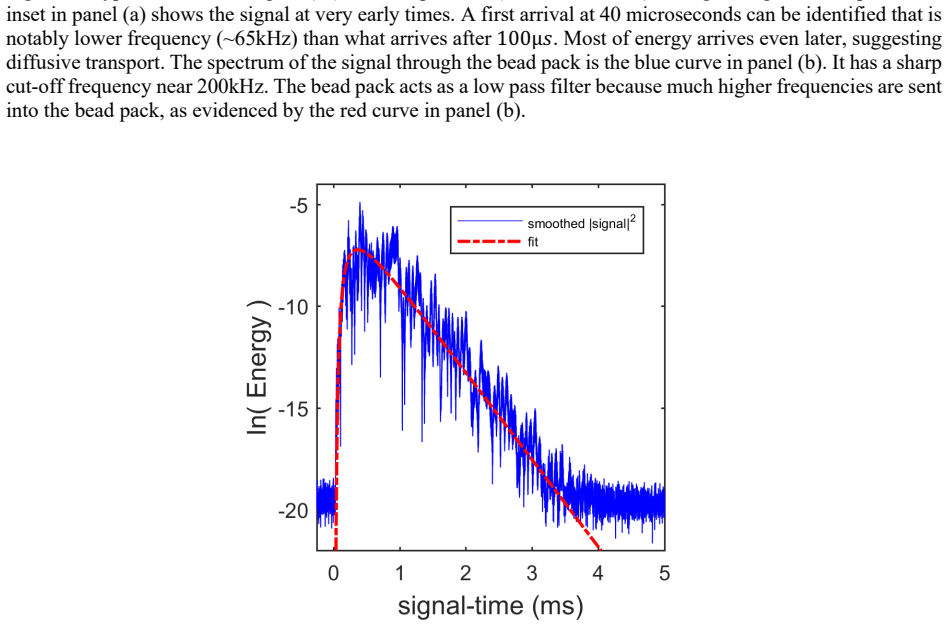
The load-bearing measurement is coda wave interferometry (CWI) applied to multiply scattered ultrasonic waves. A broadband pulse is sent through the bead pack every 0.01 s, 100 received signals are averaged every few seconds, and each averaged signal is cross-correlated with a reference signal in short signal-time windows. The time delay at maximum correlation is plotted against signal-time and fit to a line $\mathcal{T}_{ni} = \sigma_n t_i$; the slope, called stretch, equals the relative change in wave speed and therefore the relative change in modulus. Because the ultrasonic coda has explored many bead contacts, tiny stiffness changes show up as a measurable stretch. The three conditioning methods supply the perturbation, and the stretch recovery curves provide the slow-dynamics signature.
What would settle it
Record the pump onset with an independent trigger and refit the recoveries; if the slopes change beyond stated precision, the log-time fits are artifacts of the chosen $T_0$. Mount a strain gauge in or on the bead pack to measure conditioning strain directly rather than through Eqs. (6) and (7); if the leveling-off strain is not near $10^{-6}$, the threshold claim fails.
Extended reading notes
Core claim
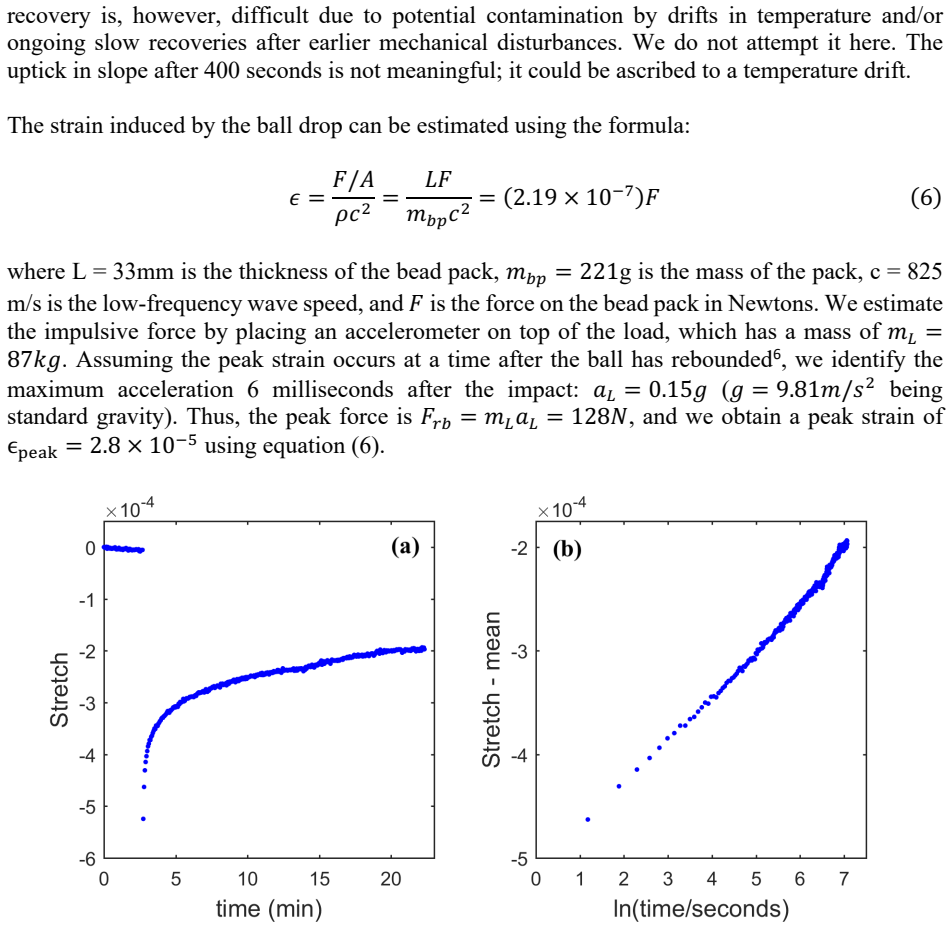
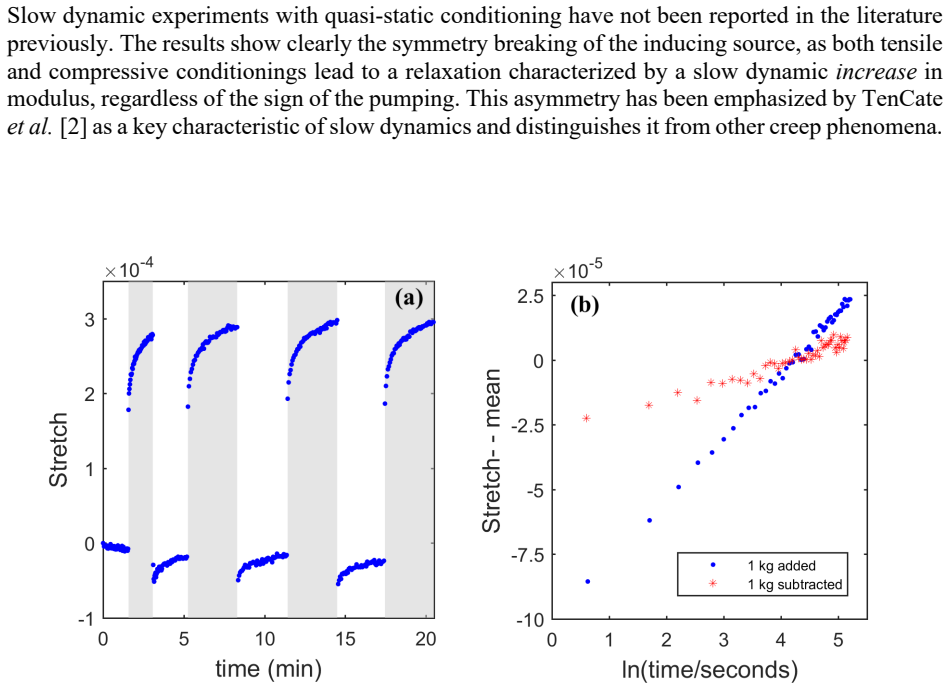
The central claim is that unconsolidated glass bead packs exhibit reproducible slow dynamic nonlinearity when probed by diffuse ultrasound, with a stiffness drop during low-frequency mechanical conditioning and a recovery that is linear in the logarithm of time. After impulsive, harmonic, and quasi-static pumping, the measured coda-wave stretch $\sigma$ follows $\sigma = m \ln(T - T_0) + \text{const.}$, with slopes of order $10^{-6}$ per log cycle. The quasi-static pump—adding or removing a 1 kg weight—produces slow logarithmic relaxation after both loading and unloading, showing that the system relaxes toward equilibrium regardless of the sign of the imposed strain. In addition, the recovery slope $m$ is linear in the rms pump strain for strains at and above roughly $10^{-6}$, and it flattens at lower strains, which the paper reads as evidence that the threshold for slow dynamics is much lower than previously estimated for bead packs, or absent.
Load-bearing premise
The paper's quantitative conclusions would collapse if direct strain measurement showed that the conditioning strains estimated from the simplified force-to-strain relations are systematically wrong, since the linear-above-one-microstrain and no-sharp-threshold claims are built on those estimates.
Editorial extensions
If this is right
- A simpler material is now available for testing theories of slow dynamics, with controllable grain size, surface treatment, humidity, and saturation.
- Quasi-static conditioning extends slow dynamics to a pump mode relevant to tectonic loading, since adding and removing a load both produce logarithmic recovery.
- The linear dependence of recovery slope on rms strain above about one microstrain and the leveling off below it indicate that the threshold strain in bead packs, if any, is below $6\times10^{-7}$.
- Ultrasonic probing via CWI can detect slow dynamics even when resonant frequencies do not shift, suggesting that reported threshold strains in sandstones should be re-examined at lower strains.
- The paper notes that extrapolated full-recovery times differ enormously by pump type—about 50 hours for the dropped ball versus effectively infinite for the quasi-static case—and leaves this discrepancy as an open puzzle.
Reading between the lines
- One testable extension is to vary humidity or apply hydrophobic bead coatings and watch whether the log-time recovery rate shifts; that would discriminate moisture-assisted contact healing from purely mechanical creep.
- A longer-duration, temperature-controlled quasi-static recovery measurement could test whether the astronomically long extrapolated recovery reflects an unusually flat activation-energy distribution or a genuinely different relaxation process.
- If the absence of a sharp strain threshold survives direct strain measurement, then small ambient vibrations may continuously excite slow dynamics in granular media, meaning even quiescent measurements of modulus in such materials are already affected by the measurement process.
Signed reviews
Editorial analysis
A structured set of objections, weighed in public.
Referee Report
Summary. The manuscript presents an experimental study of slow dynamic nonlinearity in unconsolidated glass bead packs, using ultrasonic pulses and coda wave interferometry (CWI) to measure changes in wave speed (stretch). The authors apply three low-frequency conditioning methods: impulsive (dropped ball), harmonic (60 Hz shaker), and quasi-static (adding/subtracting a 1 kg mass). They report a drop in stretch followed by logarithmic recovery after all three pump types, with the quasi-static method identified as novel. They also report a preliminary dependence of the recovery slope on the estimated rms pump strain, finding an apparent linear regime above about one microstrain and a leveling off below it, and use this to suggest that any threshold strain for slow dynamics in this system is below 6e-7 if it exists at all. Control experiments with brass side walls and without rubber shims indicate that the observed effects originate in the bead pack rather than in the support apparatus.
Significance. If the central qualitative claim holds, the paper provides a clean, low-noise venue for studying slow dynamics, with the advantage of a simpler and better-characterized microstructure than rocks or cement. The demonstration of slow dynamics after quasi-static conditioning is a new experimental result. The CWI-based stretch measurements achieve precision better than about 1e-6, and the control experiments for the foam and rubber shims strengthen the attribution of the effect to the bead pack. These are genuine strengths and make the system potentially useful for future parametric studies. The quantitative strain-threshold conclusions in Sec. V are more fragile: they depend on estimates of the conditioning strain and on slopes fitted without reported uncertainties, so they should be treated as preliminary unless the calibration is independently validated.
major comments (3)
- [Sec. IV, Eq. (6), Eq. (7); Table 1; Fig. 8] The quantitative claims in Sec. V—especially the linear-above-one-microstrain behavior and the 'below 6e-7' threshold statement—rest on the absolute values of the estimated pump strain. The strain values in Table 1 are actually consistent with the coefficient in Eq. (6): using epsilon/F = 2.19e-7 N^-1 gives 2.8e-5 for F = 128 N, 6.15e-7 for F = 2.8 N, and 2.15e-6 for F = 9.81 N, so there is no internal factor-of-ten inconsistency. However, Eq. (6) assumes a uniform uniaxial strain over the whole pack with a single wave speed c = 825 m/s, and Eq. (7) models the 87 kg load plus pack as a single-degree-of-freedom spring-mass system with a resonance at 20 Hz. These are reasonable order-of-magnitude estimates, but they are not independently validated. Because the x-axis of Fig. 8b and the numerical value of the putative threshold depend directly on this calibration, the paper should either provide an independent check (e.g., a direct displacement measurement of the load or pack boundary, or a comparison with static deflection under the added mass) or explicitly frame the strain axis and the threshold as order-of-magnitude estimates with a stated uncertainty. As written, the threshold conclusion in Sec. V is stronger than the calibration supports.
- [Sec. IV.A, footnote 5; Table 1; Fig. 8b] The zero time T0 for each recovery is adjusted post hoc to make the log-time plots linear, as acknowledged in footnote 5. The recovery slopes used in Table 1 and Fig. 8b are obtained by fitting from 15 s to 3 min, but no error bars or sensitivity analysis are reported. The slope values are the central quantitative output of the paper, and the apparent linear-versus-plateau structure in Fig. 8b is the basis for the threshold discussion. The authors should report at least the variation of the fitted slopes as T0 is varied within the plausible three-second interval, and ideally provide confidence intervals from the fits. Without this, it is difficult to assess whether the apparent leveling off at low strain in Fig. 8b is significant or within the fitting uncertainty.
- [Sec. V, Fig. 8] The low-strain plateau in Fig. 8b is inferred from very few data points, and footnote 7 states that measurements below the lowest strain were contaminated by drift. If the plateau is defined by only one or two points, the claim that the slope 'levels off' below about one microstrain should be worded more cautiously. Additional data points at intermediate strains, or a clear statement of how many independent measurements define each point, would make the threshold discussion more convincing. As it stands, the distinction between a genuine plateau and a scatter-limited flattening is not established.
minor comments (5)
- [Abstract] The phrase 'a creep-like phenomena' should be 'a creep-like phenomenon' (singular) or 'creep-like phenomena' without the indefinite article.
- [Sec. II, Eq. (2) and surrounding text] Some of the superscript and subscript characters are garbled in the transcript (e.g., the density unit 'g/cm1' should be 'g/cm^3', and several strain exponents such as '10#$' appear as raw symbols). Please ensure the final typeset version uses correct superscripts; this is a readability issue that should not affect the physics.
- [Table 1] The table lists slopes for the harmonic conditioning with 'shaker off' and 'shaker on'. It would help to state explicitly in the caption whether the 'shaker on' slope refers to the conditioning phase or to the recovery after the shaker is turned off, and to define the sign convention used for both.
- [Fig. 8] Panel (b) would benefit from error bars or at least a statement of the estimated uncertainty in each slope value. As currently plotted, the visual impression of a linear regime and a plateau may overstate the precision of the measurements.
- [References] Reference [24] appears to be a thesis citation without a title or institution; if it is publicly available, adding the full reference would improve completeness.
Circularity Check
No significant circularity: the recovery slopes and Hertzian theory-data comparisons are measured outputs and independent checks, not reproductions of the paper's inputs.
full rationale
Walking the paper's derivation chain: the central observations (log-time recovery after impulsive, harmonic, and quasi-static conditioning) are directly measured outputs, namely CWI stretch versus laboratory time. The recovery slopes m are fit to those measured data and then used to extrapolate full-recovery times; that is an extrapolation of a fit, not a prediction forced by the inputs. The Hertzian comparisons are genuine theory-vs-data checks: Eq. (1)-(2) predict a 249 kHz cutoff from bead geometry and material constants, compared with the observed ~200 kHz spectrum, and the quasi-static stretch prediction of 0.011/6 = 1.8e-3 from the Hertzian speed-force scaling is compared with the measured stretch and explicitly found to disagree by a factor of 6. The cited coda-wave-interferometry technique [33] and impulsive-pump precedent [11] are self-authored but published, externally validated methods; they are not invoked to forbid alternatives or to supply an unverified uniqueness theorem, and no load-bearing claim reduces to those citations. The one notable concern is the internal consistency of the strain calibration in Eq. (6) relative to Table 1 and Fig. 8, which is an experimental-calibration/correctness issue rather than a circularity: the strains are inputs to the x-axis of Fig. 8b, not outputs of the recovery-slope fits. No step in the paper's derivation chain is equivalent by construction to its own inputs, and no prediction is a renamed fit. Therefore the circularity score is 0.
Assumptions & free parameters
free parameters (1)
- T0 (zero time for recovery) =
not stated; chosen per fit to maximize linearity
assumptions (5)
- domain assumption Stretch sigma from coda wave interferometry equals relative wave-speed change, hence modulus change.
- domain assumption The ultrasonic probe does not itself condition the bead pack.
- domain assumption Observed slow dynamics originates in the bead pack, not foam walls or rubber shims.
- domain assumption Equation (6) converts applied force to conditioning strain via pack mass, thickness, and wave speed.
- standard math Diffusion fit parameters (D, alpha) and the hcp cutoff formula are standard derived results.
Cite this review
Pith. "Pith review of Slow dynamic nonlinearity in unconsolidated glass bead packs." pith.science (2026). https://pith.science/paper/EVDFZU2B
@misc{pith2026190808935,
  author       = {Pith},
  title        = {Pith review of: Slow dynamic nonlinearity in unconsolidated glass bead packs},
  year         = {2026},
  howpublished = {\url{https://pith.science/paper/EVDFZU2B}},
  note         = {Machine review of arXiv:1908.08935}
}
read the original abstract
Slow dynamic nonlinearity describes a poorly understood, creep-like phenomena that occurs in brittle composite materials such as rocks and cement. It is characterized by a drop in stiffness induced by a mechanical conditioning, followed by a log(time) recovery. A consensus theoretical understanding of the behavior has not been developed. Here we introduce an alternative experimental venue with which to inform theory. Unconsolidated glass bead packs are studied rather than rocks or cement because the structure and internal contacts of bead packs are less complex and better understood. Slow dynamics has been observed in such systems previously. However, the measurements to date tend to be irregular. Particular care is used here in the experimental design to overcome the difficulties inherent in bead pack studies. This includes the design of the bead pack support, the use of low frequency conditioning, and the use of ultrasonic waves as a probe with coda wave interferometry to assess changes. Slow dynamics is observed in our system after three different methods for low-frequency conditioning, one of which has not been reported in the literature previously.
Figures
Figures from the paper (5 more)



Reference graph
Works this paper leans on
-
[1]
J. A. TenCate and T. J. Shankland, Geophys. Res. Lett. 23, 3019 (1996)
work page 1996
-
[2]
J. A. TenCate, E. Smith, and R. A. Guyer, Phys. Rev. Lett. 85, 1020 (2000)
work page 2000
-
[3]
J. A. TenCate, Pure Appl. Geophys. 168, 2211 (2011)
work page 2011
- [4]
-
[5]
R. A. Guyer and P. A. Johnson, Phys. Today 52, 30 (1999)
work page 1999
-
[6]
R. A. Guyer and P. A. Johnson, Nonlinear Mesoscopic Elasticity: The Complex Behaviour of Granular Media Including Rocks and Soil (2009)
work page 2009
-
[7]
P. Shokouhi, J. Rivière, R. A. Guyer, and P. A. Johnson, Appl. Phys. Lett. 111, (2017)
work page 2017
-
[8]
J. A. TenCate, J. Duran, and T. J. Shankland, in Nonlinear Acoust. Begin. 21st Century, edited by O. V. Rudenko and O. A. Sapozhnikov (Moscow State University, 2002), pp. 767–770
work page 2002
Show all 47 references
-
[9]
Brenguier, M
F. Brenguier, M. Campillo, C. Hadziioannou, N. M. Shapiro, R. M. Nadeau, and E. Larose, Science (80-. ). 321, 1478 (2008)
2008
-
[10]
Gassenmeier, C
M. Gassenmeier, C. Sens-Schönfelder, T. Eulenfeld, M. Bartsch, P. Victor, F. Tilmann, and M. Korn, Geophys. J. Int. 204, 1490 (2016)
2016
-
[11]
O. I. Lobkis and R. L. Weaver, J. Acoust. Soc. Am. 125, 1894 (2009)
2009
-
[12]
Tremblay, E
N. Tremblay, E. Larose, and V. Rossetto, J. Acoust. Soc. Am. 127, 1239 (2010)
2010
-
[13]
Renaud, S
G. Renaud, S. Calĺ, and M. Defontaine, Appl. Phys. Lett. 94, (2009)
2009
-
[14]
Renaud, P
G. Renaud, P. Y. Le Bas, and P. A. Johnson, J. Geophys. Res. Solid Earth 117, 1 (2012)
2012
-
[15]
Rivière, G
J. Rivière, G. Renaud, R. A. Guyer, and P. A. Johnson, J. Appl. Phys. 114, (2013)
2013
-
[16]
Renaud, J
G. Renaud, J. Rivière, P. Y. Le Bas, and P. A. Johnson, Geophys. Res. Lett. 40, 715 (2013)
2013
-
[17]
Bureau, T
L. Bureau, T. Baumberger, and C. Caroli, Eur. Phys. J. E 8, 331 (2002)
2002
-
[18]
J. A. TenCate, E. Smith, L. W. Byers, and T. J. Shankland, AIP Conf. Proc. 524, 303 (2000)
2000
-
[19]
X. Li, C. Sens-Schönfelder, and R. Snieder, Phys. Rev. B 97, 1 (2018)
2018
-
[20]
Snieder, C
R. Snieder, C. Sens-Schönfelder, and R. Wu, Geophys. J. Int. 208, 1 (2017)
2017
-
[21]
A. V. Lebedev and L. A. Ostrovsky, Acoust. Phys. 60, 555 (2014)
2014
-
[22]
Ostrovsky, A
L. Ostrovsky, A. Lebedev, J. Riviere, P. Shokouhi, C. Wu, M. A. Stuber Geesey, and P. A. Johnson, J. Geophys. Res. Solid Earth 5003 (2019)
2019
-
[23]
K. E.-A. Van Den Abeele, J. Geophys. Res. 107, 1 (2002)
2002
-
[26]
J. A. Bittner and J. S. Popovics, Appl. Phys. Lett. 114, 021901 (2019)
2019
-
[27]
Bocquet, E
L. Bocquet, E. Charlaix, S. Ciliberto, and J. Crassous, Nature 396, 735 (1998)
1998
-
[28]
O. O. Vakhnenko, V. O. Vakhnenko, T. J. Shankland, and J. A. TenCate, AIP Conf. Proc. 838, 120 (2006)
2006
-
[29]
V. Y. Zaitsev, V. E. Gusev, V. Tournat, and P. Richard, Phys. Rev. Lett. 112, 1 (2014)
2014
-
[30]
Zaitsev, V
V. Zaitsev, V. Gusev, and B. Castagnede, Phys. Rev. Lett. 90, 4 (2003)
2003
-
[31]
P. A. Johnson and X. Jia, Nature 437, 871 (2005)
2005
-
[32]
Tournat and V
V. Tournat and V. E. Gusev, Phys. Rev. E - Stat. Nonlinear, Soft Matter Phys. 80, 1 20 (2009)
2009
-
[33]
O. I. Lobkis and R. L. Weaver, Phys. Rev. Lett. 90, 4 (2003)
2003
-
[34]
V. Y. Zaitsev, V. E. Nazarov, V. Tournat, V. E. Gusev, and B. Castagnède, Europhys. Lett. 70, 607 (2005)
2005
-
[35]
X. Jia, T. Brunet, and J. Laurent, Phys. Rev. E - Stat. Nonlinear, Soft Matter Phys. 84, 2 (2011)
2011
-
[36]
Tournat and V
V. Tournat and V. E. Gusev, Acta Acust. United with Acust. 96, 208 (2010)
2010
-
[37]
R. L. Weaver and W. Sachse, J. Acoust. Soc. Am. 97, 2094 (1995)
1995
-
[38]
X. Jia, C. Caroli, and B. Velicky, Phys. Rev. Lett. 82, 1863 (1999)
1999
-
[39]
Jia, Phys
X. Jia, Phys. Rev. Lett. 93, 8 (2004)
2004
-
[40]
Snieder, Pure Appl
R. Snieder, Pure Appl. Geophys. 163, 455 (2006)
2006
-
[41]
Planès and E
T. Planès and E. Larose, Cem. Concr. Res. 53, 248 (2013)
2013
-
[42]
D. M. Mueth, H. M. Jaeger, and S. R. Nagel, Phys. Rev. E - Stat. Physics, Plasmas, Fluids, Relat. Interdiscip. Top. (1998)
1998
-
[43]
J. A. Turner, M. E. Chambers, and R. L. Weaver, Acustica 84, 628 (1998)
1998
-
[44]
Merkel, V
A. Merkel, V. Tournat, and V. Gusev, Phys. Rev. E - Stat. Nonlinear, Soft Matter Phys. 82, 1 (2010)
2010
-
[45]
Merkel, V
A. Merkel, V. Tournat, and V. Gusev, Phys. Rev. Lett. 107, 1 (2011)
2011
-
[46]
Snieder, A
R. Snieder, A. Grêt, H. Douma, and J. Scales, Science (80-. ). 295, 2253 (2002)
2002
-
[47]
J. A. TenCate, D. Pasqualini, S. Habib, K. Heitmann, D. Higdon, and P. A. Johnson, Phys. Rev. Lett. 93, 65501 (2004)
2004
-
[48]
Pasqualini, K
D. Pasqualini, K. Heitmann, J. A. TenCate, S. Habib, D. Higdon, and P. A. Johnson, J. Geophys. Res. Solid Earth 112, B01204 (2007)
2007
-
[49]
K. L. Johnson, Contact Mechanics (Cambridge University Press, Cambridge, UK, 1985)
1985
Reviewed August 14, 2026 · model on record in the stance chip above.
Discussion (0). Continue with ORCID to comment.