REVIEW 4 major objections 4 minor 1 cited by
The paper claims RoVTL is the first image-and-table model that stays accurate across the full range of tabular data availability—from zero attributes to all—with its largest gains exactly where prior methods degrade.
Reviewed by Pith at T0; open to challenge. T0 means a machine referee read the full paper against a public rubric. the ladder, T0–T4 →
T0 review · deepseek-v4-flash
2026-08-03 14:38 UTC pith:F6AYYCW6
load-bearing objection Promising robustness idea undermined by label leakage into pretraining and a direct DVM overclaim; the paper deserves review but needs a clean ablation before its headline claims can be trusted. the 4 major comments →
No Data? No Problem: Robust Vision-Tabular Learning with Missing Values
The pith
A machine-rendered reading of the paper's core claim, the machinery that carries it, and where it could break.
Core claim
On its own terms, the paper's central claim is that the full 0%–100% spectrum of tabular missingness can be handled by one model, provided missingness is treated as an augmentation rather than a corruption. RoVTL first pretrains image and tabular encoders with a contrastive objective in which each sample is seen with a randomly chosen subset of its own tabular attributes, teaching the tabular encoder to represent partial tables and the image encoder to remain informative on its own. At fine-tuning, the model ranks two nested tabular subsets per step: the Tabular More vs. Fewer loss requires the version with a superset of attributes to do no worse than the version with fewer. A gated cross-at
What carries the argument
The load-bearing mechanism is the conversion of tabular missingness from a nuisance into a structured training signal. (1) Missingness augmentation in contrastive pretraining: each image-tabular pair is contrasted against a randomly selected subset of its tabular attributes, so the tabular encoder learns from partial tables and cannot rely on any fixed attribute set. (2) TabMoFe loss: a ranking loss that samples a subset and a superset of tabular attributes and penalizes the model whenever the fewer-attribute input produces a lower task loss than the superset, encoding 'more data should not hurt.' (3) Gated cross-attention fusion: image tokens attend to tabular tokens, and a sigmoid-gated sc
Load-bearing premise
The comparisons assume that including target-related attributes (disease labels, body-mass index, car model) in RoVTL's pretraining, while withholding them from supervised baselines, does not inflate RoVTL's advantage when almost no tabular data is available; the paper does not analyze this asymmetry.
What would settle it
Retrain RoVTL with the downstream labels (disease codes, body-mass index, car model) removed from pretraining, and give the same labels to the supervised baselines; if the accuracy gap at 0–30% tabular availability disappears, the claimed robustness is largely an artifact of pretraining on the labels.
If this is right
- A single trained model can serve image-only, partial-tabular, and full-tabular deployment, removing the need to choose or switch between specialized models when attributes are missing.
- Performance degrades gracefully from 100% to 0% tabular availability instead of dropping sharply below roughly 30%, which is the regime most real clinical and consumer deployments face.
- The largest reported gains over prior methods occur when little tabular data is available, meaning the method is most useful exactly where prior image-tabular models hurt reliability.
- The pretraining and tuning recipe transfers across tasks and domains—medical classification, medical regression, external medical data, and natural-image classification—suggesting it is not overfit to one benchmark.
- The downstream tuning components (TabMoFe and disentangled gradients) improve even simpler fusion baselines, so the training strategy itself is reusable beyond the specific gated architecture.
Where Pith is reading between the lines
- Editorial extension: if the reported low-tabular gains survive removing target-related attributes (disease labels, body-mass index, car model) from pretraining, missingness augmentation could become a general-purpose regularization for any paired image-table dataset; if the gains shrink, part of the advantage is task peeking rather than robustness.
- Editorial extension: the learned gate scalar could double as a per-sample confidence estimate at low tabular availability, giving users a natural signal for when to trust an image-only prediction; the paper does not explore this.
- Editorial extension: because the tabular encoder is semantically grounded, a plausible next test is whether RoVTL can ingest new, unseen tabular columns at test time without retraining—a capability the current experiments do not measure.
- Editorial extension: the fact that the fine-tuning recipe improves concatenation and max-fusion baselines suggests the ideas may transfer to vision-language models with structured metadata, not just dedicated image-table pairs.
Editorial analysis
A structured set of objections, weighed in public.
Referee Report
Summary. The paper proposes RoVTL, a two-stage vision-tabular learning framework intended to remain accurate across the full spectrum of tabular data availability, from 0% to 100%. The first stage is CLIP-style contrastive pretraining with a newly proposed tabular missingness augmentation, where random subsets of tabular attributes are dropped. The second stage is downstream task tuning with a gated cross-attention fusion module, a Tabular More vs. Fewer (TabMoFe) loss that compares losses under larger and smaller subsets of attributes, and disentangled gradient learning. The method is evaluated on UK Biobank cardiac MRI for CAD classification and BMI regression, on the external M&M's cardiac dataset, and on the DVM car advertisement dataset for car model classification. The authors claim consistent superiority over nine baselines, with the largest gains when little tabular data is available, plus successful external and cross-domain generalization. Code and model weights are released.
Significance. If the claims were established, RoVTL would be a useful contribution: it targets the full 0%–100% tabular-availability spectrum, proposes a concrete and simple missingness augmentation, includes ablations of its components, and evaluates on external and natural-image datasets. The release of code and weights is a strength. However, the central empirical claim is currently undermined by a target-label leakage confound in pretraining and by internal inconsistencies in the reported results; these issues must be resolved before the contribution can be assessed.
major comments (4)
- [SM I.3, SM Tables 5–7, Sec. 3.1] The central claim is confounded by target-label leakage in pretraining. SM I.3 says pretraining incorporated attributes later used as labels; SM Tables 5 and 7 show pretraining uses the exact CAD ICD codes and BMI (UKB) and Car Model (DVM), while downstream excludes them. Contrastive pretraining therefore aligns the image encoder with label-containing tabular vectors, so Fig. 3's 0%/low-tabular curves are not a clean test of missing-tabular robustness and violate Sec. 3.1's separation of y and t. The comparison is unfair: IF/DAFT get no label attributes, while TIP is modified to include them. A control pretraining without target labels, and comparison to unmodified TIP, is needed.
- [Table 1, Sec. 6.1] Table 1 contradicts the text. For DVM frozen backbones, RoVTL reports 94.10 accuracy, below TIP's 94.73 and MF*'s 94.25; for BMI trainable backbones, MF* (1.59) beats RoVTL (1.69). The statement in Sec. 6.1 that RoVTL outperforms the other baselines is therefore not supported by the presented numbers. Please report the per-availability results explicitly and qualify the claims accordingly.
- [Tables 1–4, Sec. 6] All main results are single means averaged over missingness levels; no standard deviations, confidence intervals, number of seeds, or significance tests are reported. Many comparisons are small (e.g., BMI trainable: 1.69 vs 1.59; CAD frozen: 84.68 vs 83.49 in Table 2), so without variance it is impossible to tell whether the reported improvements are meaningful. Please add repeated-run statistics, at least for the headline comparisons, and describe how missingness variants are averaged.
- [SM I.4] SM I.4 assigns Binary Cross Entropy with Logits to 'multilabel classification (DVM car model prediction and M&Ms cardiac disease prediction)' and Cross Entropy to 'multiclass classification (CAD classification)'. But the main text defines DVM as 286-class multiclass and M&Ms as multiclass disease classification, while CAD is described as multilabel. The reported losses are inconsistent with the reported tasks and must be corrected for reproducibility.
minor comments (4)
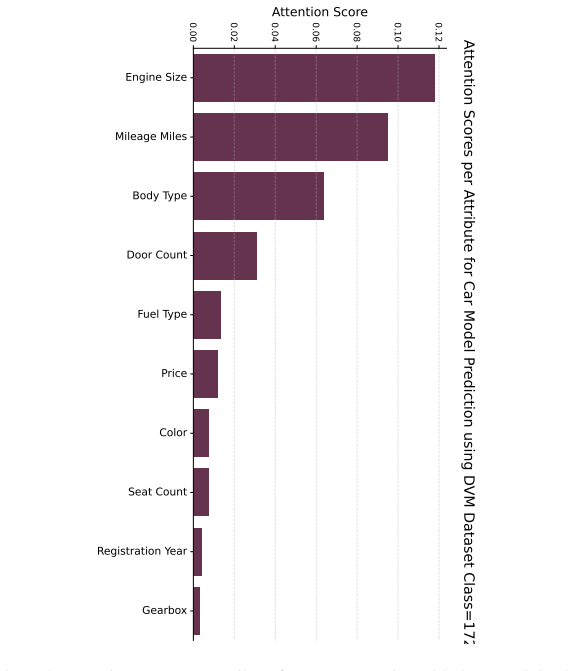
- [Fig. 8 caption] The caption reads 'Attention Scores per Attribute for BMI Regression', but the figure shows attention scores for DVM car model prediction. Please correct.
- [Eq. (3), Sec. 4.1] Please clarify how t- is represented when empty and how L_task(i, t-) is computed in that case, since the downstream evaluation includes 0% tabular data. Also define N_a and N_t unambiguously.
- [SM I.4, Sec. 5.2] The 'augmentation rate set to 0.95' is not defined in the main text; clarify whether this controls the pretraining missingness augmentation, the TabMoFe sampling, or both.
- [Table 5] The table's ✓/× annotations are hard to parse in several rows (e.g., Body mass index, Angina Pectoris). Please render the table so that each column (CAD, BMI) is unambiguous.
Circularity Check
No derivation-level circularity; the disclosed label-in-pretraining issue is a fairness confound, not a circular reduction.
full rationale
RoVTL's claims are empirical: missingness augmentation, TabMoFe, gated cross-attention, and DGL are training objectives rather than a derivation in which an output is redefined as an input. TabMoFe (Eq. 3-4) is an explicit regularizer that penalizes worse performance with more tabular data; it does not presuppose the robustness it enforces. The main non-circular concern is disclosed in SM I.3: "pretraining incorporated attributes that are later used as labels for downstream tasks." SM Tables 5 and 7 confirm that BMI, CAD ICD-code fields (e.g., Angina Pectoris I20, Myocardial Infarction I21), and the Car Model string are used during pretraining. This is a real label-leakage/fairness confound for the low-tabular comparisons, especially against supervised baselines IF/DAFT, which were given no label attributes. However, this is not a circular construction: the downstream prediction is not defined as the pretraining tabular vector, and the pretraining-based baselines (TIP, MMCL, TGV) are given the same label-containing attributes, so the relative missingness-augmentation effect in Table 2 and Fig. 4 is not reduced to the label input. The cited prior work by the same authors ([15] TGV) is used as a baseline and is not load-bearing. The paper is also evaluated on an external M&M's dataset where the UK Biobank pretraining labels do not coincide with the downstream disease labels, providing independent evidence. Overall, no step in the claimed derivation chain reduces to its own inputs; the label-in-pretraining issue should be weighed as a correctness/fairness risk, not circularity.
Axiom & Free-Parameter Ledger
free parameters (3)
- TabMoFe weight lambda =
1 (classification), 0.05 (regression)
- Tabular missingness augmentation rate =
0.95
- Learning rate per dataset =
selected from {1e-3, 3e-3, 1e-4, 3e-4} on validation
axioms (4)
- domain assumption TARTE's semantic column embeddings remain meaningful when arbitrary subsets of attributes are dropped and across different table schemas (UK Biobank -> M&Ms).
- domain assumption More tabular attributes should not increase task loss; the TabMoFe ranking (Eq. 3) is a valid training signal.
- domain assumption Random-forest feature importances identify the attributes that matter most/least for all compared models.
- ad hoc to paper Pretraining with target labels as tabular attributes does not unfairly inflate downstream image-only results relative to the intended deployment setting.
Cite this review
Pith. "Pith review of No Data? No Problem: Robust Vision-Tabular Learning with Missing Values." pith.science (2026). https://pith.science/paper/F6AYYCW6
@misc{pith2026251219602,
  author       = {Pith},
  title        = {Pith review of: No Data? No Problem: Robust Vision-Tabular Learning with Missing Values},
  year         = {2026},
  howpublished = {\url{https://pith.science/paper/F6AYYCW6}},
  note         = {Machine review of arXiv:2512.19602}
}
read the original abstract
Large-scale medical biobanks provide imaging data complemented by extensive tabular information, such as clinical measurements or demographics. However, this abundance of tabular attributes does not reflect real-world datasets, where only a subset of attributes may be available. This discrepancy calls for methods that remain robust to missing values at inference. To address this challenge, we propose RoVTL (Robust Vision-Tabular Learning), a framework designed to handle any level of tabular data availability, from 0% to 100%. RoVTL comprises two key stages: contrastive pretraining, where we introduce tabular attribute missingness as data augmentation to promote robustness, and downstream task tuning, where tabular missingness is complemented by a novel Tabular More vs. Fewer loss that ranks performance based on the amount of available tabular data. Combined with gated-cross attention fusion module, our tuning approach enables consistent performance across all tabular data completeness scenarios. We evaluate RoVTL on cardiac MRI scans from the UK Biobank, demonstrating superior robustness to missing tabular data compared to prior methods. Furthermore, RoVTL successfully generalizes to an external cardiac MRI dataset for multimodal disease classification, and extends to the natural images domain, achieving robust performance on a car advertisements dataset. The model weights and code are available at https://github.com/marteczkah/RoVTL.
Figures


Forward citations
Cited by 1 Pith paper
-
Beyond IID: How General Are Tabular Foundation Models, Really?
Tabular foundation models excel on tiny- to medium-sized IID data but are outperformed by traditional tree-based and deep learning models on non-IID, large, and high-dimensional datasets, based on evaluations across 1...
Reference graph
Works this paper leans on
-
[1]
Foundation models defining a new era in vision: a survey and outlook
Muhammad Awais, Muzammal Naseer, Salman Khan, Rao Muhammad Anwer, Hisham Cholakkal, Mubarak Shah, Ming-Hsuan Yang, and Fahad Shahbaz Khan. Foundation models defining a new era in vision: a survey and outlook. IEEE Transactions on Pattern Analysis and Machine Intelli- gence, 2025. 2
2025
-
[2]
Automated car- diovascular magnetic resonance image analysis with fully convolutional networks.Journal of cardiovascular magnetic resonance, 20(1):65, 2018
Wenjia Bai, Matthew Sinclair, Giacomo Tarroni, Ozan Oktay, Martin Rajchl, Ghislain Vaillant, Aaron M Lee, Nay Aung, Elena Lukaschuk, Mihir M Sanghvi, et al. Automated car- diovascular magnetic resonance image analysis with fully convolutional networks.Journal of cardiovascular magnetic resonance, 20(1):65, 2018. 1
2018
-
[3]
Predicting stroke outcome: a case for multimodal deep learn- ing methods with tabular and ct perfusion data.Artificial Intelligence in Medicine, 147:102719, 2024
Bal´azs Borsos, Corinne G Allaart, and Aart van Halteren. Predicting stroke outcome: a case for multimodal deep learn- ing methods with tabular and ct perfusion data.Artificial Intelligence in Medicine, 147:102719, 2024. 2
2024
-
[4]
Multi- centre, multi-vendor and multi-disease cardiac segmentation: the m&ms challenge.IEEE Transactions on Medical Imaging, 40(12):3543–3554, 2021
Victor M Campello, Polyxeni Gkontra, Cristian Izquierdo, Carlos Martin-Isla, Alireza Sojoudi, Peter M Full, Klaus Maier-Hein, Yao Zhang, Zhiqiang He, Jun Ma, et al. Multi- centre, multi-vendor and multi-disease cardiac segmentation: the m&ms challenge.IEEE Transactions on Medical Imaging, 40(12):3543–3554, 2021. 2, 5, 8, 1, 3
2021
-
[5]
Xgboost: A scalable tree boosting system
Tianqi Chen and Carlos Guestrin. Xgboost: A scalable tree boosting system. InProceedings of the 22nd acm sigkdd international conference on knowledge discovery and data mining, pages 785–794, 2016. 2
2016
-
[6]
Tip: Tabular-image pre- training for multimodal classification with incomplete data
Siyi Du, Shaoming Zheng, Yinsong Wang, Wenjia Bai, De- clan P O’Regan, and Chen Qin. Tip: Tabular-image pre- training for multimodal classification with incomplete data. InEuropean Conference on Computer Vision, pages 478–496. Springer, 2024. 1, 3, 5, 6, 7, 8
2024
-
[7]
Stil: Semi-supervised tabular-image learning for comprehensive task-relevant information exploration in multimodal classifi- cation
Siyi Du, Xinzhe Luo, Declan P O’Regan, and Chen Qin. Stil: Semi-supervised tabular-image learning for comprehensive task-relevant information exploration in multimodal classifi- cation. InProceedings of the Computer Vision and Pattern Recognition Conference, pages 15549–15559, 2025. 3
2025
-
[8]
Prediction of pathological complete re- sponse to neoadjuvant chemotherapy in breast cancer using deep learning with integrative imaging, molecular and demo- graphic data
Hongyi Duanmu, Pauline Boning Huang, Srinidhi Brah- mavar, Stephanie Lin, Thomas Ren, Jun Kong, Fusheng Wang, and Tim Q Duong. Prediction of pathological complete re- sponse to neoadjuvant chemotherapy in breast cancer using deep learning with integrative imaging, molecular and demo- graphic data. InInternational conference on medical image computing and ...
-
[9]
Hyperfusion: A hypernetwork approach to multimodal integration of tabular and medical imaging data for predictive modeling.Medical Image Analysis, 102: 103503, 2025
Daniel Duenias, Brennan Nichyporuk, Tal Arbel, Tammy Rik- lin Raviv, et al. Hyperfusion: A hypernetwork approach to multimodal integration of tabular and medical imaging data for predictive modeling.Medical Image Analysis, 102: 103503, 2025. 2
2025
-
[10]
Time and the patient–physician relationship.Journal of gen- eral internal medicine, 14(Suppl 1):S34, 1999
David C Dugdale, Ronald Epstein, and Steven Z Pantilat. Time and the patient–physician relationship.Journal of gen- eral internal medicine, 14(Suppl 1):S34, 1999. 1
1999
-
[11]
German National Cohort (GNC) Consortium geschaeftsstelle@ nationale-kohorte. de. The german national cohort: aims, study design and organization. European journal of epidemiology, 29(5):371–382, 2014. 1
2014
-
[12]
Why do tree-based models still outperform deep learning on typical tabular data?Advances in neural information processing systems, 35:507–520, 2022
L´eo Grinsztajn, Edouard Oyallon, and Ga¨el Varoquaux. Why do tree-based models still outperform deep learning on typical tabular data?Advances in neural information processing systems, 35:507–520, 2022. 2
2022
-
[13]
Best of both worlds: Multimodal contrastive learning with tabular and imaging data
Paul Hager, Martin J Menten, and Daniel Rueckert. Best of both worlds: Multimodal contrastive learning with tabular and imaging data. InProceedings of the IEEE/CVF Conference on Computer Vision and Pattern Recognition, pages 23924– 23935, 2023. 1, 3, 4, 5, 6, 7, 8
2023
-
[14]
Can spatiotemporal 3d cnns retrace the history of 2d cnns and im- agenet? InProceedings of the IEEE conference on Computer Vision and Pattern Recognition, pages 6546–6555, 2018
Kensho Hara, Hirokatsu Kataoka, and Yutaka Satoh. Can spatiotemporal 3d cnns retrace the history of 2d cnns and im- agenet? InProceedings of the IEEE conference on Computer Vision and Pattern Recognition, pages 6546–6555, 2018. 5
2018
-
[15]
Marta Hasny, Maxime Di Folco, Keno Bressem, and Julia Schnabel. Tables guide vision: Learning to see the heart through tabular data.arXiv preprint arXiv:2503.14998, 2025. 1, 3, 5, 6, 8
Pith/arXiv arXiv 2025
-
[16]
Deep residual learning for image recognition
Kaiming He, Xiangyu Zhang, Shaoqing Ren, and Jian Sun. Deep residual learning for image recognition. InProceed- ings of the IEEE conference on computer vision and pattern recognition, pages 770–778, 2016. 5
2016
-
[17]
Noah Hollmann, Samuel M ¨uller, Katharina Eggensperger, and Frank Hutter. Tabpfn: A transformer that solves small tabular classification problems in a second.arXiv preprint arXiv:2207.01848, 2022. 2
Pith/arXiv arXiv 2022
-
[18]
Dvm-car: A large-scale automotive dataset for visual marketing research and applications, 2023
Jingmin Huang, Bowei Chen, Lan Luo, Shigang Yue, and Iadh Ounis. Dvm-car: A large-scale automotive dataset for visual marketing research and applications, 2023. 2, 6, 1, 3
2023
-
[19]
Tabular insights, visual impacts: transferring expertise from tables to images
Jun-Peng Jiang, Han-Jia Ye, Leye Wang, Yang Yang, Yuan Jiang, and De-Chuan Zhan. Tabular insights, visual impacts: transferring expertise from tables to images. InForty-first International Conference on Machine Learning, 2024. 2
2024
-
[20]
Myung Jun Kim, F´elix Lefebvre, Ga¨etan Brison, Alexandre Perez-Lebel, and Ga¨el Varoquaux. Table foundation models: on knowledge pre-training for tabular learning.arXiv preprint arXiv:2505.14415, 2025. 2, 5, 7, 8
Pith/arXiv arXiv 2025
-
[21]
Matryoshka representation learning.Advances in Neural Information Processing Systems, 35:30233–30249, 2022
Aditya Kusupati, Gantavya Bhatt, Aniket Rege, Matthew Wallingford, Aditya Sinha, Vivek Ramanujan, William Howard-Snyder, Kaifeng Chen, Sham Kakade, Prateek Jain, et al. Matryoshka representation learning.Advances in Neural Information Processing Systems, 35:30233–30249, 2022. 5
2022
-
[22]
Simmlm: A simple framework for multi-modal learning with missing modality
Sijie Li, Chen Chen, and Jungong Han. Simmlm: A simple framework for multi-modal learning with missing modality. arXiv preprint arXiv:2507.19264, 2025. 2, 4
Pith/arXiv arXiv 2025
-
[23]
Classification and regres- sion by randomforest.R news, 2(3):18–22, 2002
Andy Liaw, Matthew Wiener, et al. Classification and regres- sion by randomforest.R news, 2(3):18–22, 2002. 7
2002
-
[24]
Jingang Qu, David Holzm ˜Aˇzller, Ga¨el Varoquaux, and Ma- rine Le Morvan. Tabicl: A tabular foundation model for in-context learning on large data.arXiv preprint arXiv:2502.05564, 2025. 2
Pith/arXiv arXiv 2025
-
[25]
Learning transferable visual models from natural language supervi- sion
Alec Radford, Jong Wook Kim, Chris Hallacy, Aditya Ramesh, Gabriel Goh, Sandhini Agarwal, Girish Sastry, Amanda Askell, Pamela Mishkin, Jack Clark, et al. Learning transferable visual models from natural language supervi- sion. InInternational conference on machine learning, pages 8748–8763. PmLR, 2021. 3
2021
-
[26]
A parameter-efficient deep learning approach to predict conversion from mild cognitive impairment to alzheimer’s disease.Neuroimage, 189:276–287, 2019
Simeon Spasov, Luca Passamonti, Andrea Duggento, Pietro Lio, Nicola Toschi, Alzheimer’s Disease Neuroimaging Initia- tive, et al. A parameter-efficient deep learning approach to predict conversion from mild cognitive impairment to alzheimer’s disease.Neuroimage, 189:276–287, 2019. 2, 5, 6
2019
-
[27]
Uk biobank: an open access resource for identifying the causes of a wide range of com- plex diseases of middle and old age.PLoS medicine, 12(3): e1001779, 2015
Cathie Sudlow, John Gallacher, Naomi Allen, Valerie Beral, Paul Burton, John Danesh, Paul Downey, Paul Elliott, Jane Green, Martin Landray, et al. Uk biobank: an open access resource for identifying the causes of a wide range of com- plex diseases of middle and old age.PLoS medicine, 12(3): e1001779, 2015. 1, 2, 5, 6, 8, 3
2015
-
[28]
Long-term cancer survival prediction using multimodal deep learning.Scientific Reports, 11(1):13505, 2021
Lu´ıs A Vale-Silva and Karl Rohr. Long-term cancer survival prediction using multimodal deep learning.Scientific Reports, 11(1):13505, 2021. 2, 5, 6
2021
-
[29]
Attention is all you need.Advances in neural information processing systems, 30, 2017
Ashish Vaswani, Noam Shazeer, Niki Parmar, Jakob Uszko- reit, Llion Jones, Aidan N Gomez, Łukasz Kaiser, and Illia Polosukhin. Attention is all you need.Advances in neural information processing systems, 30, 2017. 2
2017
-
[30]
Shicai Wei, Chunbo Luo, and Yang Luo. Boosting multimodal learning via disentangled gradient learning.arXiv preprint arXiv:2507.10213, 2025. 2, 3, 4
Pith/arXiv arXiv 2025
-
[31]
Daft: A universal module to interweave tabular data and 3d images in cnns.NeuroImage, 260:119505, 2022
Tom Nuno Wolf, Sebastian P ¨olsterl, Christian Wachinger, Alzheimer’s Disease Neuroimaging Initiative, et al. Daft: A universal module to interweave tabular data and 3d images in cnns.NeuroImage, 260:119505, 2022. 2, 5, 6, 8, 1
2022
-
[32]
A closer look at deep learning methods on tabular datasets.arXiv preprint arXiv:2407.00956, 2024
Han-Jia Ye, Si-Yang Liu, Hao-Run Cai, Qi-Le Zhou, and De-Chuan Zhan. A closer look at deep learning methods on tabular datasets.arXiv preprint arXiv:2407.00956, 2024. 2
arXiv 2024
-
[33]
A survey of large language models
Wayne Xin Zhao, Kun Zhou, Junyi Li, Tianyi Tang, Xiaolei Wang, Yupeng Hou, Yingqian Min, Beichen Zhang, Junjie Zhang, Zican Dong, et al. A survey of large language models. arXiv preprint arXiv:2303.18223, 1(2), 2023. 2
Pith/arXiv arXiv 2023
-
[34]
Multi-transsp: Multimodal transformer for survival prediction of nasopharyngeal carcinoma patients
Hanci Zheng, Zongying Lin, Qizheng Zhou, Xingchen Peng, Jianghong Xiao, Chen Zu, Zhengyang Jiao, and Yan Wang. Multi-transsp: Multimodal transformer for survival prediction of nasopharyngeal carcinoma patients. InInternational Con- ference on Medical Image Computing and Computer-Assisted Intervention, pages 234–243. Springer, 2022. 2 No Data? No Problem: ...
2022
-
[252]
2, 5, 6, 8, 1
Springer, 2020. 2, 5, 6, 8, 1
2020
discussion (0)
Sign in with ORCID, Apple, or X to comment. Anyone can read and Pith papers without signing in.