REVIEW 5 major objections 6 minor 39 references
High pressure effects on the benzene pre-crystallization metastable states
T0 review · 5 major / 6 minor · reviewed 2026-08-14 · deepseek-v4-flash
Pith's one-line read Benzene's supercooled liquid state disappears at 2200 atm and 356 K
desk verdict New benzene metastability data at pressure, but the endpoint claim is unsupported by the paper's own fits and table. read the letter →
The pith
A machine-rendered reading of the paper's core claim, the machinery that carries it, and where it could break.
The reading
What carries the argument
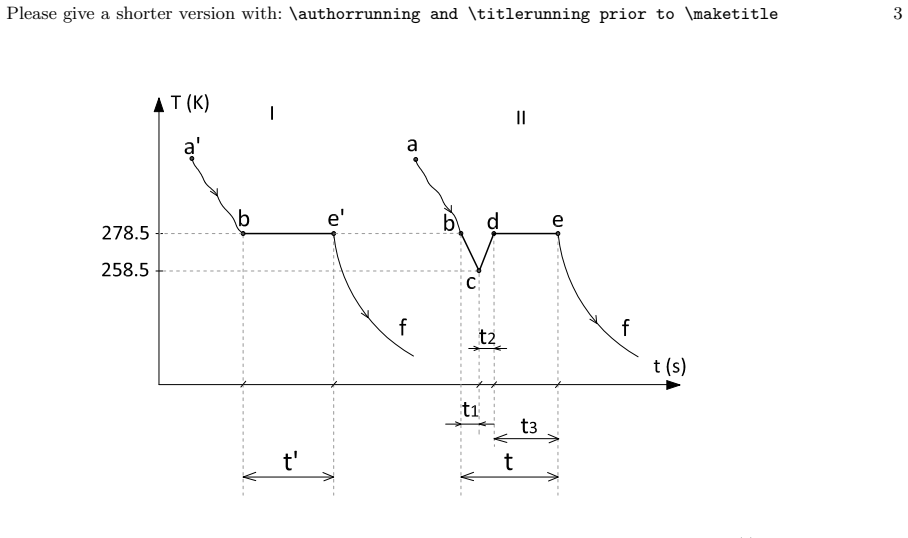
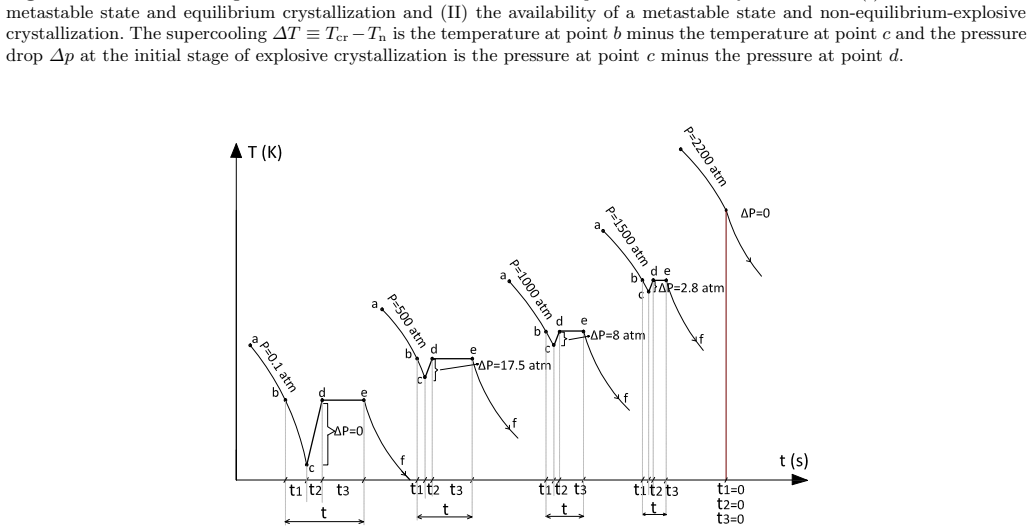
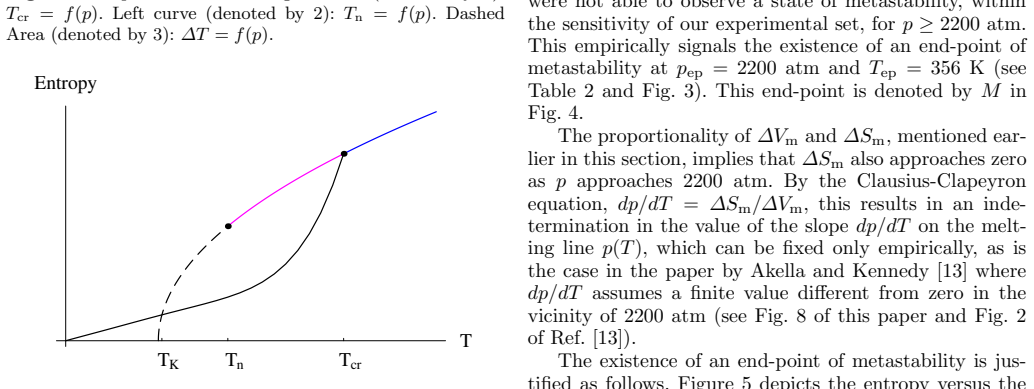
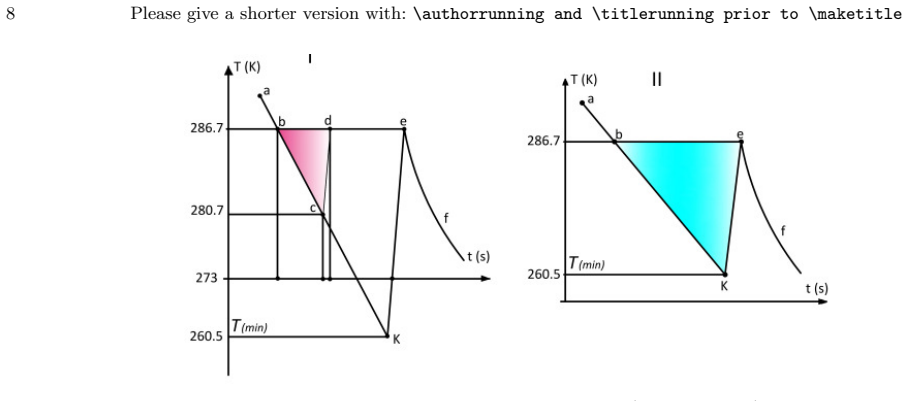
The load-bearing object is the set of metastable-state parameters read from cooling thermograms at fixed pressure: supercooling $\Delta T$, pressure drop $\Delta p$, incubation period $t_1$, abrupt transition time $t_2$, and isothermal freezing time $t_3$. Their joint vanishing is channelled through the proportionality $\Delta T \propto \Delta p$ (Eq. 8): if one vanishes on the melting curve, the other must too, and the paper takes this as the signal that liquid metastability is absent. The physical mechanism proposed for the shrinkage is structural: under pressure, liquid benzene's T-shaped packing increasingly mimics the $Pbca$ orthorhombic structure of solid benzene, making the transition smoother, while the entropy argument via the Kauzmann temperature explains why the metastable band closes where it does.
What would settle it
Cool liquid benzene at pressures from 2000 to 2300 atm with cooling rates far below 0.85 K/s, or with larger samples, and look for a metastable plateau: if $\Delta T$ remains positive at 2200 atm, or if a plateau appears above it, the claimed end-point is a kinetic detection artifact; alternatively, direct calorimetric measurement of the supercooled liquid's entropy near 356 K would show whether the liquid entropy still exceeds the crystal entropy there, as required for a metastable liquid to exist.
Extended reading notes
Core claim
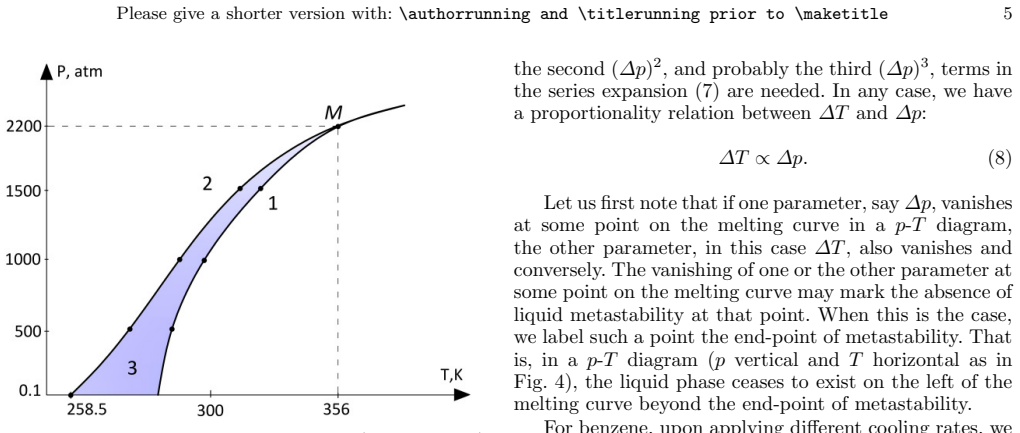
At a fixed cooling rate of 0.85 K/s, the freezing temperature $T_{\mathrm{cr}}$ rises from 278.5 K at 0.1 atm to 356.0 K at 2200 atm, while the nucleation temperature $T_n$ rises from 258.5 K to 356.0 K, so the supercooling $\Delta T = T_{\mathrm{cr}} - T_n$ falls from 20 K to 0 K. The pressure drop at explosive crystallization falls from 32 atm at 100 atm external pressure to zero, the incubation time from 160 s to zero, and the total solidification time from 426 s to zero. Quadratic fits to $T_{\mathrm{cr}}(p)$ and $T_n(p)$ intersect at $M = (2200\ \mathrm{atm},\ 356\ \mathrm{K})$, the claimed end-point of metastability. The paper argues that at this point $T_{\mathrm{cr}} \to T_n \to T_{\mathrm{K}}$, the Kauzmann temperature, so the liquid cannot exist in a metastable state below the crystallization temperature; it also reports that liquid and solid densities and heat capacities converge near $M$, which the authors read as a nearly continuous, possibly critical-like liquid-solid transition.
Load-bearing premise
The central claim rests on the assumption that the measured nucleation temperatures $T_n$ are close to the Kauzmann temperature $T_{\mathrm{K}}$ near 2200 atm, so the disappearance of metastability marks a true thermodynamic endpoint rather than the sensitivity limit of the apparatus; the authors acknowledge in a Sec. 4 footnote that the Kauzmann extrapolation is justified neither theoretically nor empirically.
Editorial extensions
If this is right
- If $M$ is a true end-point, liquid benzene cannot be supercooled at or above 2200 atm; no metastable plateau should appear there at any cooling rate or sample size.
- The quadratic formulas (2)–(6) give freezing temperatures, nucleation temperatures, supercooling, pressure drop, and solidification times at intermediate pressures up to 2200 atm without further measurement.
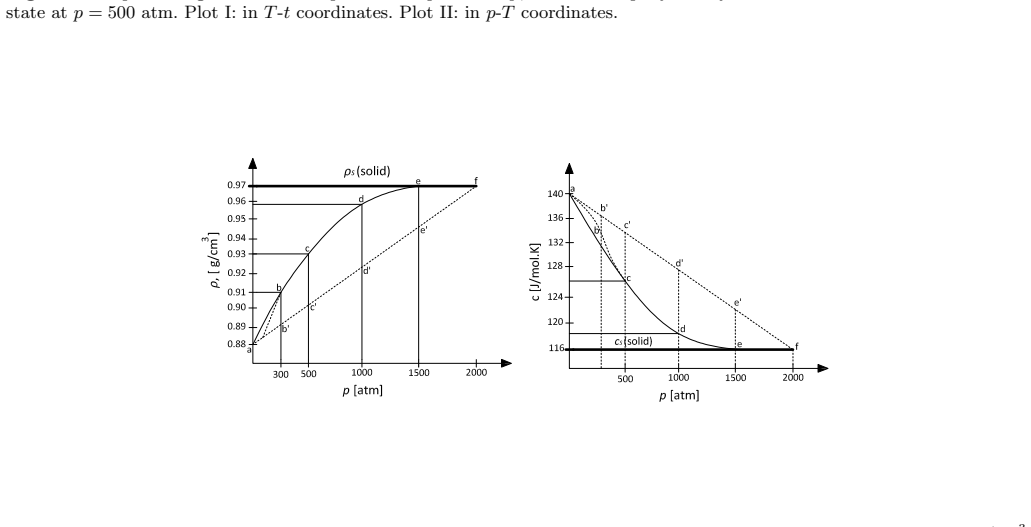
- Near $M$, liquid and solid densities and heat capacities converge; if $\Delta V_m \propto \Delta S_m$ holds, molar entropies converge as well, making the transition nearly continuous.
- Because metastability disappears at a finite point on the melting curve, the supercooling band has thickness $\Delta T(p)$ that goes to zero at 2200 atm, constraining where nucleation can be observed.
Reading between the lines
- A testable extension beyond the paper: measure nucleation at substantially slower cooling rates just below 2200 atm; if a metastable plateau reappears, the endpoint is an experimental detection limit rather than a thermodynamic one.
- If $T_n$ really tracks the Kauzmann temperature under pressure, then benzene offers a way to locate a Kauzmann temperature empirically; the same method could be applied to other molecular liquids whose melting curves are known.
- The near-critical reading implies that response functions such as isothermal compressibility or heat capacity might show anomalous growth near $M$; the paper does not measure them, but that is a direct consequence if $M$ behaves like a critical point.
- The paper itself notes in a Sec. 4 footnote that the Kauzmann extrapolation is justified neither theoretically nor empirically; taking that limitation seriously, the claim that $T_n \to T_{\mathrm{K}}$ at 2200 atm needs independent entropy or glass-transition data to stand.
Signed reviews
Editorial analysis
A structured set of objections, weighed in public.
Referee Report
Summary. The authors report constant-cooling-rate (0.85 K/s) crystallization experiments on liquid benzene in a sealed 10 cm^3 vessel at pressures from 0.1 to 2200 atm. They measure the freezing temperature Tcr, the lowest reachable nucleation temperature Tn, the supercooling ΔT = Tcr − Tn, the pressure drop Δp, the incubation period t1, the abrupt-transition time t2, the isothermal freezing time t3, and the total solidification time ttot. The paper claims that all metastability parameters decrease with pressure and vanish at an end-point M at p = 2200 atm and T = 356 K, where the metastable liquid ceases to exist, and that Tn approaches the Kauzmann temperature. Quadratic interpolation formulas are given for Tcr, Tn, Δp, t1, and ttot, and derived densities and molar heat capacities are tabulated. The paper also compares its melting curve with literature data and discusses a possible near-critical liquid-solid behavior.
Significance. If the end-point claim were reliably established, the result would be significant: it would locate a pressure-temperature point where supercooled benzene loses its metastability and where liquid and solid properties nearly merge, with implications for the liquid-solid critical-point debate. The experimental program spans 23 pressures, and the authors state explicit uncertainty estimates and compare with two literature datasets; the breadth of measured quantities is a genuine strength. However, the central claim is not supported by the paper's own fitting equations, the key identification Tn ≈ TK is asserted rather than measured, and the only endpoint evidence is a null observation at one cooling rate. Because the load-bearing evidence is internally inconsistent and partly circular, the significance cannot be realized in the present form.
major comments (5)
- [§3, Eqs. (2)–(3), Fig. 4] The published quadratic fits do not reproduce the claimed endpoint. Plugging p = 2200 atm into Eq. (2) gives Tcr ≈ 353.7 K and into Eq. (3) gives Tn ≈ 351.9 K, so the two curves do not meet at 356 K. The difference ΔT(p) = Tcr − Tn obtained from these fits vanishes at p ≈ 1964 atm (with a second spurious root near 1265 atm), not at 2200 atm. The interpolation formulas therefore contradict the central claim that all metastability parameters vanish at M, and Fig. 4 cannot be used to locate the endpoint.
- [Table 2] Table 2 contains arithmetic errors in the very quantities used to establish the trend to zero at 2200 atm. At p = 100 atm, Tcr − Tn = 12.0 K but the listed supercooling is 13.0 K. Several total times do not equal the stated component sums: at 100 atm, 131 + 3 + 210 = 344 s but ttot is listed as 343 s; at 600 atm, 61 + 1.5 + 97 = 159.5 s but ttot is listed as 159 s; at 2000 atm, 1 + 0.5 + 2 = 3.5 s but ttot is listed as 3.0 s. These inconsistencies undermine the quantitative basis of the paper's main empirical claim.
- [§4, End-point of the metastable state] The endpoint identification is circular. The paper asserts that for p < 2200 atm the nucleation temperatures Tn are 'much closer, if not equal, to their corresponding Kauzmann temperatures,' but no independent TK(p) measurement is provided. The only empirical evidence for the endpoint is the null observation that no metastability was seen for p ≥ 2200 atm at a cooling rate of 0.85 K/s in a 10 cm^3 vessel; a kinetic detection limit caused by rising nucleation rates would produce the same observation. Footnote 1 concedes that the Kauzmann extrapolation is 'justified neither theoretically nor empirically,' so the asserted Tn ≈ TK cannot carry the thermodynamic weight placed on it.
- [§5, Eqs. (9)–(12), Table 3] The density and heat-capacity calculation is calibrated to a single point and is not independent evidence for near-critical behavior. The parameter δ ≃ 2.7 in Eq. (9) is fixed by matching the 300-atm data point, and the same δ is then used at every pressure in Table 3. Table 3 also repeats arithmetic problems: at 300 atm, Δp/p = 23/300 ≈ 0.0767, not the listed 0.0670. The resulting ρl and Cl columns therefore do not provide the independent confirmation of the near-endpoint property convergence claimed in §6.
- [§4, Eqs. (7)–(8)] The proportionality ΔT ∝ Δp is asserted, not derived. Eq. (7) is a linear expansion whose own authors say requires second- and third-order terms near the triple point, and the step from that expansion to the unqualified proportionality in Eq. (8) is not justified. Similarly, the 'proportionality of ΔVm and ΔSm' invoked before the Clausius-Clapeyron argument is mentioned as if established, but no relation or derivation appears in the manuscript; reference [29] is cited without stating the form of the proportionality. The thermodynamic inference ΔSm → 0 at 2200 atm therefore lacks a demonstrated basis.
minor comments (6)
- [§2, §3, §4] Several grammatical and typographical slips should be corrected: 'an supercooling' in §3, 't in bounded from above' in §3, and 'sates' for 'states' in §6.
- [Fig. 8] The caption contains LaTeX artifacts, with axis labels rendered as 'T /LParen1K/RParen1' and 'p /LParen1atm/RParen1'; the figure and caption should be regenerated cleanly.
- [Table 3] Rows for p = 100 and 200 atm give ρl values (0.894 and 0.902 g/cm^3) but leave the columns Δp/p and Δρ/ρs blank; the derivation of those entries should be shown.
- [References] References 13 and 34 are the same paper (Akella and Kennedy, J. Chem. Phys. 55, 793 (1971)) and should not be cited twice; several other references (e.g., Refs. 4, 10, 25, 26) are non-standard or unpublished and should be either completed or removed.
- [Header] The PACS line reads 'PACS. –' with no codes; the authors should either supply PACS codes or delete the line.
- [§5] The notation for the liquid heat capacity and density is inconsistent (Cl and ρl are sometimes printed without subscripts), and the sentence giving the 300-atm ratio ΔC/(δCs) = 0.067 should be reconciled with the actual ΔC = 21 J/(mol K) and δ = 2.7, which gives 21/(2.7 × 116) ≈ 0.067, while Δp/p = 23/300 ≈ 0.0767.
Circularity Check
The critical-point-like conclusion rests on a fitted δ and on equating the measured Tn with the unmeasured Kauzmann temperature.
-
fitted input called prediction
[Sec. 5, Eqs. (9)-(12) and Table 3; Sec. 6, Concluding remarks]
"Admitting that, ∆p/p ≃ ∆ρ/ρs ≃ ∆C/δCs and δ≃ 2.7, (11) we obtain ρl≃ρs(1− ∆p/p), Cl≃Cs(1 +δ∆p/p). (12) The values of the parameters obtained from these formulas are given in Table 3."
δ is set to 2.7 so that at 300 atm the ratio ∆C/(δCs) matches ∆p/p by construction; no independent determination of δ or of the liquid density/heat capacity is made. Equation (12) then algebraically forces ρl→ρs and Cl→Cs as the input pressure drop ∆p/p→0. The near-equality of densities and heat capacities near M in Table 3 is therefore a restatement of the measured ∆p values, not an independent result. Using that near-equality in Sec. 6 as a 'sign that M might behave as a critical point' presents a fitted input as a calculated prediction.
-
self definitional
[Sec. 4, End-point of the metastable state, paragraphs after Fig. 5]
"Under extreme conditions of high pressure, as is the case with benzene, as the pressure reaches the value of pep = 2200 atm, Tcr→ Tn→ TK, that is the three temperature values are nearly equal. Since the liquid phase cannot exist below TK≃ Tcr, the metastable state ceases to exist too at the corresponding crystallization temperature of Tcr = Tep = 356 K. ... For the case of benzene we may claim that for p <2200 atm the nucleation temperatures Tn given in Table 2 are much closer, if not equal, to their corresponding Kauzmann temperatures."
No independent Kauzmann temperature TK(p) is measured or derived; the only empirical content behind 'Tcr→Tn→TK' is that the measured Tcr and Tn coincide at pressures where no supercooling was observed (Table 2). Declaring Tn≈TK for p<2200 equates the reached nucleation temperature with the thermodynamic Kauzmann temperature, so the justification reduces to defining the observed disappearance of metastability as the point where liquid cannot exist below TK. The Kauzmann reasoning thereby restates the operational endpoint rather than providing independent thermodynamic support, making the endpoint argument self-definitional.
full rationale
The raw experimental data in Table 2 are self-contained measurements of temperatures, pressures, and times, and no load-bearing self-citation chain or imported uniqueness theorem was found. However, two interpretive steps in the paper reduce by construction. First, the liquid densities and heat capacities in Table 3 are obtained from Eq. (12) using the measured ∆p/p as input, with the parameter δ fixed from a single pressure point; their convergence to solid values near the claimed endpoint is built into the formula. Second, the thermodynamic justification of the endpoint identifies the measured nucleation temperature Tn with the unmeasured Kauzmann temperature TK, so the statement Tcr→Tn→TK is effectively a relabeling of the observed vanishing of supercooling rather than an independent confirmation. These issues make the critical-point-like conclusion partially circular, although the experimental observations themselves are not fabricated or internally dependent on those interpretations.
Assumptions & free parameters
free parameters (6)
- δ (Eq. 9) =
2.7
- A1, B1, C1 for Tcr fit (Eq. 2) =
278.5 K, 7e-3 K/atm, 1.235e-5 K/atm^2
- A2, B2, C2 for Tn fit (Eq. 3) =
258.5 K, 3.3e-2 K/atm, 4.296e-6 K/atm^2
- A3, B3, C3 for Δp fit (Eq. 4) =
32 atm, 3.2e-2, 7.794e-6 atm^-1
- A4, B4, C4 for t1 fit (Eq. 5) =
160 s, 0.179 s/atm, 4.980e-5 s/atm^2
- A5, B5, C5 for ttot fit (Eq. 6) =
426 s, 0.480 s/atm, 1.342e-4 s/atm^2
assumptions (6)
- standard math Heat balance equation mxΔHfus ≈ Cp m ΔT (Eq. 1)
- standard math Clausius-Clapeyron relation and standard thermodynamics of metastable phases
- domain assumption Assumption that Tn measured in the experiments is the nucleation temperature
- domain assumption Assumption that benzene liquid structure mimics the Pbca solid under pressure
- ad hoc to paper Identification of Tn with Kauzmann temperature TK at high pressure
- ad hoc to paper Assumption that the disappearance of metastability at 2200 atm is a thermodynamic endpoint rather than a detection limit
Cite this review
Pith. "Pith review of High pressure effects on the benzene pre-crystallization metastable states." pith.science (2026). https://pith.science/paper/FOCW3I6B
@misc{pith2026190801550,
  author       = {Pith},
  title        = {Pith review of: High pressure effects on the benzene pre-crystallization metastable states},
  year         = {2026},
  howpublished = {\url{https://pith.science/paper/FOCW3I6B}},
  note         = {Machine review of arXiv:1908.01550}
}
read the original abstract
We report new results on the liquid to solid phase transition of benzene. We determine experimentally and investigate the properties of a number of parameters of the benzene metastable state under different pressures (from 0.1 up to 2200 atm). It is shown that the supercooling, pressure drop, incubation period, time of abrupt transition from the metastable state to the crystalline state, and time of isothermal freezing all decrease as the external pressure increases, then they all vanish at 2200 atm and 356 K which may mark the end-point of metastability. Quadratic interpolation formulas for these parameters are provided. The densities and molar heat capacities of supercooled benzene under different pressures have been calculated too.
Figures

Figures from the paper (6 more)


Reference graph
Works this paper leans on
-
[29]
V.P. Skripov and M.Z. Faizullin, Crystal-Liquid-Gas Phase Transitions and Thermodynamic Similarity , (WILEY-VCH Verlag GmbH & Co. KGaA, Weinheim, Germany, 2006)
work page 2006
- [1]
-
[2]
Knunyants, in Encyclopaedic Dictionary in Chemistry , Ed
I.L. Knunyants, in Encyclopaedic Dictionary in Chemistry , Ed. M. Acad., Soviet Encyclopedia (1983), p. 792
work page 1983
-
[3]
Glasstone, Theoretical Chemistry, (Boston College, New York, 1948), p
S. Glasstone, Theoretical Chemistry, (Boston College, New York, 1948), p. 632
work page 1948
-
[4]
Petersburg Publishers, Saint Petersburg, 1890-1907)
Benzene, Encyclopaedic Dictionary of Brockhaus and Efron [in Russian], (Leipzig and St. Petersburg Publishers, Saint Petersburg, 1890-1907)
work page 1907
-
[5]
L. Ciabini, F.A. Gorelli, M. Santoro, R. Bini, V. Schettino, and M. Mezouar, Phys. Rev. B 72 (2005) 094108
work page 2005
-
[6]
P.G. Debenedetti, Metastable Liquids: Concepts and Prin- ciples, (Priceton University Press, Princeton, NJ, 1996)
work page 1996
-
[7]
M. Azreg-A¨ ınou, A. H¨ useynov, and B.˙Ibrahimoˇ glu, J. of Chemical Physics, 124 (2006) 204505. Erratum: J. of Chem- ical Physics, 125 (2006) 099901
work page 2006
Show all 39 references
-
[8]
Papon, J
P. Papon, J. Leblond and P.H.E. Meijer, The Physics of Phase Transitions: Concepts and Applications , 2 nd revised edition, (Springer-Verlag Berlin Heidelberg, Germany, 2006)
2006
-
[9]
Kaldis (Ed.), Crystal Growth of Electronic Materials , (North-Holland, Amsterdam, 1985)
E. Kaldis (Ed.), Crystal Growth of Electronic Materials , (North-Holland, Amsterdam, 1985)
1985
-
[10]
˙Ibrahimoˇ glu, Y.M
B. ˙Ibrahimoˇ glu, Y.M. Naziyev, and N.F. Aliyev, Contri- bution to the Scientific and Technical Congress on Heat Pro- cesses, Baku, Azerbaijan, (1992) unpublished
1992
-
[11]
Alexandrov, Kinetics of Nucleation and Mass Crys- tallization of Supercooled Liquid and Amorphous Media [in Russian], (Donbas, Donetsk, Ukraine, 2011), p
V.D. Alexandrov, Kinetics of Nucleation and Mass Crys- tallization of Supercooled Liquid and Amorphous Media [in Russian], (Donbas, Donetsk, Ukraine, 2011), p. 592
2011
-
[12]
Kikoin (Ed.), Table of Physical Quantities
I.K. Kikoin (Ed.), Table of Physical Quantities. Reference Book, (Atomizdat, Moscow, 1976), p. 1008
1976
-
[13]
Akella and G.C
J. Akella and G.C. Kennedy, J. Chem Phys 55 (1971) 793- 796
1971
-
[14]
Kauzmann, Chem
W. Kauzmann, Chem. Rev., 43 (1948) 219-256
1948
-
[15]
Stillinger, J
F.H. Stillinger, J. Chem. Phys., 88 (1988) 7818-7825
1988
-
[16]
˘Cernoˇ sek, J
Z. ˘Cernoˇ sek, J. Holubov´ a, and E.˘Cernoˇ skov´ a, J. Optoelec- tronics and Advanced Materials, 7 (2005) 2941-2944
2005
-
[17]
Holubov´ a, E
J. Holubov´ a, E. ˘Cernoˇ skov´ a, and Z.˘Cernoˇ sek, J. Therm. Anal. Calorim., 111 (2013) 1633-1638
2013
-
[18]
Cassel and R
B. Cassel and R. Packer, https://www.perkinelmer.com/CMSResources/Images/44- 74834TCH DSCandDSC8500.pdf
-
[19]
Hunter and J.K.M
C.A. Hunter and J.K.M. Sanders, J. Am. Chem. Soc. 112 (1990) 5525
1990
-
[20]
Baker and G.H
C.M. Baker and G.H. Grant, J. Chem. Theory Comput. 2 (2006) 947
2006
-
[21]
X.-D. Wen, R. Hoffmann, and N.W. Ashcroft, J. Am. Chem. Soc. 133 (2011) 9023-9035
2011
-
[22]
Azadi and R.E
S. Azadi and R.E. Cohen, J. of Chemical Physics, 145 (2016) 064501
2016
-
[23]
Yokoyama, T
C. Yokoyama, T. Ebina, and S. Takahashi, Fluid Phase Equilibria, 84 (1993) 207-223
1993
-
[24]
Samsonov, S.A
V.M. Samsonov, S.A. Vasilyev, I.V. Talyzin, Yu.A. Ryzhkov, Jetp Lett., 103 (2016) 94
2016
-
[25]
Farzaliev and A.M
B.I. Farzaliev and A.M. Ragimov, Proceedings of the Azer- baijan National Academy of Sciences, 12 (ANAS, 1984) (in Russian)
1984
-
[26]
Farzaliev and N.F
B.I. Farzaliev and N.F. Aliev, Proceedings of the Science Conference AzTu, Vol.21 (AzTU, Baku, 1992) (in Russian)
1992
-
[27]
Veziroglu et al
T.N. Veziroglu et al. (editors), Hydrogen Materials Science and Chemistry of Carbon Nanomaterials , (Kluwer Academic Publishers, Netherlands, 2004)
2004
-
[28]
Haynes (editor-in-chief), CRC Handbook of Chem- istry and Physics, 96th edition, (CRC Press, Taylor and Fran- cis Group, Boca Raton, FL, 2015)
W.M. Haynes (editor-in-chief), CRC Handbook of Chem- istry and Physics, 96th edition, (CRC Press, Taylor and Fran- cis Group, Boca Raton, FL, 2015)
2015
-
[30]
Pruzan, D.H
Ph. Pruzan, D.H. Liebenberg and R.L. Mills, J. Phys. Chem. Solids 47 (1986) 949-961
1986
-
[31]
Figui` ere P, A.H
P. Figui` ere P, A.H. Fuchs, M. Ghelfenstein and H. Szwarc, J. Phys. Chem. Solids 39 (1978) 19-24
1978
-
[32]
Yurtseven and T
H. Yurtseven and T. ¨Unsal, Tsinghua Science and Tech- nology 12 (2007) 624-628
2007
-
[33]
Bridgman, J
P.W. Bridgman, J. Chem. Phys., 9 (1941) 794-797
1941
-
[34]
Akella and G.C
J. Akella and G.C. Kennedy, J. Chem. Phys., 55 (1971) 793-796
1971
-
[35]
Cansell, D
F. Cansell, D. Fabre and J.P. Petitet, J. Chem. Phys., 99 (1993) 7300-7304
1993
-
[36]
Thi´ ery and J.M
M.M. Thi´ ery and J.M. L´ eger, J. Chem. Phys.,88 (1988) 4255-4271
1988
-
[37]
Ciabini, M
L. Ciabini, M. Santoro, F.A. Gorelli, R. Bini, V. Schettino and S. Raugei, Nature Mater., 6 (2007) 39-43
2007
-
[38]
Ostwald, Z
W. Ostwald, Z. Physik Chem. 22 (1897) 286
-
[39]
Cheng, Phase Transitions in Polymers - The Role of Metastable States , (Elsevier Science B.V., 2008)
S.Z.D. Cheng, Phase Transitions in Polymers - The Role of Metastable States , (Elsevier Science B.V., 2008)
2008
Reviewed August 14, 2026 · model on record in the stance chip above.
Discussion (0). Continue with ORCID to comment.