REVIEW 3 major objections 4 minor 1 cited by
The ParClusterers Benchmark Suite (PCBS): A Fine-Grained Analysis of Scalable Graph Clustering
T0 review · 3 major / 4 minor · reviewed 2026-08-12 · deepseek-v4-flash
Pith's one-line read A benchmark of eleven parallel graph clustering algorithms finds correlation clustering leading on three of four tasks and a hierarchical method leading on the fourth—both types of method absent from many popular toolkits.
desk verdict A genuinely useful benchmark suite and dataset, with one real methodological soft spot in the NGrams task that should be fixed or heavily caveated before publication. read the letter →
The pith
A machine-rendered reading of the paper's core claim, the machinery that carries it, and where it could break.
The reading
What carries the argument
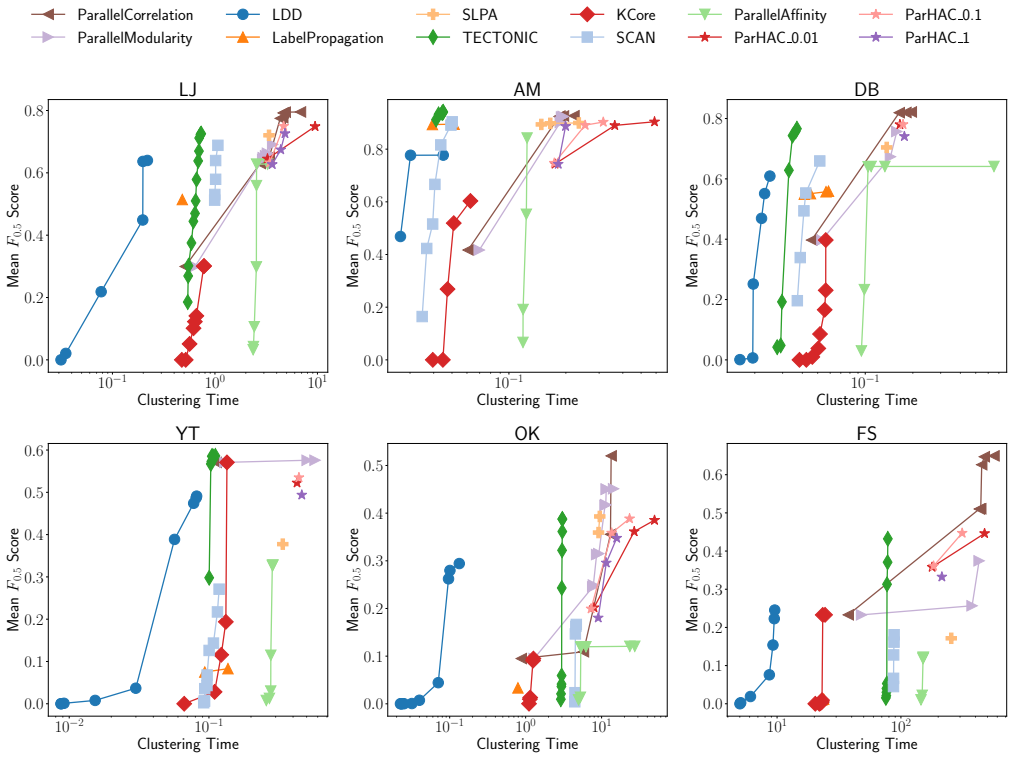
The load-bearing machinery is the LambdaCC objective, a single parameterized objective that interpolates between modularity and correlation clustering through vertex weights and a resolution parameter; the paper's parallel Louvain-style local-search-and-contraction optimizer maximizes it, so one implementation covers both algorithm families. Around this sit the other central mechanisms: ParHAC's approximate agglomerative clustering, whose dendrogram can be cut at any resolution to give clusterings at many granularities, and the benchmark methodology itself, which sweeps a Cartesian product of parameter settings and reports Pareto frontiers of precision versus recall and of F0.5 score versus runtime. The Pareto frontiers are what let the paper rank algorithms across tasks rather than at a single default parameter.
What would settle it
Re-label the NGrams pairs using an independent source of near-duplicate truth—for example, labels from a different embedding model or human judgments—and rerun the benchmark on the same 50-nearest-neighbor graph; if ParHAC and affinity clustering no longer top the precision-recall AUC table, the high-resolution result is an artifact of label construction. A second check is to run label propagation and SLPA with many random seeds and compare their quality spread with the observed differences between algorithms.
Extended reading notes
Core claim
The paper's core discovery is that the best-quality algorithms are not the ones most toolkits ship. Correlation clustering, implemented through the LambdaCC objective with a parallel Louvain-style optimizer, achieves the highest precision-recall area under the curve on community detection, vector-embedding clustering, and dense subgraph partitioning, while ParHAC, an approximate parallel hierarchical agglomerative clustering algorithm, achieves the highest AUC on the high-resolution task of finding near-duplicate short texts. Modularity clustering, the best commonly available method in existing toolkits, is rarely better. The same experiments show the PCBS implementations are consistently faster than corresponding implementations in other libraries and databases, which the paper attributes to theoretically efficient algorithms, careful engineering, and an efficient parallel graph framework.
Load-bearing premise
The high-resolution task's ground-truth labels come from thresholding the same embedding similarities that define the graph's edge weights, so the ranking on that task assumes those similarities are the right notion of truth rather than a construction artifact.
Editorial extensions
If this is right
- If correlation clustering truly leads on three tasks, toolkit maintainers now have a concrete reason to ship a scalable correlation clustering implementation.
- If ParHAC's advantage on high-resolution clustering holds, near-duplicate detection on large text corpora can be produced from a single dendrogram cut instead of many thresholded runs.
- The measured speed gaps imply that quality-oriented clustering at billion-edge scale is practical on one multicore machine rather than requiring a graph database.
- The Pareto-frontier methodology implies that future algorithm evaluations should report quality across a range of resolutions, since single-parameter comparisons can miss which method wins each operating point.
Reading between the lines
- Editorial inference: The NGrams ground truth is generated by thresholding the same embedding dot-product similarities that define the graph's edge weights, so the high-resolution ranking may partly reflect the label construction; re-running with independently derived labels would test that.
- Editorial inference: The paper reports single runs for the nondeterministic label propagation and SLPA algorithms, so their close rankings may change under run-to-run variance; multi-seed reporting would quantify that.
- Editorial inference: Because the benchmark separates quality and runtime, it suggests the notion of the 'best' algorithm is task-dependent, and the same suite could be extended to domain-specific metrics such as cluster diameter or triangle density for dense-subgraph applications.
Editorial analysis
A structured set of objections, weighed in public.
Referee Report
Summary. The paper introduces PCBS, a benchmark suite that packages eleven parallel graph clustering algorithms, a set of quality metrics, and an evaluation harness, together with new weighted graph datasets derived from embeddings and a new NGrams near-duplicate dataset with ground-truth labels. The authors compare PCBS implementations against NetworKit, Neo4j, TigerGraph, and SNAP across four tasks: community detection, vector embedding clustering, dense subgraph partitioning, and high-resolution clustering. They report that PCBS is substantially faster than the baselines on most workloads, that correlation clustering obtains the highest quality on three of the four tasks, and that ParHAC is best on the high-resolution NGrams task. The manuscript also includes a comparative study of modularity-optimization implementations and an appendix with additional datasets and scalability experiments.
Significance. If the results hold, PCBS is a useful community resource for benchmarking scalable graph clustering: the code and datasets are released, the experimental configuration is described in detail, and the evaluation spans a broad collection of real and synthetic graphs. The paper also contributes a new large-scale text-similarity graph with many ground-truth labels. The speed comparisons are transparently scoped (hardware, thread counts, and configuration files are given), and the authors make the comparison methodology reusable. However, the headline algorithm-ranking conclusions are weakened by a circular ground-truth construction in the NGrams task and by an overstatement of the dense-subgraph-partitioning results; these issues affect the central claim that the best algorithm on every task has been identified.
major comments (3)
- [Section 3.5 / Appendix C.1] The NGrams ground-truth labels are generated by thresholding the same dot-product embedding similarities that define the edge weights of the 50-nearest-neighbor graph: pairs with similarity above 0.92 are labeled as belonging to the same cluster. This makes the high-resolution task partially a test of whether an algorithm can recover the label-generation threshold, not an independent measure of near-duplicate detection quality. The point is visible in Table 9, where the threshold-only Connectivity algorithm achieves AUC 0.77, tied with Correlation at 0.77 and only 0.06 below ParHAC-0.01 at 0.83. The Section 1 claim that ParHAC is the best algorithm on the fourth task is therefore not established as evidence of general clustering quality. Please re-generate the labels from an independent signal (e.g., human annotations, lexical overlap, or a different embedding model), or explicitly re-frame this task as a threshold-recovery sanity check and adjust the summary accordingly.
- [Section 3.1 and Tables 5-7] Label Propagation and SLPA are nondeterministic; Section 3.1 states that "the resulting clusterings can be different because of non-determinism in thread scheduling and randomization," yet all reported AUC and Pareto-frontier values are single-run measurements without multiple seeds or variance information. This is especially relevant in Table 5, where LP and SLPA receive AUC 0.00 on YouTube, Orkut, and Friendster; a few unlucky runs could materially change these table entries. Please report results averaged over multiple seeds with error bars or a sensitivity analysis for all nondeterministic algorithms, or clearly justify the single-run methodology.
- [Section 3.4 vs. Section 1 Key Results] The Key Results claim that "correlation clustering obtains the highest quality on three out of four tasks" is not supported for the dense subgraph partitioning task. Section 3.4 states that modularity clustering produces denser clusters when the number of clusters is small and that correlation clustering only produces denser clusters when the number of clusters is very large. This is a task-dependent tradeoff, not a clear win for correlation clustering. Please revise the summary and Section 3.4 to reflect this mixed result, and provide per-task summary tables that make the basis of any "best algorithm" claim explicit.
minor comments (4)
- [Tables 7 and 9] The NGrams AUC data appears in both Table 7 and Table 9 with identical content; one of these tables should be removed or renumbered.
- [Appendix C.1] In the label-generation description, "among all embeddings whose similarity to x belongs to [s, s+1)" should presumably read "[s, s+0.01)" to match the bucket definition stated in the preceding bullet; as written, the interval spans 0.24 rather than 0.01.
- [Abstract] The abstract contains a grammatical error: "algorithms that not included in many popular graph clustering toolkits" should be "algorithms that are not included in many popular graph clustering toolkits."
- [Section 2.3.2] The SCAN structural similarity formula would benefit from an extra pair of parentheses or a displayed equation; the current inline rendering of the square-root denominator is easy to misread.
Circularity Check
NGrams high-resolution labels are thresholded from the same embedding similarities that define the graph, partially forcing the fourth-task ranking; the other three tasks and speedup results are externally grounded.
-
self definitional
[Section 3 (Datasets) and Appendix C.1]
"The similarity between two embeddings is obtained by computing their dot product. ... We compute an exact 50-nearest neighbor graph and make it undirected. ... Finally, we labeled these pairs based on their embedding similarity, designating pairs with a similarity above 0.92 as belonging to the same cluster and the rest as belonging to different clusters."
The NGrams task's ground-truth labels are generated by thresholding the same embedding dot-product similarities that determine the graph's nearest-neighbor structure and edge weights. Thus the task is to recover the label-generation rule from the very signal the weighted algorithms consume: any clustering that places high-similarity neighbors together will score well by construction, independent of an external notion of near-duplication. This is visible in Table 9, where threshold-only Connectivity reaches AUC 0.77, tied with Correlation and only 0.06 below ParHAC-0.01's 0.83. The headline claim that ParHAC is best on the fourth task is therefore partly an artifact of label construction rather than independent evidence of general clustering quality.
full rationale
The paper's central claims are an empirical benchmark against external ground truth (SNAP communities, MNIST, ImageNet, Reddit, StackExchange classes) and independent baseline implementations (NetworKit, Neo4j, TigerGraph, SNAP). The use of the authors' own prior implementations of ParHAC, affinity clustering, and correlation clustering is not load-bearing circularity: those algorithms are evaluated against external labels and compared with independent libraries, so the findings are independently checkable. The only notable self-referential element is the NGrams high-resolution task, where the ground truth is thresholded from the same embedding similarity that defines the graph. This partially forces the fourth-task ranking and weakens the specific claim that ParHAC is the best algorithm on that task, but it does not compromise the other three task conclusions or the speedup comparisons. On the stated scale, this is a minor partial circularity rather than a central derivation that reduces to its inputs.
Assumptions & free parameters
free parameters (5)
- NGrams label threshold t =
0.92
- k for kNN graphs =
50 (10 and 100 in appendix)
- F-score beta =
0.5
- AUC precision cutoff =
0.5
- SNAP ground-truth size =
top 5000 communities
assumptions (4)
- domain assumption The top-5000 SNAP communities are a valid ground truth for community detection.
- domain assumption Embedding similarity (1/(1+distance) or dot product) is a faithful proxy for class or semantic similarity.
- domain assumption Matching each ground-truth community to the single largest-overlap cluster is an unbiased evaluation procedure.
- domain assumption The shared-memory multicore setting is the right regime for scalable graph clustering.
Cite this review
Pith. "Pith review of The ParClusterers Benchmark Suite (PCBS): A Fine-Grained Analysis of Scalable Graph Clustering." pith.science (2026). https://pith.science/paper/FWAPB5EF
@misc{pith2026241110290,
  author       = {Pith},
  title        = {Pith review of: The ParClusterers Benchmark Suite (PCBS): A Fine-Grained Analysis of Scalable Graph Clustering},
  year         = {2026},
  howpublished = {\url{https://pith.science/paper/FWAPB5EF}},
  note         = {Machine review of arXiv:2411.10290}
}
read the original abstract
We introduce the ParClusterers Benchmark Suite (PCBS) -- a collection of highly scalable parallel graph clustering algorithms and benchmarking tools that streamline comparing different graph clustering algorithms and implementations. The benchmark includes clustering algorithms that target a wide range of modern clustering use cases, including community detection, classification, and dense subgraph mining. The benchmark toolkit makes it easy to run and evaluate multiple instances of different clustering algorithms, which can be useful for fine-tuning the performance of clustering on a given task, and for comparing different clustering algorithms based on different metrics of interest, including clustering quality and running time. Using PCBS, we evaluate a broad collection of real-world graph clustering datasets. Somewhat surprisingly, we find that the best quality results are obtained by algorithms that not included in many popular graph clustering toolkits. The PCBS provides a standardized way to evaluate and judge the quality-performance tradeoffs of the active research area of scalable graph clustering algorithms. We believe it will help enable fair, accurate, and nuanced evaluation of graph clustering algorithms in the future.
Figures


Figures from the paper (20 more)




Forward citations
Cited by 1 Pith paper
-
Parallel Hierarchical Agglomerative Clustering in Low Dimensions
Centroid and Ward's hierarchical agglomerative clustering admit polylogarithmic-depth parallel algorithms in low dimensions via a new proof that their dendrograms are shallow.
Reference graph
Works this paper leans on
-
[1]
Amazon Neptune
[n.d.]. Amazon Neptune. https://aws.amazon.com/neptune/
-
[2]
ArangoDB
[n.d.]. ArangoDB. https://www.arangodb.com/
-
[3]
Memgraph
[n.d.]. Memgraph. https://memgraph.com/
-
[4]
NebulaGraph
[n.d.]. NebulaGraph. https://nebula-graph.io/
-
[5]
[n.d.]. Neo4j. https://neo4j.com/
- [6]
-
[7]
[n.d.]. textembedding-gecko@003 model. https://cloud.google.com/vertex- ai/generative-ai/docs/embeddings/get-text-embeddings
- [8]
Show all 84 references
-
[9]
Arthur Asuncion and David Newman. 2007. UCI machine learning repository
2007
-
[10]
Bader, Andrea Kappes, Henning Meyerhenke, Peter Sanders, Christian Schulz, and Dorothea Wagner
David A. Bader, Andrea Kappes, Henning Meyerhenke, Peter Sanders, Christian Schulz, and Dorothea Wagner. 2014. Benchmarking for Graph Clustering and Partitioning. In Encyclopedia of Social Network Analysis and Mining . Springer, 73–82
2014
-
[11]
Nikhil Bansal, Avrim Blum, and Shuchi Chawla. 2004. Correlation clustering. Machine learning 56 (2004), 89–113
2004
-
[12]
MohammadHossein Bateni, Soheil Behnezhad, Mahsa Derakhshan, Moham- madTaghi Hajiaghayi, Raimondas Kiveris, Silvio Lattanzi, and Vahab Mirrokni
-
[13]
Maciej Besta, Emanuel Peter, Robert Gerstenberger, Marc Fischer, Michał Pod- stawski, Claude Barthels, Gustavo Alonso, and Torsten Hoefler. 2019. Demys- tifying graph databases: Analysis and taxonomy of data organization, system designs, and graph queries. arXiv preprint arXiv...
2019 arXiv
-
[15]
Bhatia, K
K. Bhatia, K. Dahiya, H. Jain, P. Kar, A. Mittal, Y. Prabhu, and M. Varma. 2016. The extreme classification repository: Multi-label datasets and code. http: //manikvarma.org/downloads/XC/XMLRepository.html
2016
-
[16]
Blelloch, Daniel Anderson, and Laxman Dhulipala
Guy E. Blelloch, Daniel Anderson, and Laxman Dhulipala. 2020. ParlayLib - A Toolkit for Parallel Algorithms on Shared-Memory Multicore Machines. In Proceedings of the 32nd ACM Symposium on Parallelism in Algorithms and Archi- tectures (Virtual Event, USA) (SPAA ’20). Associati...
2020
-
[17]
Vincent D Blondel, Jean-Loup Guillaume, Renaud Lambiotte, and Etienne Lefeb- vre. 2008. Fast unfolding of communities in large networks. Journal of statistical mechanics: theory and experiment 2008, 10 (2008), P10008
2008
-
[18]
Alessandro Camerra, Jin Shieh, Themis Palpanas, Thanawin Rakthanmanon, and Eamonn Keogh. 2014. Beyond one billion time series: indexing and mining very large time series collections𝑖SAX2+. Knowledge and Information Systems 39, 1 (2014), 123–151
2014
-
[19]
José E Chacón and Ana I Rastrojo. 2023. Minimum adjusted Rand index for two clusterings of a given size. Advances in Data Analysis and Classification 17, 1 (2023), 125–133
2023
-
[20]
Deepayan Chakrabarti, Yiping Zhan, and Christos Faloutsos. 2004. R-MAT: A Recursive Model for Graph Mining. In SIAM International Conference on Data Mining (SDM). 442–446
2004
-
[21]
Wen-Yen Chen, Yangqiu Song, Hongjie Bai, Chih-Jen Lin, and Edward Y Chang
-
[22]
Aaron Clauset, Mark EJ Newman, and Cristopher Moore. 2004. Finding commu- nity structure in very large networks. Physical review E 70, 6 (2004), 066111
2004
-
[23]
Leon Danon, Albert Diaz-Guilera, Jordi Duch, and Alex Arenas. 2005. Comparing community structure identification. Journal of statistical mechanics: Theory and experiment 2005, 09 (2005), P09008
2005
-
[24]
Jia Deng, Wei Dong, Richard Socher, Li-Jia Li, Kai Li, and Li Fei-Fei. 2009. Ima- geNet: A large-scale hierarchical image database. InIEEE Conference on Computer Vision and Pattern Recognition . 248–255
2009
-
[25]
Li Deng. 2012. The mnist database of handwritten digit images for machine learning research. IEEE Signal Processing Magazine 29, 6 (2012), 141–142
2012
-
[26]
Laxman Dhulipala, Guy Blelloch, and Julian Shun. 2017. Julienne: A Framework for Parallel Graph Algorithms Using Work-efficient Bucketing. In Proceedings of the Twentieth Annual Symposium on Parallelism in Algorithms and Architectures (SPAA)
2017
-
[27]
Blelloch, and Julian Shun
Laxman Dhulipala, Guy E. Blelloch, and Julian Shun. 2018. Theoretically Efficient Parallel Graph Algorithms Can Be Fast and Scalable. In ACM Symposium on Parallelism in Algorithms and Architectures (SPAA)
2018
-
[28]
Laxman Dhulipala, David Eisenstat, Jakub Łącki, Vahab Mirrokni, and Jessica Shi. 2021. Hierarchical agglomerative graph clustering in nearly-linear time. In International conference on machine learning . PMLR, 2676–2686
2021
-
[29]
Laxman Dhulipala, David Eisenstat, Jakub Lacki, Vahab Mirrokni, and Jessica Shi
-
[30]
Laxman Dhulipala, Changwan Hong, and Julian Shun. 2020. Connectit: A frame- work for static and incremental parallel graph connectivity algorithms. arXiv preprint arXiv:2008.03909 (2020)
2020 arXiv
-
[31]
Laxman Dhulipala, Jakub Łącki, Jason Lee, and Vahab Mirrokni. 2023. TeraHAC: Hierarchical agglomerative clustering of trillion-edge graphs. Proceedings of the ACM on Management of Data 1, 3 (2023), 1–27
2023
-
[32]
Dominguez-Sal, P
D. Dominguez-Sal, P. Urbón-Bayes, A. Giménez-Vañó, S. Gómez-Villamor, N. Martínez-Bazán, and J. L. Larriba-Pey. 2010. Survey of Graph Database Perfor- mance on the HPC Scalable Graph Analysis Benchmark. In Web-Age Information Management, Heng Tao Shen, Jian Pei, M. Tamer Özsu,...
2010
-
[33]
Matthijs Douze, Alexandr Guzhva, Chengqi Deng, Jeff Johnson, Gergely Szilvasy, Pierre-Emmanuel Mazaré, Maria Lomeli, Lucas Hosseini, and Hervé Jégou. 2024. The faiss library. arXiv preprint arXiv:2401.08281 (2024)
2024 arXiv
-
[34]
Paola Festa, Panos M Pardalos, Mauricio GC Resende, and Celso C Ribeiro. 2002. Randomized heuristics for the MAX-CUT problem. Optimization methods and software 17, 6 (2002), 1033–1058
2002
-
[35]
Santo Fortunato. 2010. Community detection in graphs. Physics reports 486, 3-5 (2010), 75–174
2010
-
[36]
Girvan and M
M. Girvan and M. E. J. Newman. 2002. Community Structure in Social and Biological Networks. Proceedings of the National Academy of Sciences (PNAS) 99, 12 (2002), 7821–7826
2002
-
[37]
Yoav Goldberg and Jon Orwant. 2013. A dataset of syntactic-ngrams over time from a very large corpus of english books. In Second Joint Conference on Lex- ical and Computational Semantics (* SEM), Volume 1: Proceedings of the Main Conference and the Shared Task: Semantic Textua...
2013
-
[38]
Fred G Gustavson. 1972. Some basic techniques for solving sparse systems of linear equations. In Sparse Matrices and their Applications . Springer, 41–52
1972
-
[39]
2008.Exploring network structure, dynamics, and function using NetworkX
Aric Hagberg, Pieter Swart, and Daniel S Chult. 2008.Exploring network structure, dynamics, and function using NetworkX . Technical Report. Los Alamos National Lab.(LANL), Los Alamos, NM (United States)
2008
-
[40]
Lawrence Hubert and Phipps Arabie. 1985. Comparing partitions. Journal of classification 2 (1985), 193–218
1985
-
[41]
Siddhartha V Jayanti and Robert E Tarjan. 2016. A randomized concurrent algorithm for disjoint set union. In Proceedings of the 2016 ACM Symposium on Principles of Distributed Computing . 75–82
2016
-
[42]
Malik Sebastian Stær Knudsen, Laurits Almskou Brodal, Peter Kristoffer Peczalski, Atefeh Moradan, Davide Mottin, and Ira Assent. 2022. GraB: Graph Benchmark for Heterogeneous Graph Clustering. InThe First Learning on Graphs Conference
2022
-
[43]
Andrea Lancichinetti, Santo Fortunato, and János Kertész. 2009. Detecting the overlapping and hierarchical community structure in complex networks. New journal of physics 11, 3 (2009), 033015
2009
-
[44]
Jure Leskovec and Rok Sosič. 2016. Snap: A general-purpose network analysis and graph-mining library. ACM Transactions on Intelligent Systems and Technology (TIST) 8, 1 (2016), 1–20
2016
-
[45]
Ian XY Leung, Pan Hui, Pietro Lio, and Jon Crowcroft. 2009. Towards real-time community detection in large networks. Physical Review E 79, 6 (2009), 066107
2009
-
[46]
Zehan Li, Xin Zhang, Yanzhao Zhang, Dingkun Long, Pengjun Xie, and Meishan Zhang. 2023. Towards general text embeddings with multi-stage contrastive learning. arXiv preprint arXiv:2308.03281 (2023)
2023 arXiv
-
[47]
Zhuang Liu, Hanzi Mao, Chao-Yuan Wu, Christoph Feichtenhofer, Trevor Darrell, and Saining Xie. 2022. A ConvNet for the 2020s. Proceedings of the IEEE/CVF Conference on Computer Vision and Pattern Recognition (CVPR) (2022)
2022
-
[48]
Seiji Maekawa, Jianpeng Zhang, George Fletcher, and Makoto Onizuka. 2019. General generator for attributed graphs with community structure. InProceedings of the ECML/PKDD Graph Embedding and Mining Workshop . 1–5
2019
-
[49]
Christopher D Manning, Prabhakar Raghavan, and Hinrich Schütze. 2008. Intro- duction to Information Retrieval . Cambridge University Press
2008
-
[50]
Magdalen Dobson Manohar, Zheqi Shen, Guy Blelloch, Laxman Dhulipala, Yan Gu, Harsha Vardhan Simhadri, and Yihan Sun. 2024. ParlayANN: Scalable and Deterministic Parallel Graph-Based Approximate Nearest Neighbor Search Algo- rithms. In Proceedings of the 29th ACM SIGPLAN Annual...
2024
-
[51]
Aaron F McDaid, Derek Greene, and Neil Hurley. 2011. Normalized mutual in- formation to evaluate overlapping community finding algorithms. arXiv preprint arXiv:1110.2515 (2011)
2011 arXiv
-
[52]
Gary L Miller, Richard Peng, and Shen Chen Xu. 2013. Parallel graph decom- positions using random shifts. In Proceedings of the twenty-fifth annual ACM symposium on Parallelism in algorithms and architectures . 196–203
2013
-
[53]
Nicholas Monath, Kumar Avinava Dubey, Guru Guruganesh, Manzil Zaheer, Amr Ahmed, Andrew McCallum, Gokhan Mergen, Marc Najork, Mert Terzihan, Bryon Tjanaka, et al. 2021. Scalable hierarchical agglomerative clustering. In Proceedings of the 27th ACM SIGKDD Conference on knowledg...
2021
-
[54]
Niklas Muennighoff, Nouamane Tazi, Loic Magne, and Nils Reimers. 2023. MTEB: Massive Text Embedding Benchmark. In Proceedings of the 17th Conference of the European Chapter of the Association for Computational Linguistics , Andreas Vla- chos and Isabelle Augenstein (Eds.). Ass...
2023 doi
-
[55]
Mark EJ Newman and Michelle Girvan. 2004. Finding and evaluating community structure in networks. Physical review E 69, 2 (2004), 026113
2004
-
[56]
Andrew Ng, Michael Jordan, and Yair Weiss. 2001. On spectral clustering: Anal- ysis and an algorithm. Advances in neural information processing systems 14 (2001)
2001
-
[57]
Günce Keziban Orman, Vincent Labatut, and Hocine Cherifi. 2011. Qualitative comparison of community detection algorithms. In Digital Information and Com- munication Technology and Its Applications: International Conference, DICTAP 2011, Dijon, France, June 21-23, 2011, Proceed...
2011
-
[58]
Günce Keziban Orman, Vincent Labatut, and Hocine Cherifi. 2012. Comparative evaluation of community detection algorithms: a topological approach. Journal of Statistical Mechanics: Theory and Experiment 2012, 08 (2012), P08001
2012
-
[59]
Minhyuk Park, Yasamin Tabatabaee, Vikram Ramavarapu, Baqiao Liu, Vidya Ka- math Pailodi, Rajiv Ramachandran, Dmitriy Korobskiy, Fabio Ayres, George Chacko, and Tandy Warnow. 2023. Identifying Well-Connected Communities in Real-World and Synthetic Networks. In International Con...
2023
-
[60]
Md Mostofa Ali Patwary, Suren Byna, Nadathur Rajagopalan Satish, Narayanan Sundaram, Zarija Lukić, Vadim Roytershteyn, Michael J Anderson, Yushu Yao, Pradeep Dubey, et al. 2015. BD-CATS: big data clustering at trillion particle scale. In Proceedings of the International Confer...
2015
-
[61]
Usha Nandini Raghavan, Réka Albert, and Soundar Kumara. 2007. Near linear time algorithm to detect community structures in large-scale networks. Physical review E 76, 3 (2007), 036106
2007
-
[62]
Jörg Reichardt and Stefan Bornholdt. 2006. Statistical Mechanics of Community Detection. Phys. Rev. E 74 (Jul 2006), 016110. Issue 1
2006
-
[63]
Alon Shalita, Brian Karrer, Igor Kabiljo, Arun Sharma, Alessandro Presta, Aaron Adcock, Herald Kllapi, and Michael Stumm. 2016. Social hash: an assignment framework for optimizing distributed systems operations on social networks. In USENIX Symposium on Networked Systems Desig...
2016
-
[64]
Jessica Shi, Laxman Dhulipala, David Eisenstat, Jakub Łăcki, and Vahab Mirrokni
-
[65]
Lizhen Shi and Bo Chen. 2020. Comparison and Benchmark of Graph Clustering Algorithms. arXiv preprint arXiv:2005.04806 (2020)
2020 arXiv
-
[66]
Jyothish Soman and Ankur Narang. 2011. Fast community detection algorithm with gpus and multicore architectures. In 2011 IEEE International Parallel & Distributed Processing Symposium. IEEE, 568–579
2011
-
[67]
Staudt and Henning Meyerhenke
Christian L. Staudt and Henning Meyerhenke. 2016. Engineering Parallel Algo- rithms for Community Detection in Massive Networks. IEEE Transactions on Parallel and Distributed Systems 27, 1 (2016), 171–184. https://doi.org/10.1109/ TPDS.2015.2390633
2016
-
[68]
Christian L Staudt, Aleksejs Sazonovs, and Henning Meyerhenke. 2016. Net- worKit: A tool suite for large-scale complex network analysis. Network Science 4, 4 (2016), 508–530
2016
-
[69]
Vincent A Traag, Ludo Waltman, and Nees Jan Van Eck. 2019. From Louvain to Leiden: guaranteeing well-connected communities. Scientific reports 9, 1 (2019), 5233
2019
-
[70]
Tom Tseng, Laxman Dhulipala, and Julian Shun. 2021. Parallel index-based structural graph clustering and its approximation. In Proceedings of the 2021 International Conference on Management of Data . ACM
2021
-
[71]
Tom Tseng, Laxman Dhulipala, and Julian Shun. 2021. Parallel Index-Based Structural Graph Clustering and Its Approximation. In International Conference on Management of Data . 1851–1864
2021
-
[72]
Anton Tsitsulin, John Palowitch, Bryan Perozzi, and Emmanuel Müller. 2023. Graph clustering with graph neural networks. Journal of Machine Learning Research 24, 127 (2023), 1–21
2023
-
[73]
Charalampos E Tsourakakis, Jakub Pachocki, and Michael Mitzenmacher. 2017. Scalable motif-aware graph clustering. In Proceedings of the 26th International Conference on World Wide Web. 1451–1460
2017
-
[74]
Nate Veldt, David F Gleich, and Anthony Wirth. 2018. A correlation clustering framework for community detection. In Proceedings of the 2018 World Wide Web Conference. 439–448
2018
-
[75]
Dong Wen, Lu Qin, Ying Zhang, Lijun Chang, and Xuemin Lin. 2017. Efficient structural graph clustering: an index-based approach. Proceedings of the VLDB Endowment 11, 3 (2017), 243–255
2017
-
[76]
Jierui Xie, Stephen Kelley, and Boleslaw K Szymanski. 2013. Overlapping com- munity detection in networks: The state-of-the-art and comparative study. Acm computing surveys (csur) 45, 4 (2013), 1–35
2013
-
[77]
Jierui Xie, Boleslaw K Szymanski, and Xiaoming Liu. 2011. Slpa: Uncovering overlapping communities in social networks via a speaker-listener interaction dy- namic process. In2011 ieee 11th international conference on data mining workshops. IEEE, 344–349
2011
-
[78]
Xiaowei Xu, Nurcan Yuruk, Zhidan Feng, and Thomas AJ Schweiger. 2007. Scan: a structural clustering algorithm for networks. In Proceedings of the 13th ACM SIGKDD international conference on Knowledge discovery and data mining . 824– 833
2007
-
[79]
Jaewon Yang and Jure Leskovec. 2012. Defining and evaluating network commu- nities based on ground-truth. In Proceedings of the ACM SIGKDD Workshop on Mining Data Semantics. 1–8
2012
-
[80]
Zhao Yang, René Algesheimer, and Claudio J Tessone. 2016. A comparative analysis of community detection algorithms on artificial networks. Scientific reports 6, 1 (2016), 1–18
2016
-
[81]
Shangdi Yu, Joshua Engels, Yihao Huang, and Julian Shun. 2023. PECANN: Parallel Efficient Clustering with Graph-Based Approximate Nearest Neighbor Search. arXiv preprint arXiv:2312.03940 (2023). A Runtime and Scalability of all algorithms In Figure 9, we show the running time ...
2023 arXiv
-
[2010]
IEEE transactions on pattern analysis and machine intelligence 33, 3 (2010), 568–586
Parallel spectral clustering in distributed systems. IEEE transactions on pattern analysis and machine intelligence 33, 3 (2010), 568–586
2010
-
[2017]
Advances in Neural Information Processing Systems 30 (2017)
Affinity clustering: Hierarchical clustering at scale. Advances in Neural Information Processing Systems 30 (2017)
2017
-
[2021]
VLDB Endow
Scalable community detection via parallel correlation clustering.Proc. VLDB Endow. 14, 11 (jul 2021), 2305–2313. https://doi.org/10.14778/3476249.3476282
2021
-
[2022]
Advances in Neural Information Processing Systems 35 (2022), 22925–22940
Hierarchical agglomerative graph clustering in poly-logarithmic depth. Advances in Neural Information Processing Systems 35 (2022), 22925–22940
2022
Reviewed August 12, 2026 · model on record in the stance chip above.
Discussion (0). Continue with ORCID to comment.