REVIEW 2 major objections 6 minor 14 references
Where to show Demos in Your Prompt: A Positional Bias of In-Context Learning
T0 review · 2 major / 6 minor · reviewed 2026-08-06 · deepseek-v4-flash
Pith's one-line read Relocating an identical block of in-context examples inside the prompt can flip up to 45.5% of a model's predictions and swing accuracy by tens of percentage points.
desk verdict A broad empirical study of demo position in prompts, but the 'purely positional' claim is undermined by a template confound and internally inconsistent appendix tables. read the letter →
The pith
A machine-rendered reading of the paper's core claim, the machinery that carries it, and where it could break.
The reading
What carries the argument
The paper's handle on the bias is a controlled template system with four named demo slots: ssp (start of system prompt), esp (end of system prompt), sum (start of user message, the conventional default), and eum (end of user message). A fixed block of five demonstrations is inserted into one slot at a time, and two task-agnostic metrics quantify the effect: accuracy-change $\Delta_{\mathrm{metric}} = \mathrm{metric}_{\mathrm{position}} - \mathrm{metric}_{\mathrm{zero\text{-}shot}}$ measures the net gain or loss against zero-shot, while prediction-change $\Delta_{\mathrm{pred}} = \#\mathrm{answer\ flips} / \#Q$ compares each position to the default sum and gives a direct vote count of output volatility. These metrics turn positional sensitivity into two numbers that standard accuracy reports hide, letting the authors compare ten models and eight tasks on the same scale.
What would settle it
Run the same four-position comparison with one template that keeps the instruction sentence and query wording identical and moves only the demo block; if demos at the end of the user message stop being significantly worse than demos at the start of the system prompt, the claimed pure positional bias collapses into an instruction-placement effect.
Extended reading notes
Core claim
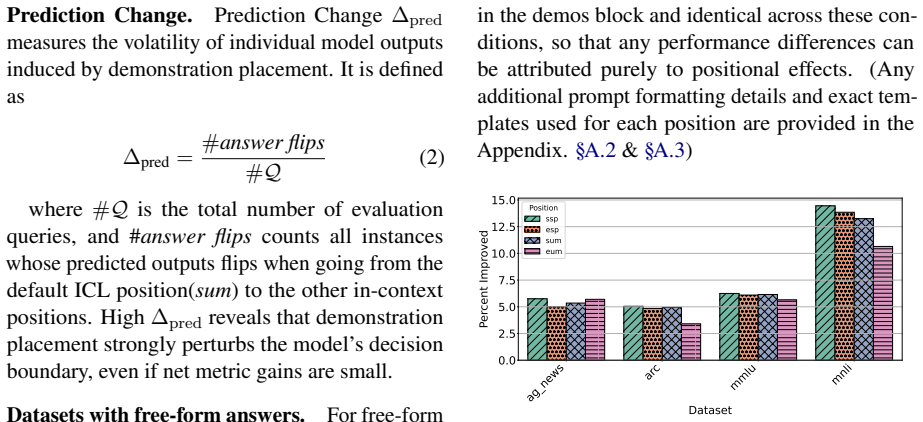
The central discovery is a positional bias the authors call DPP bias: with the content of the prompt held fixed, relocating a block of demonstrations among four canonical slots—start of system prompt (ssp), end of system prompt (esp), start of user message (sum), and end of user message (eum)—changes both aggregate accuracy and per-example outputs. On MMLU, ssp raises accuracy from 0.3364 under zero-shot to 0.6885, while eum reaches only 0.4519 and is not statistically distinguishable from zero-shot; pairwise tests show eum is significantly worse than each of the three earlier slots. Early placement gives the most stable and accurate outputs, especially for smaller models, but the best position shifts with scale and task: a 70B model on GSM8K improves when demos move to the end of the user message. The paper reads the pattern as a primacy bias, consistent with autoregressive causal masking and attention concentrating on early tokens, and proposes two metrics to surface it.
Load-bearing premise
The conclusion rests on the assumption that moving the demo block is the only change between the four prompts, but the end-of-message template also relocates the instruction sentence and adds 'Answer this question,' so part of the measured effect could come from instruction wording or placement rather than from demo position alone.
Editorial extensions
If this is right
- Prompt writers should evaluate demo placement explicitly, since moving demos earlier can improve accuracy by up to about six points while placing them after the query can flip more than 30% of answers without raising correctness.
- Few-shot evaluations that only use the default position can misrepresent a model's capability; reporting accuracy-change and prediction-change would expose hidden volatility.
- Larger models are more robust to position, but the bias persists on complex tasks; at 70B/72B scale more than half of GSM8K predictions still change across positions.
- The winning position varies by model and task, so prompt optimization should search over demo slots as well as demo content and order.
- Instruction-tuned models may have internalized positional regularities from training, suggesting position-invariant training or test-time position calibration as remedies.
Reading between the lines
- The paper's appendix templates change more than position: in the end-of-message (eum) template, the instruction 'Use the demos below...' is moved after the query and 'Answer this question' is added, so the headline effect sizes likely mix demo position with instruction placement; a pure-position replication is the natural next step.
- If the primacy explanation is correct, the bias should be predictable from attention: early slots should receive higher attention weight, and artificially shifting attention to late demo tokens should reduce the eum penalty.
- A practical upper bound on position tuning can be estimated by comparing default-position accuracy with an oracle that picks the best slot per query; the gap gives the maximum gain a calibration method could recover.
- The same four-slot design applied to chain-of-thought examples would test whether reasoning demonstrations inherit the same positional fragility, and whether early placement helps or hurts step-by-step answers.
Editorial analysis
A structured set of objections, weighed in public.
Referee Report
Summary. This paper introduces the term 'DPP bias' (demos' position in prompt) and reports experiments across ten instruction-tuned LLMs and eight benchmarks, comparing four placements of a fixed demonstration block: ssp, esp, sum, and eum. It proposes two metrics, accuracy-change and prediction-change, claims that early demo positions reliably outperform late ones, and that eum flips over 30% of predictions on QA tasks. The paper concludes that the effect is purely positional and offers scaling analyses, mechanistic hypotheses, and mitigation suggestions.
Significance. The study targets a real and practically relevant question, and the scale of the evaluation (ten models, eight tasks) is a genuine strength. The two proposed metrics are simple, task-agnostic, and would be reusable if defined rigorously. However, the central claim of a purely positional effect is not supported by the experimental design: the eum template changes instruction wording and placement, not just demo position. In addition, the paper contains direct numerical contradictions about the prediction-change metric. The contribution is therefore conditional on a substantial redesign and re-analysis.
major comments (2)
- [§3.1 and Appendix A.3] The assertion that 'the content of P is fixed' is contradicted by the eum template. In ssp, esp, and sum, the string 'Use the demos below as examples on how to answer the question' appears before the query (and before the demos), whereas eum adds the extra instruction 'Answer this question' before the query and moves the 'Use the demos below...' phrase to after the query, immediately before the demo block. As a result, every eum-versus-other comparison—which is the basis for the headline result that eum degrades accuracy and flips predictions (Tables 1-5, Figures 2-3)—confounds demo position with both the wording and the placement of the instruction text. The claim in Section 4.1 that 'any performance differences can be attributed purely to positional effects' is therefore not justified.
- [§4.2 and Appendix A.7] The prediction-change reporting is internally contradictory. The text states that in summarization the percentage of changed predictions is 'consistently near 100%' for eum, and Figure 23 (left) shows prediction-change values around 99.5-100% for XSUM across all models. Yet Tables 10-14 list Δpred = 0.00 for every model and position on XSUM, CNN/DailyMail, SQuAD, and GSM8K, while the same tables report nonzero Improved/Regressed percentages (e.g., Table 10, Qwen_1.5B ssp: Improved 92.50%, Regressed 0.00%). These figures cannot be reconciled under a single definition of 'prediction change'; the reader cannot determine which numbers correspond to the metric in Eq. (2). This undermines all quantitative claims about prediction flips.
minor comments (6)
- [§1] The introduction states the effect can swing accuracy by 'up to 20 percents' (first paragraph) while the fifth contribution states 'up to 50 percentage points'; Figure 1 reports up to 45.5%. Please harmonize these numbers.
- [§1] The claim that the phenomenon is 'purely spatial, independent of demo content' is not tested: no experiment varies demo content while holding position fixed, so 'independent of demo content' is an overclaim.
- [§A.5.1 and Table 6] Section A.5.1 says the context window is 1,000 tokens, but Table 6 reports Booksum prompts of 'approx. 23 K tokens'; this is a direct contradiction and should be resolved.
- [Table 3] Cohere_8B on MMLU has an eum accuracy of 0.05 versus ssp 0.94, an extreme outlier compared with other models; please verify answer extraction or decoding for that condition and report whether the failure is in generation or parsing.
- [§3.3] The free-form flip definition uses a hand-set ROUGE-L threshold of 0.05 and only compares sum to esp, not to ssp or eum; please justify the threshold and clarify how the metric is computed for non-baseline positions.
- [§4.4, Figures 8-10] The win-loss-tie plots classify a position as a 'loss' when zero-shot outperforms it; since zero-shot is not one of the four positions, this conflates two different questions. Consider renaming or presenting pairwise positional wins separately.
Circularity Check
No circularity: the paper is an empirical measurement study whose claims are supported by raw model outputs, not by a derivation that reduces to its own inputs.
full rationale
This is an empirical measurement study rather than a derivation, so there is no chain of equations in which a predicted quantity is shown to equal its own input by construction. The central metrics, ACCURACY-CHANGE and PREDICTION-CHANGE, are defined directly from observed model outputs relative to the zero-shot and sum baselines, and the 0.05 flip threshold is a stated, hand-set constant rather than a fitted parameter. No load-bearing result depends on a self-citation: the paper cites external prior work for background, and its related-work section explicitly acknowledges that Beck et al.'s metrics are formally equivalent to its own Prediction-Delta and Accuracy-Delta, which is an honest comparison rather than a circular borrowing. The Appendix A.3 templates do reveal a genuine experimental confound: the eum template contains the extra phrase 'Answer this question' and places the 'Use the demos below...' instruction after the query, whereas the other templates place that instruction before the query. This weakens the causal claim that all observed differences are purely positional, but a confound is not circularity: the conclusion is not equivalent to the input by definition, and the reported accuracies and transition counts are independent measurements. The limitations section also candidly flags that automated metrics are imperfect proxies, which further supports the absence of any hidden circular reduction. Accordingly, no circular step is present and the score is 0.
Assumptions & free parameters
free parameters (1)
- ROUGE-L flip threshold =
0.05
assumptions (4)
- ad hoc to paper The four DPP templates hold prompt content fixed, so differences are purely positional
- domain assumption Chat-style system/user role structure is the meaningful decomposition for studying position
- domain assumption Greedy decoding at temperature 0 gives representative outputs for each prompt
- ad hoc to paper ROUGE-L difference >0.05 is a meaningful definition of an answer flip
Cite this review
Pith. "Pith review of Where to show Demos in Your Prompt: A Positional Bias of In-Context Learning." pith.science (2026). https://pith.science/paper/GWB45YIL
@misc{pith2026250722887,
  author       = {Pith},
  title        = {Pith review of: Where to show Demos in Your Prompt: A Positional Bias of In-Context Learning},
  year         = {2026},
  howpublished = {\url{https://pith.science/paper/GWB45YIL}},
  note         = {Machine review of arXiv:2507.22887}
}
read the original abstract
In-context learning (ICL) is a critical emerging capability of large language models (LLMs), enabling few-shot learning during inference by including a few demonstrations (demos) in the prompt. However, it has been found that ICL's performance can be sensitive to the choices of demos and their order. This paper investigates an unexplored new positional bias of ICL for the first time: we observe that the predictions and accuracy can drift drastically when the positions of demos, the system prompt, and the user message in LLM input are varied. We refer to this bias as DEMOS' POSITION IN PROMPT (DPP) bias. We design a systematic evaluation pipeline to study this type of positional bias across classification, question answering, summarization, and reasoning tasks. We introduce two metrics, ACCURACY-CHANGE and PREDICTION-CHANGE, to quantify net gains and output volatility induced by changes in the demos' position. Extensive experiments on ten LLMs from four open-source model families (QWEN, LLAMA3, MISTRAL, COHERE) verify that the bias significantly affects their accuracy and predictions: placing demos at the start of the prompt yields the most stable and accurate outputs with gains of up to +6 points. In contrast, placing demos at the end of the user message flips over 30\% of predictions without improving correctness on QA tasks. Smaller models are most affected by this sensitivity, though even large models remain marginally affected on complex tasks.
Figures


Figures from the paper (19 more)


Reference graph
Works this paper leans on
-
[1]
Assemblethe prompt: combine the chosen prompt template, the formatted demonstra- tions (possibly shuffled or ablated), andq j
-
[2]
Check length: as some demonstrations Dτ might exceed the model defined token limits, we estimate the token length to ensure we do not exceed model limits (e.g., 8192 tokens)
-
[3]
A.3 Final System Prompts • AG News You are a text classification assistant
Generate response: feed the prompt into fθ via streaming token-by-token output. A.3 Final System Prompts • AG News You are a text classification assistant. You will receive a news article and must clas- sify it into one of the following categories: World, Sports, Business, or Sci/Tech. Re- spond with only the category name. Do not provide any explanations...
work page 2025
- [4]
-
[5]
A broad-coverage challenge corpus for sen- tence understanding through inference. InProceed- ings of the 2018 Conference of the North American Chapter of the Association for Computational Lin- guistics: Human Language Technologies, Volume 1 (Long Papers), pages 1112–1122. Association for Computational Linguistics. Guangxuan Xiao, Yuandong Tian, Beidi Chen...
arXiv 2018
-
[10]
Normalize whitespace and strip punctuation
-
[11]
Attempt to parse JSON-like substrings and extract the “answer” field
-
[12]
Apply multiple-choice heuristics (letter match or exact option-text match)
Show all 14 references
-
[14]
This ensures that even messy or verbose outputs get reliably converted into our evaluation labels
Fallback to returning the cleaned string, then perform an exact or fuzzy match against the label set (otherwise assign “other”). This ensures that even messy or verbose outputs get reliably converted into our evaluation labels. 3The Mixture-of-Experts model is served with AWQ ...
-
[2017]
InProceedings of the 55th An- nual Meeting of the Association for Computational Linguistics (Volume 1: Long Papers), pages 1073– 1083, Vancouver, Canada
Get to the point: Summarization with pointer- generator networks. InProceedings of the 55th An- nual Meeting of the Association for Computational Linguistics (Volume 1: Long Papers), pages 1073– 1083, Vancouver, Canada. Association for Computa- tional Linguistics. The Llama 3 ...
2024 arXiv
-
[2018]
Don’t give me the details, just the summary! topic-aware convolutional neural networks for ex- treme summarization.ArXiv, abs/1808.08745. Catherine Olsson, Nelson Elhage, Neel Nanda, Nicholas Joseph, Nova DasSarma, Tom Henighan, Ben Mann, Amanda Askell, Yuntao Bai, Anna Chen, ...
2022 arXiv
-
[2021]
Training verifiers to solve math word prob- lems.arXiv preprint arXiv:2110.14168. John Dang, Shivalika Singh, Daniel D’souza, Arash Ahmadian, Alejandro Salamanca, Madeline Smith, Aidan Peppin, Sungjin Hong, Manoj Govindassamy, Terrence Zhao, Sandra Kublik, Meor Amer, Viraat Ar...
-
[2022]
Ikhyun Cho, Gaeul Kwon, and Julia Hockenmaier
Data distributional properties drive emer- gent in-context learning in transformers.Preprint, arXiv:2205.05055. Ikhyun Cho, Gaeul Kwon, and Julia Hockenmaier. 2024. Tutor-ICL: Guiding large language models for im- proved in-context learning performance. InFindings of the Assoc...
2024 arXiv
-
[2024]
of demonstrations, as well as the selection of the demonstrations. A.2 Prompting LLMs Prompt Format and Instruction-Tuning.The model families in our study (QWEN, MISTRAL, LLAMA3, and COHERE) are instruction-tuned us- ing chat-style templates that explicitly separate prompt seg...
Reviewed August 6, 2026 · model on record in the stance chip above.
Discussion (0). Continue with ORCID to comment.