REVIEW 3 major objections 5 minor 1 cited by
LTDE: The Lens Time Delay Experiment I. From pixels to light curves
T0 review · 3 major / 5 minor · reviewed 2026-08-16 · deepseek-v4-flash
Pith's one-line read A public benchmark challenge tests how well photometry algorithms can turn pixels of lensed quasars into accurate light curves.
desk verdict A well-designed community benchmark for lensed-quasar photometry that is honest about its terms, but whose PSF realism is unvalidated and therefore limits how far the leaderboard transfers to real LSST data. read the letter →
The pith
A machine-rendered reading of the paper's core claim, the machinery that carries it, and where it could break.
The reading
What carries the argument
The load-bearing object is the simulation pipeline that re-creates LSST exposures from survey catalogues, injecting each lensed quasar with a super-sampled point-spread function made of a Moffat profile plus a shapelet correction, then adding Poisson photon noise and a fixed instrumental noise model. The key design choice is that the true PSF and the true input light curves are known to the challenge organizers but hidden from participants, so any mismatch between submitted and true light curves can be attributed to the photometry method rather than to the simulation. The three rounds progressively remove information: first the noiseless PSF is given, then it must be estimated from the data, and finally it varies across the field of view through an atmospheric distortion model. This isolates whether a method fails at deblending, at PSF estimation, or at handling a spatially varying PSF.
What would settle it
Re-run the challenge on a set of real LSST images of lensed quasars with independently measured time delays, using the same methods; if the method ranking on real data does not match the ranking on the 108 simulated systems, the simulation's PSF and noise models are not faithful enough to predict real performance.
Extended reading notes
Core claim
The central claim is that a public set of simulated cutouts, generated with controlled PSF, sky, and noise models, can serve as a standard benchmark for light-curve extraction from lensed quasar images. The paper establishes the benchmark by defining three rounds of increasing difficulty — a known and constant PSF, an unknown but constant PSF, and an unknown spatially varying PSF — and by specifying three metrics: a per-image $\chi^2$ test for flux leakage between quasar images, an offset-marginalised $\chi^2$ for photometric accuracy, and the absolute percentage error in reported flux uncertainties. All simulations share a damped random walk model for quasar variability and a Sérsic profile for the host and lens galaxies, so the ground-truth light curves are known exactly. If the benchmark succeeds, relative method performance on these simulations should predict relative performance on real LSST observations of lensed quasars.
Load-bearing premise
The simulated exposures capture the PSF, sky, and noise variations that actually limit photometry of lensed quasars in the LSST survey, because the benchmark's ranking of methods transfers to real data only if those models are representative.
Editorial extensions
If this is right
- Methods that score well in all three rounds can be trusted for LSST-era monitoring of lensed quasars, assuming the simulated exposures are representative of real data.
- The three-round design pinpoints the failure mode of each method: blending, PSF estimation, or spatial PSF variation.
- The public dataset gives algorithm developers a fixed testbed, so future methods can be compared against the same 108 systems rather than ad hoc simulations.
- If no method passes Round #2 comfortably, the community learns that spatially variable PSF handling needs work before LSST data arrive.
- The metrics define an objective ranking, allowing the follow-up paper to report which families of photometry tools are best for time-delay work.
Reading between the lines
- Because the simulations omit microlensing and other astrophysical variability, the benchmark measures only measurement and deblending errors; real time-delay measurements will also face source-intrinsic microlensing, so the achievable accuracy on real data may be worse than the benchmark suggests.
- The published data could be reused to test full time-delay estimation, not just photometry: participants' light curves could be fed to delay-estimation algorithms and the recovered delays checked against the true delays hidden in the simulations.
- A natural extension is to add a round with realistic PSF residuals from real telescope images, which would test whether the Moffat-plus-shapelet PSF model is the limiting factor rather than the photometry itself.
Signed reviews
Editorial analysis
A structured set of objections, weighed in public.
Referee Report
Summary. The manuscript presents the Lens Time Delay Experiment (LTDE), a community challenge whose first round is a public dataset of simulated LSST-like exposures of gravitationally lensed quasars. The simulations are generated with MOLET: lensed quasar images are produced from an SIE mass profile with four configurations (double, cusp, fold, cross); the lens and host galaxies follow Sérsic profiles; quasar variability is modeled as a damped random walk; and exposures are built on LSST DP0.2 sky and atmospheric distortion data with a Moffat-plus-shapelet PSF and an LSST noise model. The authors define three rounds of increasing difficulty (known constant PSF, unknown constant PSF, unknown spatially varying PSF), specify a CSV submission format, and define three evaluation metrics: a per-image chi-squared, an offset-marginalized chi-squared on the summed light curve, and an absolute percentage error on reported uncertainties. The central deliverable is the simulated data release and the invitation to the community to submit light curves; evaluation results are deferred to a follow-up paper.
Significance. The paper's contribution is a reusable, ground-truth benchmark rather than a new photometric method. This is valuable: the simulated cutouts cover a broad range of lens configurations, brightness contrasts, and Einstein radii; the ground truth is known by construction, so the metrics are not circular; and the public data release with a fixed submission format lowers the barrier for comparing deblending and photometry algorithms. The paper is also honest about its scope: it does not claim to have solved the photometric problem, and the metrics are clearly specified. If the simulated exposures are representative of LSST data, this benchmark could help develop and validate algorithms for time-delay cosmography and microlensing. The main weakness is that the paper provides no evidence that the simulated PSF and noise are representative, and no baseline run is shown, so the transferability of the leaderboard ranking to real LSST data is currently unquantified.
major comments (3)
- [Section 2.3, Eqs. (2)-(5)] The realism of the PSF is the central load-bearing assumption for this benchmark, but the paper gives no numerical values for the Moffat alpha and gamma distributions, nor for the shapelet component added to the PSF. The text only says the ranges are 'consistent with observations' (citing Trujillo et al. 2001), and no comparison is made between the simulated PSF statistics (FWHM distribution, ellipticity e1,e2 and its spatial/temporal correlation, higher-order moments) and real LSST or DP0.2 PSF measurements. Because the benchmark's ranking will transfer to LSST only if the PSF model is representative, the authors should report the exact parameter ranges and add a validation subsection comparing simulated PSF statistics to observed LSST/DP0.2 values.
- [Section 4 and overall] No baseline photometry pipeline is run on the simulated exposures. The paper claims the experiment will 'evaluate the limits of current photometric algorithms' and defines metrics in Section 4, but it does not show that any method can recover the injected light curves, nor that the metrics are discriminatory. Even a simple baseline (e.g., forced aperture photometry or a PSF fit on a single configuration) would calibrate the expected difficulty and demonstrate that the challenge is feasible; without it, the reader cannot judge whether the benchmark is trivially easy, impossible, or affected by simulation artifacts.
- [Section 4, Eq. (12)] The definition of the 'true uncertainty' sigma_{n,i} is ambiguous for blended quasar images. The text states that it is the sum in quadrature of instrumental and photon noise, but the photon noise relevant to a flux measurement of one deblended image depends on the aperture or model used and includes contributions from neighboring quasar images, the lens galaxy, and sky. Without a precise statement of how sigma_{n,i} is computed from the simulation (which aperture, which components are included in the photon count), the error-recovery metric epsilon is not well defined and may not be a fair basis for ranking submissions.
minor comments (5)
- [Section 2.3 and Eq. (8)] The symbol gamma is used both for the Moffat scale parameter in Eq. (2) and for the normalization factor in Eq. (8); consider renaming one of them to avoid confusion.
- [Section 5] The phrase 'for advertising purposes' is unclear; if the intended meaning is organizational, please reword.
- [Section 5] The submission format should specify that flux_AB (and similar combined labels) is the sum of the fluxes of the listed images, since the current wording only says to use the suffixes.
- [Section 1] The text contains typographical errors such as '(de)magnificatoin' and broken ligatures in the PDF extraction (e.g., 'o ffers' and 'di fferent'); these should be cleaned up.
- [Section 5] The deadline dates (30 May 2025 and 30 June 2025) have passed; please update the paper to state the current status of the rounds or note that the challenge remains open.
Circularity Check
No circular reasoning: the paper releases simulated images whose true light curves are inputs by design, and the scoring metrics compare submissions directly against those known inputs.
full rationale
The paper makes no claim to derive or predict the true light curves; it explicitly generates mock lensed quasars using MOLET with input damped-random-walk variability (Section 2.2), injects lensed sources into LSST-like exposures with controlled PSFs and noise (Sections 2.3 and 2.4), and then evaluates participant submissions against these known inputs using chi-squared metrics (Section 4). The central deliverable is a public simulated dataset and standardized scoring, so the ground-truth light curves are inputs by construction rather than outputs of the evaluated methods. This is a self-contained benchmark design, not a hidden reduction. The only self-citation is the use of MOLET (Vernardos 2022), a published software package by one of the authors, but it is used as a simulation tool and not as an authority invoked to force a conclusion; no uniqueness theorem or ansatz is smuggled through it. The realism of the PSF and sky models relative to real LSST data is an external-validation and transferability concern, not circularity, because the benchmark's ground truth is not built from the quantities being scored. Accordingly, no circular step is found and the score is 0.
Assumptions & free parameters
free parameters (5)
- Sersic profile parameters for lens and host galaxy =
not stated
- SIE Einstein radius scaling factors =
0.75 and 1.5
- Host and lens galaxy brightness contrast factors =
0.1 and 0.5
- Moffat PSF parameters alpha and gamma =
not specified
- DRW variability parameters =
not specified
assumptions (5)
- domain assumption Lens mass distribution is a singular isothermal ellipsoid (Eq. 1).
- domain assumption Lens and host galaxy light follow Sersic profiles.
- domain assumption Quasar intrinsic variability follows a damped random walk.
- domain assumption PSF can be represented as a Moffat profile with a shapelet perturbation.
- domain assumption DP0.2 catalogs, sky brightness, and distortion measurements are a valid proxy for LSST observing conditions.
Cite this review
Pith. "Pith review of LTDE: The Lens Time Delay Experiment I. From pixels to light curves." pith.science (2026). https://pith.science/paper/H4GEGWIJ
@misc{pith2026250416249,
  author       = {Pith},
  title        = {Pith review of: LTDE: The Lens Time Delay Experiment I. From pixels to light curves},
  year         = {2026},
  howpublished = {\url{https://pith.science/paper/H4GEGWIJ}},
  note         = {Machine review of arXiv:2504.16249}
}
abstract
Gravitationally lensed quasars offer a unique opportunity to study cosmological and extragalactic phenomena, using reliable light curves of the lensed images. This requires accurate deblending of the quasar images, which is not trivial due to the small separation between the lensed images (typically $\sim1$ arcsec) and because there is light contamination by the lensing galaxy and the quasar host galaxy. We propose a series of experiments aimed at testing our ability to extract precise and accurate photometry of lensed quasars. In this first paper, we focus on evaluating our ability to extract light curves from simulated CCD images of lensed quasars spanning a broad range of configurations and assuming different observational/instrumental conditions. Specifically, the experiment proposes to go from pixels to light curves and to evaluate the limits of current photometric algorithms. Our experiment has several steps, from data with known point spread function (PSF), to an unknown spatially-variable PSF field that the user has to take into account. This paper is the release of our simulated images. Anyone can extract the light curves and submit their results by the deadline. These will be evaluated with the metrics described below. Our set of simulations will be public and it is meant to be a benchmark for time-domain surveys like Rubin-LSST or other follow-up time-domain observations at higher temporal cadence. It is also meant to be a test set to help develop new algorithms in the future.
Figures
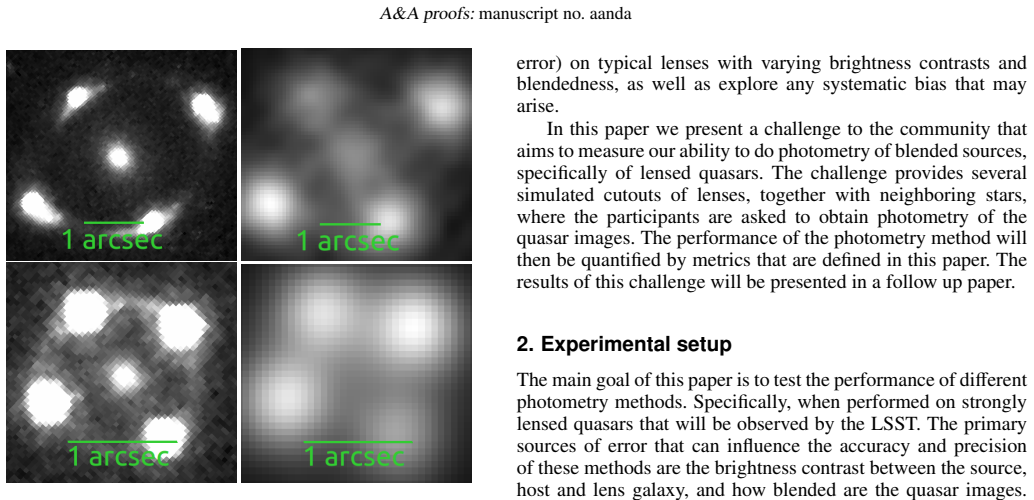


Figures from the paper (4 more)


Forward citations
Cited by 1 Pith paper
-
Investigating the Dark Energy Constraint from Strongly Lensed AGN at LSST-Scale
A simulated sample of 800 LSST lensed AGN, analyzed with a new hierarchical time-delay inference code, is forecast to yield ~2.5% H0 precision and a dark-energy figure of merit of 6.7 in w0waCDM.
Reference graph
Works this paper leans on
-
[1]
Acevedo Barroso, J. A., O’Riordan, C. M., Clément, B., et al. 2024, arXiv e- prints, arXiv:2408.06217
arXiv 2024
-
[2]
Joint multiband deconvolution for Euclid and Vera C. Rubin images
Akhaury, U., Jablonka, P., Courbin, F., & Starck, J.-L. 2025, arXiv e-prints, arXiv:2502.17177
work page Pith review arXiv 2025
-
[3]
L., Kuropatkin, N., et al
Anguita, T., Schechter, P. L., Kuropatkin, N., et al. 2018, MNRAS, 480, 5017
2018
-
[4]
Bernstein, G. M. & Jarvis, M. 2002, AJ, 123, 583 Article number, page 6 of 7 Favio Neira et al.: LTDE: The Lens Time Delay Experiment
work page 2002
-
[5]
& Arnouts, S
Bertin, E. & Arnouts, S. 1996, A&AS, 117, 393
1996
-
[6]
2019, in Astronomical Society of the Pacific Conference Series, V ol
Bosch, J., AlSayyad, Y ., Armstrong, R., et al. 2019, in Astronomical Society of the Pacific Conference Series, V ol. 523, Astronomical Data Analysis Software and Systems XXVII, ed. P. J. Teuben, M. W. Pound, B. A. Thomas, & E. M. Warner, 521
work page 2019
-
[7]
Bretthorst, G. L. 1988, Bayesian spectrum Analysis and parameter estimation (Springer-Verlag Berlin Heidelberg)
work page 1988
-
[8]
Cooke, J. H. & Kantowski, R. 1975, ApJ, 195, L11
work page 1975
Show all 35 references
-
[9]
2005, in IAU Symposium, V ol
Courbin, F., Eigenbrod, A., Vuissoz, C., Meylan, G., & Magain, P. 2005, in IAU Symposium, V ol. 225, Gravitational Lensing Impact on Cosmology, ed. Y . Mellier & G. Meylan, 297–303 Euclid Collaboration, Mellier, Y ., Abdurro’uf, et al. 2024, arXiv e-prints, arXiv:2405.13491 Iv...
2005
-
[10]
E., et al
Kaiser, N., Aussel, H., Burke, B. E., et al. 2002, in Society of Photo-Optical Instrumentation Engineers (SPIE) Conference Series, V ol. 4836, Survey and Other Telescope Technologies and Discoveries, ed. J. A. Tyson & S. Wol ff, 154–164
2002
-
[11]
A., Auger, M
Lemon, C. A., Auger, M. W., & McMahon, R. G. 2019, MNRAS, 483, 4242 LSST Dark Energy Science Collaboration, Abolfathi, B., Armstrong, R., et al. 2021, arXiv e-prints, arXiv:2101.04855
2019 arXiv
-
[12]
Lucy, L. B. 1994, in The Restoration of HST Images and Spectra - II, ed. R. J. Hanisch & R. L. White, 79
1994
-
[13]
L., Ivezi´c, Ž., Kochanek, C
MacLeod, C. L., Ivezi´c, Ž., Kochanek, C. S., et al. 2010, ApJ, 721, 1014
2010
-
[14]
1998, ApJ, 494, 472
Magain, P., Courbin, F., & Sohy, S. 1998, ApJ, 494, 472
1998
-
[15]
2023, The Journal of Open Source Software, 8, 5340
Michalewicz, K., Millon, M., Dux, F., & Courbin, F. 2023, The Journal of Open Source Software, 8, 5340
2023
-
[16]
2020, A&A, 640, A105
Millon, M., Courbin, F., Bonvin, V ., et al. 2020, A&A, 640, A105
2020
-
[17]
& Marshall, P
Oguri, M. & Marshall, P. J. 2010, MNRAS, 405, 2579
2010
-
[18]
1964, MNRAS, 128, 307
Refsdal, S. 1964, MNRAS, 128, 307
1964
-
[19]
Saha, P., Sluse, D., Wagner, J., & Williams, L. L. R. 2024, Space Sci. Rev., 220, 12
2024
-
[20]
Schneider, P., Ehlers, J., & Falco, E. E. 1992, Gravitational Lenses
1992
-
[21]
& Schneider, P
Seitz, C. & Schneider, P. 1997, A&A, 318, 687
1997
-
[22]
Sersic, J. L. 1968, Atlas de Galaxias Australes
1968
-
[23]
Stetson, P. B. 1987, PASP, 99, 191
1987
-
[24]
L., Ivezi´c, Ž., & MacLeod, C
Suberlak, K. L., Ivezi´c, Ž., & MacLeod, C. 2021, ApJ, 907, 96
2021
-
[25]
Sureau, F., Lechat, A., & Starck, J. L. 2020, A&A, 641, A67
2020
-
[26]
Taak, Y . C. & Treu, T. 2023, MNRAS, 524, 5446
2023
-
[27]
2013, A&A, 553, A120
Tewes, M., Courbin, F., & Meylan, G. 2013, A&A, 553, A120
2013
-
[28]
Trujillo, I., Aguerri, J. A. L., Cepa, J., & Gutiérrez, C. M. 2001, MNRAS, 328, 977
2001
-
[29]
2003, Acta Astron., 53, 291
Udalski, A. 2003, Acta Astron., 53, 291
2003
-
[30]
2023, arXiv e-prints, arXiv:2306.11781
Vegetti, S., Birrer, S., Despali, G., et al. 2023, arXiv e-prints, arXiv:2306.11781
2023 arXiv
-
[31]
2023, arXiv e-prints, arXiv:2311.13305
Verde, L., Schöneberg, N., & Gil-Marín, H. 2023, arXiv e-prints, arXiv:2311.13305
2023 arXiv
-
[32]
2022, MNRAS, 511, 4417
Vernardos, G. 2022, MNRAS, 511, 4417
2022
-
[33]
C., Suyu, S
Wong, K. C., Suyu, S. H., Chen, G. C. F., et al. 2020, MNRAS, 498, 1420
2020
-
[34]
2023, MNRAS, 520, 2328
Zhang, T., Almoubayyed, H., Mandelbaum, R., et al. 2023, MNRAS, 520, 2328
2023
-
[35]
2018, MNRAS, 481, 1149 Article number, page 7 of 7
Zuntz, J., Sheldon, E., Samuroff, S., et al. 2018, MNRAS, 481, 1149 Article number, page 7 of 7
2018
Reviewed August 16, 2026 · model on record in the stance chip above.
Discussion (0). Continue with ORCID to comment.