REVIEW 4 major objections 6 minor 91 references
ChannelExplorer: Exploring Class Separability Through Activation Channel Visualization
T0 review · 4 major / 6 minor · reviewed 2026-08-15 · deepseek-v4-flash
Pith's one-line read ChannelExplorer claims that summarizing every activation channel into a scalar and showing those summaries in three coordinated views lets experts find class confusion, mislabeled images, and channel contributions in any image-based…
desk verdict A credible open-source visualization tool for activation-channel analysis, but its core summary assumption needs validation before the headline use cases can be trusted. read the letter →
The pith
A machine-rendered reading of the paper's core claim, the machinery that carries it, and where it could break.
The reading
What carries the argument
The load-bearing device is the activation-channel summarization function $S(I)$, which maps a channel image $I \in \mathbb{R}^{w \times h}$ to a scalar; the default sums thresholded absolute intensities with the threshold from Otsu's method. This collapses thousands of spatial activations into one number per channel per image. The resulting vectors feed the Jaccard similarity coefficient $J^l_{ij} = |S^l_i \cap S^l_j| / |S^l_i \cup S^l_j|$ over the top-activated channel sets, the dimensionality-reduction embedding, and the channel-ordering metric $\zeta^l_i$, the sum of class-pairwise Euclidean distances between channel summaries. The assumption that intensity alone encodes feature presence is what lets all three views work.
What would settle it
Take two classes whose images have identical per-channel intensity histograms but features in different spatial positions; if a classifier separates them while ChannelExplorer's three views show complete overlap, the intensity-only summary has lost the signal the tool claims to preserve.
Extended reading notes
Core claim
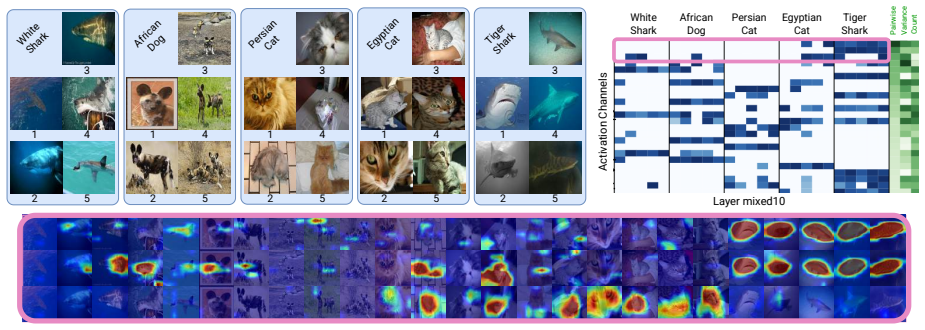
For an image-based layer, the paper proposes treating each activation channel as a feature detector whose presence can be summarized by a single number computed from pixel intensity alone. Four summarization functions are offered, with a thresholded sum chosen as default. Those summaries feed a scatterplot embedding with cluster hulls, a Jaccard similarity matrix over the top activated channels per image, and a heatmap of channel summaries ordered by class-pairwise distance. The paper claims that reading these three views together reveals inter-class and intra-class confusion, automatically generates per-layer class hierarchies, exposes mislabeled inputs, identifies channels that contribute little to the task, and locates where outputs sit in latent space; the four use cases and the expert evaluation are offered as evidence.
Load-bearing premise
Everything rests on the claim that a single scalar per channel, computed from activation intensity alone, preserves enough information to judge class separability regardless of where high activations sit in the image.
Editorial extensions
If this is right
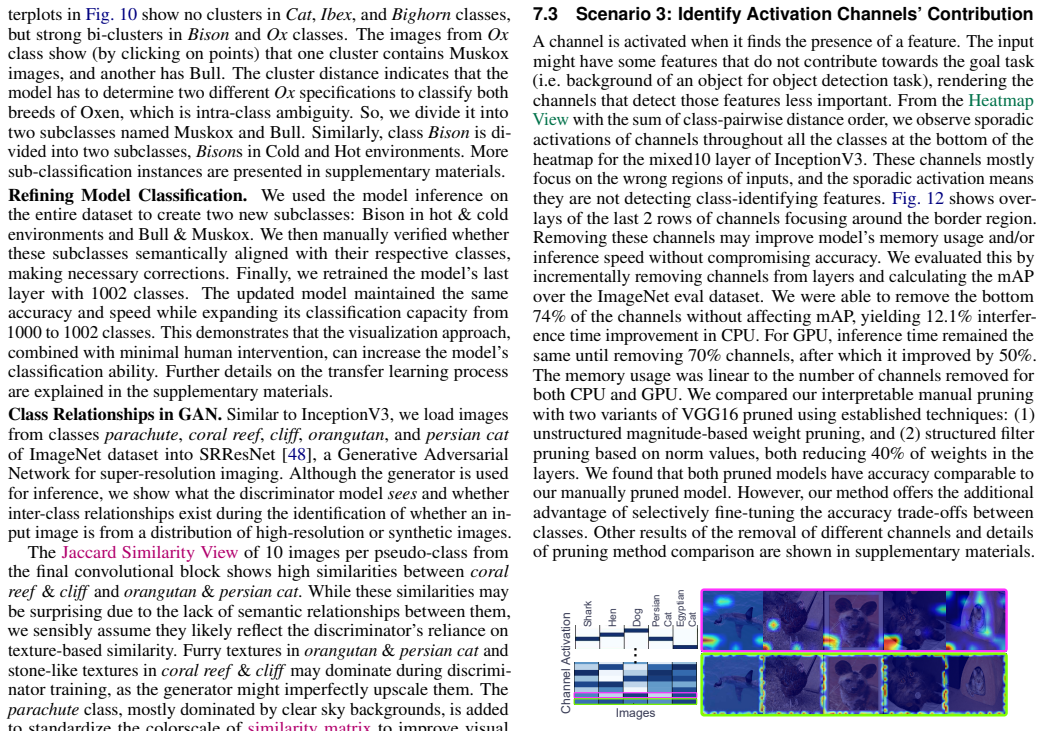
- If the summaries are faithful, a user can prune the bottom channels in the heatmap's ordering: the paper reports removing 74% of channels in a layer without changing mAP and gaining 12.1% inference-time improvement on CPU.
- The class-confusion hierarchy can be turned into model changes: retraining the final layer on new super-classes and subclasses raised the ImageNet classifier from 1000 to 1002 classes at unchanged accuracy.
- Scatterplot sub-clusters that persist across layers are a practical signal for mislabeled data, as shown by tiger images hiding in the tiger-cat class.
- For generative models, distances among activation summaries in a chosen block can position a new output relative to a set of prompts, giving a practical quality signal.
Reading between the lines
- Beyond the paper's examples, a controlled comparison against global average pooling would test whether spatial layout truly adds nothing: if the same views reproduce the findings with location discarded entirely, the intensity-only assumption is strongly supported.
- The method's logic extends naturally to transformer patches if each patch embedding is treated as a pseudo-channel, but the paper's own limitation section notes attention layers are currently unsupported, so that extension is an inference rather than a claim.
- The pruning result suggests a cheap data-driven channel-selection heuristic: order channels by class-pairwise distance and remove the low end, which could be evaluated on models beyond InceptionV3 without retraining.
- Because the summaries ignore location, two classes differing only by the spatial arrangement of identical features would appear fused; probing that boundary directly would clarify how far class separability can be judged from intensity alone.
Signed reviews
Editorial analysis
A structured set of objections, weighed in public.
Referee Report
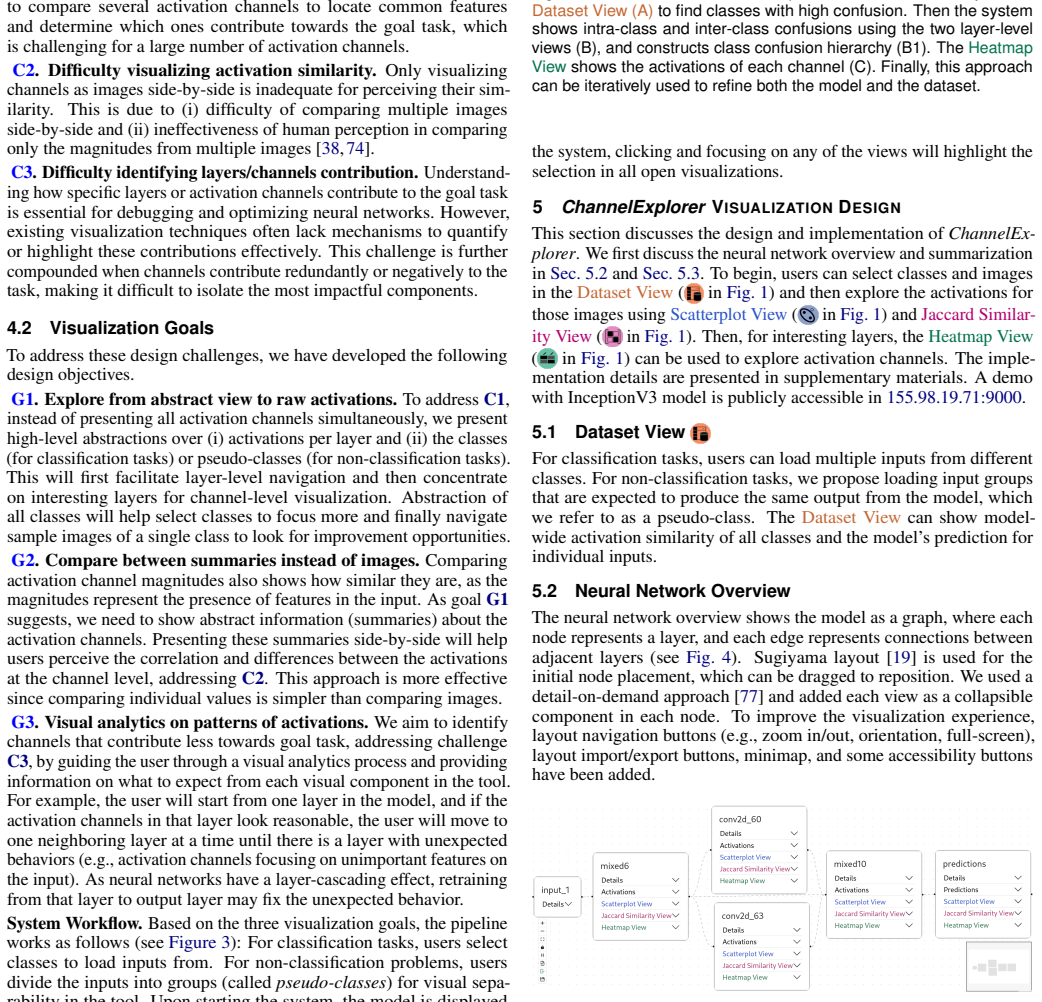
Summary. The paper introduces ChannelExplorer, an interactive visual analytics system for exploring class separability in image-based deep neural networks. The system summarizes each activation channel into a scalar value via four summarization functions, then presents three coordinated views: a Scatterplot View embedding per-image channel-summary vectors, a Jaccard Similarity View measuring overlap between top-activated channel sets, and a Heatmap View ordering channels by class-pairwise distance or other metrics. The paper claims that these views help experts identify inter- and intra-class confusion, derive class hierarchies, find mislabeled images, determine which channels matter, and locate latent states in generative models such as Stable Diffusion. The contributions are demonstrated through four use cases on InceptionV3, SRResNet, and Stable Diffusion, plus a nine-participant user study and a released open-source implementation.
Significance. If the central premise holds, ChannelExplorer addresses a genuine gap: it provides a scalable, model-agnostic, channel-level debugging workflow for image-based networks, going beyond layer-level or metric-level tools. The paper's concrete strengths are its open-source implementation, publicly accessible demo, support for multiple architectures (CNNs, GANs, ResNet, Stable Diffusion), and four use cases spanning classification and generation. The user study, while small, is a reasonable first step. However, the significance is conditional on validating the core summarization assumption, because all three primary views consume scalar channel summaries; if spatial activation structure matters for class separability, the headline use cases would rest on an unvalidated premise. The quantitative pruning claim also needs stronger evidence before the claimed model-refinement benefit can be accepted.
major comments (4)
- [Section 5.3, Eq. (1)] The central claim of the paper depends on the assertion in Section 5.3 that activation magnitude can be identified with intensity alone, regardless of the spatial location of high-intensity pixels. This premise is load-bearing: the Scatterplot View embeds vectors of per-channel summaries, the Jaccard Similarity View selects top-A_eta channels by scalar summary, and the Heatmap View orders and interprets channels using the same scalars. CNNs are translation-covariant, so two classes can have identical per-channel intensity totals while remaining separable by where activations occur. The paper does not validate this assumption quantitatively; Figure 7 is a qualitative comparison, and Section 5.3.2's dismissal of raw activations relies on a pixel-wise distance baseline that is not shown to be the right alternative. Please add a quantitative check that class separability in summary space tracks separability in the full activation tensor, for example by comparing k-nearest-neighbor or clustering accuracy computed on summary vectors versus raw channel vectors across layers, for at least the InceptionV3/ImageNet case and one generative case. Without such a check, the use cases are conditional on an unvalidated premise.
- [Section 7.3] The pruning claim in Section 7.3 is not quantitatively supported. The text reports removing 74% of channels without affecting mAP and a 12.1% CPU inference-time improvement, with a 50% GPU improvement after removing 70% of channels, but it gives no exact mAP values, no baseline mAP, no repeated runs, no error bars, and no statistical test. It also does not specify the precise criterion for stopping channel removal or the variance across model initializations. Because this is one of the four headline use cases and is used to argue for model refinement, please provide a table or figure with exact mAP values for baseline and pruned models, standard deviations over repeated runs, and the corresponding numbers for the two VGG16 baselines, together with a precise description of the pruning protocol.
- [Section 7.5] The user evaluation is described as showing that variations of DR methods, KMeans clustering, and cluster perception do not affect the decision to identify target layers or channels, but the study as reported did not systematically vary these factors and measure decision consistency; participants appear to have used a fixed tool configuration with a facilitator explanation. In T4, all participants selected channels in the bottom half of the heatmap, which may reflect the default ordering or the facilitator's guidance rather than independent identification of misleading channels. Please either temper the findings to what the study actually supports or add a controlled comparison with alternative configurations, inter-participant agreement metrics, and a baseline condition without the tool.
- [Sections 5.3.2 and 5.3.3] The outputs of the Jaccard Similarity View and Heatmap View depend on several user-chosen parameters: eta in A_eta = ceil(eta k), the activation threshold in the summarization function, the default summarization function, and the channel-ordering metric. The paper justifies the defaults by qualitative observation ('we observed ... worked to our expectations') and does not provide a sensitivity analysis. Since the confusion hierarchy and the channel-contribution claims build on these choices, please report how Jl and the heatmap ordering vary with eta and with the choice of summarization function, or provide a principled selection criterion grounded in quantitative separability measures.
minor comments (6)
- [Section 5.3, Eq. (2)] In the L2-norm definition, the second summation runs over x=1 to h; the index should be y=1 to h.
- [Section 5.3.1] There is a dangling cross-reference in the text: '(see ?? in the supplement)' should be resolved to a specific section or figure before publication.
- [Figure 5] The caption mentions 'Geometric Threshold function' while the text refers to 'Sum of threshold'; please unify the terminology.
- [Section 7.3] There is a typo: 'interferference time' should be 'inference time'.
- [Section 5.3.2] The notation A_eta is typeset ambiguously; please define it explicitly as A_eta = ceil(eta k) with a clear subscript.
- [References] The reference for OpenAI Microscope [63] lacks author and year information; please complete the citation.
Circularity Check
No significant circularity: ChannelExplorer is an exploratory visualization system whose views follow from its own definitions rather than from fitted predictions; the only author-overlap citation is peripheral and non-load-bearing.
full rationale
The paper does not derive a quantitative prediction from fitted parameters. Section 5.3 introduces scalar summarization functions S(I) as a design choice for visualizing activation channels, and the Scatterplot, Jaccard, and Heatmap views are computed from those definitions via standard projections, set overlap (Eq. 1), and ordering metrics. The invariance assumption about spatial location is an unvalidated empirical premise, not a circular reduction: no equation in the paper defines class separability in terms of the tool's outputs and then claims to predict that same quantity. The use cases are validated externally or descriptively: pruning is checked against mAP on ImageNet and compared with VGG16 magnitude/filter pruning baselines, mislabel discovery is verified by inspecting labels, and the user study tests task performance. Section 8 also candidly states that class separability remains an open problem and that the tool cannot fully automate diagnosis, which is consistent with an exploratory tool rather than a derived result. The only self-citation is CLAMS [39] in Section 7.5 (Task T2), used to motivate why cluster perception may vary; it does not carry any load-bearing claim about the tool's correctness. Thus the score is in the 0-2 band for a peripheral non-load-bearing self-citation, with no circular step requiring an Eq.-by-Eq. reduction.
Assumptions & free parameters
free parameters (5)
- η (eta) in Jaccard Similarity View =
not reported
- Heatmap activation threshold =
10th percentile
- Blending factor alpha =
0.6
- Default summarization function =
sum of threshold
- Heatmap channel ordering metric =
sum of class-pairwise distance
assumptions (6)
- domain assumption Summarized activation magnitude alone preserves the feature information needed to assess class separability, independent of spatial location.
- domain assumption Jaccard overlap of top-η activated channels measures class confusion.
- domain assumption Clusters visible in UMAP embeddings with X-means hulls reflect true high-dimensional separability.
- domain assumption Stripe patterns in the Heatmap View identify class-selective channels, and channels without stripes are non-contributing.
- domain assumption Modern large image networks do not classify in early layers, so pseudo-classes are needed to analyze early layers.
- domain assumption Visually separated clusters in activation space correspond to semantically meaningful subgroups in the data.
Cite this review
Pith. "Pith review of ChannelExplorer: Exploring Class Separability Through Activation Channel Visualization." pith.science (2026). https://pith.science/paper/HDQMJBGU
@misc{pith2026250504647,
  author       = {Pith},
  title        = {Pith review of: ChannelExplorer: Exploring Class Separability Through Activation Channel Visualization},
  year         = {2026},
  howpublished = {\url{https://pith.science/paper/HDQMJBGU}},
  note         = {Machine review of arXiv:2505.04647}
}
read the original abstract
Deep neural networks (DNNs) achieve state-of-the-art performance in many vision tasks, yet understanding their internal behavior remains challenging, particularly how different layers and activation channels contribute to class separability. We introduce ChannelExplorer, an interactive visual analytics tool for analyzing image-based outputs across model layers, emphasizing data-driven insights over architecture analysis for exploring class separability. ChannelExplorer summarizes activations across layers and visualizes them using three primary coordinated views: a Scatterplot View to reveal inter- and intra-class confusion, a Jaccard Similarity View to quantify activation overlap, and a Heatmap View to inspect activation channel patterns. Our technique supports diverse model architectures, including CNNs, GANs, ResNet and Stable Diffusion models. We demonstrate the capabilities of ChannelExplorer through four use-case scenarios: (1) generating class hierarchy in ImageNet, (2) finding mislabeled images, (3) identifying activation channel contributions, and(4) locating latent states' position in Stable Diffusion model. Finally, we evaluate the tool with expert users.
Figures


Figures from the paper (9 more)





Reference graph
Works this paper leans on
-
[1]
Abraham and N
Y . Abraham and N. Sauwen.Radviz: Project Multidimensional Data in 2D Space, 2025. R package version 0.9.3. 2
2025
-
[2]
A. F. Agarap. Deep Learning using Rectified Linear Units (ReLU). arXiv preprint, 2019. doi: 10.48550/arXiv.1803.08375 5
-
[3]
B. Alsallakh, A. Hanbury, H. Hauser, S. Miksch, and A. Rauber. Visual methods for analyzing probabilistic classification data. IEEE Transactions on Visualization and Computer Graphics, 20(12):1703–1712, 2014. doi: 10.1109/TVCG.2014.2346660 2
arXiv 2014
-
[4]
Alsallakh, A
B. Alsallakh, A. Jourabloo, M. Ye, X. Liu, and L. Ren. Understanding the error structure as a key to regularize convolutional neural networks. Conference on Machine Learning and Systems, 2018. 2, 3
2018
-
[5]
Building Efficient ConvNets using Redundant Feature Pruning
B. Ayinde and J. Zurada. Building efficient convnets using redundant feature pruning. arXiv preprint, 2018. doi: 10.48550/arXiv.1802.07653 7
work page Pith review arXiv doi:10.48550/arxiv.1802.07653 2018
-
[6]
R. Bain, M. Tokarev, H. Kothari, and R. Damineni. Lossplot: A better way to visualize loss landscapes. arXiv preprint, 2021. doi: 10.48550/2111. 15133 1
-
[7]
D. Bau, B. Zhou, A. Khosla, A. Oliva, and A. Torralba. Network dissec- tion: Quantifying interpretability of deep visual representations. In IEEE Computer Vision and Pattern Recognition (CVPR), pp. 6541–6549, 2017. doi: 10.1109/CVPR.2017.354 2, 3
-
[8]
Belcher, A
D. Belcher, A. Prugel-Bennett, and S. Dasmahapatra. Generalisation and the geometry of class separability. In NeurIPS Workshop: Deep Learning through Information Geometry, 2020. 2
2020
Show all 91 references
-
[9]
Bellgardt, C
M. Bellgardt, C. Scheiderer, and T. W. Kuhlen. An Immersive Node-Link Visualization of Artificial Neural Networks for Machine Learning Experts. In IEEE Conference on Artificial Intelligence and Virtual Reality (AIVR), pp. 33–36, 2020. doi: 10.1109/AIVR50618.2020.00015 3
2020
-
[10]
nearest neighbor
K. Beyer, J. Goldstein, R. Ramakrishnan, and U. Shaft. When is “nearest neighbor” meaningful? In Database Theory — ICDT, pp. 217–235, 1999. doi: 10.1007/3-540-49257-7_15 5
1999 doi
-
[11]
J. Bian. Quiver. https://github.com/keplr-io/quiver, 2016. 3
2016
-
[12]
Bilal, A
A. Bilal, A. Jourabloo, M. Ye, X. Liu, and L. Ren. Do convolutional neural networks learn class hierarchy? IEEE Transactions on Visualization and Computer Graphics, 24(1):152–162, 2017. doi: 10.1109/TVCG.2017.2744683 2
2017
-
[13]
Carter, Z
S. Carter, Z. Armstrong, L. Schubert, I. Johnson, and C. Olah. Activation atlas. Distill, 2019. doi: 10.23915/distill.00015 2, 3
2019 doi
-
[14]
Catmull and R
E. Catmull and R. Rom. A class of local interpolating splines. InComputer Aided Geometric Design, pp. 317–326. Academic Press, 1974. doi: 10. 1016/B978-0-12-079050-0.50020-5 5
1974
- [15]
-
[16]
Chung, S
S. Chung, S. Suh, C. Park, K. Kang, J. Choo, and B. C. Kwon. Re- vacnn: Real-Time visual analytics for convolutional neural network. ACM SIGKDD Workshop on Interactive Data Exploration and Analytics (IDEA),
-
[17]
Clevert, T
D.-A. Clevert, T. Unterthiner, and S. Hochreiter. Fast and Accurate Deep Network Learning by Exponential Linear Units (ELUs). arXiv preprint,
-
[18]
N. Das, H. Park, Z. J. Wang, F. Hohman, R. Firstman, E. Rogers, and D. H. P. Chau. Bluff: Interactively deciphering adversarial attacks on deep neural networks. In IEEE Visualization Conference (VIS), pp. 271–275,
-
[19]
Eiglsperger, M
M. Eiglsperger, M. Siebenhaller, and M. Kaufmann. An efficient imple- mentation of sugiyama’s algorithm for layered graph drawing. In Graph Drawing, pp. 155–166, 2005. doi: 10.1007/978-3-540-31843-9_17 4
2005 doi
-
[20]
Erhan, Y
D. Erhan, Y . Bengio, A. Courville, and P. Vincent. Visualizing higher-layer features of a deep network. Technical Report, University of Montreal ,
-
[21]
Fong and A
R. Fong and A. Vedaldi. Net2vec: Quantifying and explaining how concepts are encoded by filters in deep neural networks. InIEEE Computer Vision and Pattern Recognition (CVPR) , 2018. doi: 10.1109/CVPR.2018. 00910 3
2018 doi
- [22]
-
[23]
Ghorbani, J
A. Ghorbani, J. Wexler, J. Y . Zou, and B. Kim. Towards automatic concept-based explanations. In Advances in Neural Information Process- ing Systems, pp. 9273–9282, 2019. 3
2019
-
[24]
Ghosh, C
K. Ghosh, C. Bellinger, R. Corizzo, P. Branco, B. Krawczyk, and N. Jap- kowicz. The class imbalance problem in deep learning. Machine Learning, 113(7):4845–4901, 2024. doi: 10.1007/s10994-022-06268-8 2
2024 doi
-
[25]
R. B. Girshick, J. Donahue, T. Darrell, and J. Malik. Rich feature hierar- chies for accurate object detection and semantic segmentation. In IEEE Computer Vision and Pattern Recognition (CVPR), pp. 580–587, 2014. doi: 10.1109/CVPR.2014.81 1
2014 doi
-
[27]
Görtler, F
J. Görtler, F. Hohman, D. Moritz, K. Wongsuphasawat, D. Ren, R. Nair, M. Kirchner, and K. Patel. Neo: Generalizing confusion matrix visualiza- tion to hierarchical and multi-output labels. In ACM SIGCHI Conference on Human Factors in Computing Systems , 2022. doi: 10.1145/3491...
2022 doi
-
[28]
Granziol, X
D. Granziol, X. Wan, and T. Garipov. Deep curvature suite.arXiv preprint,
-
[29]
A. W. Harley. An Interactive Node-Link Visualization of Convolutional Neural Networks. In International Symposium on Visual Computing (ISVC), pp. 867–877, 2015. doi: 10.1007/978-3-319-27857-5_77 3
2015 doi
- [30]
- [31]
-
[32]
Hoeiness, A
H. Hoeiness, A. Harstad, and G. Friedland. From tinkering to engineering: Measurements in tensorflow playground. arXiv preprint, 2021. doi: 10. 48550/2101.04141 3
2021 arXiv
-
[33]
Hohman, H
F. Hohman, H. Park, C. Robinson, and D. H. Chau. Summit: Scaling deep learning interpretability by visualizing activation and attribution summa- rizations. IEEE Transactions on Visualization and Computer Graphics,
-
[35]
G. Hu, Y . Yang, D. Yi, J. Kittler, W. J. Christmas, S. Z. Li, and T. M. Hospedales. When face recognition meets with deep learning: an evalua- tion of convolutional neural networks for face recognition. IEEE Interna- tional Conference on Computer Vision Workshop (ICCVW), 2015...
2015
-
[36]
Huang, A
J. Huang, A. Mishra, B. C. Kwon, and C. Bryan. Conceptexplainer: Inter- active explanation for deep neural networks from a concept perspective. IEEE Transactions on Visualization and Computer Graphics, 29(1):831– 841, 2023. doi: 10.1109/TVCG.2022.3209384 3
2023
-
[37]
doi: 10.1109/TVCG.2019.2934659 2, 3
2019
-
[38]
Horoi, J
S. Horoi, J. Huang, G. Wolf, and S. Krishnaswamy. Visualizing high- dimensional trajectories on the loss-landscape of ANNs. OpenReview,
-
[39]
H. Jeon, G. J. Quadri, H. Lee, P. Rosen, D. A. Szafir, and J. Seo. Clams: A cluster ambiguity measure for estimating perceptual variability in visual clustering. IEEE Transactions on Visualization and Computer Graphics, 30(1):770–780, 2024. doi: 10.1109/TVCG.2023.3327201 9
2024
-
[40]
Kahng, P
M. Kahng, P. Y . Andrews, A. Kalro, and D. H. Chau. Activis: Visual exploration of industry-scale deep neural network models. IEEE Transac- tions on Visualization and Computer Graphics, 2017. doi: 10.1109/TVCG. 2017.2744718 3
2017
-
[42]
P. Jaccard. Étude comparative de la distribution florale dans une portion des alpes et des jura. Bull Soc Vaudoise Sci Nat, 37:547–579, 1901. 6
1901
-
[43]
D. E. Jacobs, D. B. Goldman, and E. Shechtman. Cosaliency: where people look when comparing images. In ACM Symposium on User Interface Software and Technology (UIST), pp. 219–228, 2010. doi: 10.1145/1866029 .1866066 4
2010 doi
- [44]
-
[45]
Kolesnikov, A
A. Kolesnikov, A. Dosovitskiy, D. Weissenborn, G. Heigold, J. Uszkoreit, L. Beyer, M. Minderer, M. Dehghani, N. Houlsby, S. Gelly, T. Unterthiner, and X. Zhai. An image is worth 16x16 words: Transformers for image recognition at scale. 2021. 9
2021
-
[46]
Krizhevsky, I
A. Krizhevsky, I. Sutskever, and G. E. Hinton. Imagenet classification with deep convolutional neural networks. Communications of the ACM, 60(6):84–90, 2017. doi: 10.1145/3065386 1
2017 doi
-
[47]
Kapoor, B
A. Kapoor, B. Lee, D. Tan, and E. Horvitz. Interactive optimization for steering machine classification. In ACM SIGCHI Conference on Human Factors in Computing Systems, pp. 1343–1352. Association for Computing Machinery, 2010. doi: 10.1145/1753326.1753529 2
2010
-
[48]
B. Kim, M. Wattenberg, J. Gilmer, C. Cai, J. Wexler, F. Viegas, and R. Sayres. Interpretability beyond feature attribution: Quantitative testing with concept activation vectors (TCA V). InInternational Conference on Machine Learning, vol. 80 of Proceedings of Machine Learning ...
2018
- [49]
-
[50]
S. P. Leeman-Munk, S. Sethi, C. G. Healey, S. Nie, K. Padia, R. Devarajan, D. J. Caira, J. R. Benson, J. A. Cox, L. E. Lewis, et al. Visualizing convolutional neural networks, 2019. US Patent 10,192,001. 3
2019
-
[51]
D. Liu, W. Cui, K. Jin, Y . Guo, and H. Qu. Deeptracker: Visualizing the training process of convolutional neural networks. ACM Trans. Intell. Syst. Technol., 10(1):6:1–6:25, 2019. doi: 10.1145/3200489 2
2019 doi
-
[52]
J. B. Kruskal. Multidimensional scaling by optimizing goodness of fit to a nonmetric hypothesis. Psychometrika, 29(1):1–27, 1964. doi: 10. 1007/BF02289565 5
1964
-
[53]
Ledig, L
C. Ledig, L. Theis, F. Huszár, J. Caballero, A. Cunningham, A. Acosta, A. Aitken, A. Tejani, J. Totz, Z. Wang, and W. Shi. Photo-realistic single image super-resolution using a generative adversarial network. In IEEE Computer Vision and Pattern Recognition (CVPR), pp. 105–114,...
2017 doi
-
[54]
Y . Luo, Y . Wong, M. Kankanhalli, and Q. Zhao.G -softmax: Improving intraclass compactness and interclass separability of features. IEEE Trans- actions on Neural Networks and Learning Systems, 31(2):685–699, 2020. doi: 10.1109/TNNLS.2019.2909737 2
2020
-
[55]
L. v. d. Maaten and G. Hinton. Visualizing Data using t-SNE. Journal of Machine Learning Research, 9(86):2579–2605, 2008. 3, 5
2008
-
[56]
Ma´ckiewicz and W
A. Ma´ckiewicz and W. Ratajczak. Principal components analysis (PCA). Computers & Geosciences, 19(3):303–342, 1993. doi: 10.1016/0098-3004 (93)90090-R 5
1993 doi
-
[57]
M. Liu, S. Liu, H. Su, K. Cao, and J. Zhu. Analyzing the noise robustness of deep neural networks. arXiv preprint, 2018. doi: 10.1109/TVCG.2020. 2969185 3
2018 doi
-
[58]
Z. Liu, H. Mao, C.-Y . Wu, C. Feichtenhofer, T. Darrell, and S. Xie. A convnet for the 2020s. IEEE Computer Vision and Pattern Recognition (CVPR), 2022. doi: 10.1109/CVPR52688.2022.01167 7
2022
-
[59]
Mordvintsev, C
A. Mordvintsev, C. Olah, and M. Tyka. Inceptionism: Going deeper into neural networks, 2015. 3
2015
-
[60]
Nguyen, J
A. Nguyen, J. Yosinski, Y . Bengio, A. Dosovitskiy, and J. Clune. Plug & play generative networks: Conditional iterative generation of images in latent space. In IEEE Computer Vision and Pattern Recognition (CVPR),
-
[61]
C. Olah, A. Mordvintsev, and L. Schubert. Feature visualization. Distill,
- [62]
-
[63]
C. Molnar. Interpretable Machine Learning. Web, 2 ed., 2022. 3
2022
-
[64]
N. Otsu. A threshold selection method from gray-level histograms. IEEE Transactions on Systems, Man, and Cybernetics, 9(1):62–66, 1979. doi: 10.1109/TSMC.1979.4310076 5
1979
-
[65]
Pelleg and A
D. Pelleg and A. W. Moore. X-means: Extending k-means with efficient estimation of the number of clusters. In International Conference on Machine Learning, ICML, 8 pages, pp. 727–734, 2000. 5
2000
-
[66]
doi: 10.1109/CVPR.2017.374 3
2017 doi
-
[67]
Pezzotti, T
N. Pezzotti, T. Höllt, J. Van Gemert, B. P. Lelieveldt, E. Eisemann, and A. Vilanova. Deepeyes: Progressive visual analytics for designing deep neural networks. IEEE Transactions on Visualization and Computer Graphics, 24(1):98–108, 2017. doi: 10.1109/TVCG.2017.2744358 3
2017
-
[68]
Pühringer, A
M. Pühringer, A. Hinterreiter, and M. Streit. Instanceflow: Visualizing the evolution of classifier confusion at the instance level. InIEEE Visualization Conference – Short Papers, 2020. doi: 10.1109/VIS47514.2020.00065 2, 3
2020
-
[69]
C. Olah, A. Satyanarayan, I. Johnson, S. Carter, L. Schubert, K. Ye, and A. Mordvintsev. The building blocks of interpretability. Distill, 2018. doi: 10.23915/distill.00010 2
2018 doi
-
[70]
OpenAI Microscope. 3
-
[71]
Rathore, N
A. Rathore, N. Chalapathi, S. Palande, and B. Wang. TopoAct: Visually Exploring the Shape of Activations in Deep Learning. Computer Graphics Forum, 40(1):382–397, 2021. doi: 10.1111/cgf.14195 3
2021 doi
-
[72]
Redmon and A
J. Redmon and A. Farhadi. Yolov3: An incremental improvement. arXiv preprint, 2018. 2
2018
-
[73]
Pezzotti, T
N. Pezzotti, T. Höllt, B. Lelieveldt, E. Eisemann, and A. Vilanova. Hi- erarchical stochastic neighbor embedding. Computer Graphics Forum, 35(3):21–30, 2016. doi: 10.1111/cgf.12878 3
2016 doi
-
[74]
Rosenfeld, M
A. Rosenfeld, M. D. Solbach, and J. K. Tsotsos. Totally Looks Like - How Humans Compare, Compared to Machines. In IEEE Computer Vision and Pattern Recognition Workshops, pp. 1961–1964, 2018. doi: 10. 1007/978-3-030-20887-5_18 4
1961
-
[75]
Schorr, P
C. Schorr, P. Goodarzi, F. Chen, and T. Dahmen. Neuroscope: An Ex- plainable AI Toolbox for Semantic Segmentation and Image Classification of Convolutional Neural Nets. Applied Sciences, 11(5):2199, 2021. doi: 10.3390/app11052199 3
2021 doi
-
[76]
https://pypi.org/
Python package index - pypi. https://pypi.org/. 7
-
[77]
Radford, J
A. Radford, J. W. Kim, C. Hallacy, A. Ramesh, G. Goh, S. Agarwal, G. Sastry, A. Askell, P. Mishkin, J. Clark, G. Krueger, and I. Sutskever. Learning transferable visual models from natural language supervision. CoRR, abs/2103.00020, 2021. 2
2021 arXiv
-
[78]
Sultana, A
F. Sultana, A. Sufian, and P. Dutta. Evolution of image segmentation using deep convolutional neural network: A survey. Knowledge-Based Systems,
-
[79]
Talbot, B
J. Talbot, B. Lee, A. Kapoor, and D. S. Tan. Ensemblematrix: interactive visualization to support machine learning with multiple classifiers. In ACM SIGCHI Conference on Human Factors in Computing Systems, pp. 1283–1292, 2009. doi: 10.1145/1518701.1518895 2
2009
-
[80]
D. Ren, S. Amershi, B. Lee, J. Suh, and J. Williams. Squares: Supporting interactive performance analysis for multiclass classifiers. In IEEE VAST, August 2016. doi: 10.1109/TVCG.2016.2598828 2
2016
- [81]
-
[82]
J. Wang, L. Gou, H. Shen, and H. Yang. Dqnviz: A visual analytics approach to understand deep q-networks. IEEE Transactions on Visual- ization and Computer Graphics, 25(1):288–298, 2019. doi: 10.1109/TVCG. 2018.2864504 2
2019
-
[83]
Seifert, A
C. Seifert, A. Aamir, A. Balagopalan, D. Jain, A. Sharma, S. Grottel, and S. Gumhold. Visualizations of Deep Neural Networks in Computer Vision: A Survey. In Transparent Data Mining for Big and Small Data, pp. 123–144, 2017. doi: 10.1007/978-3-319-54024-5_6 2
2017 doi
-
[84]
Shneiderman
B. Shneiderman. The eyes have it: a task by data type taxonomy for information visualizations. In IEEE Symposium on Visual Languages, pp. 336–343, 1996. doi: 10.1109/VL.1996.545307 4
1996
- [85]
-
[86]
doi: 10.1016/j.knosys.2020.106062 1
2020
-
[87]
H. Zeng, H. Haleem, X. Plantaz, N. Cao, and H. Qu. Cnncomparator: Comparative analytics of convolutional neural networks. arXiv preprint,
-
[88]
https://cs.stanford.edu/people/ karpathy/cnnembed/
t-sne visualization of cnn codes. https://cs.stanford.edu/people/ karpathy/cnnembed/. 3
-
[91]
Z. J. Wang, R. Turko, O. Shaikh, H. Park, N. Das, F. Hohman, M. Kahng, and D. H. Chau. Cnn explainer: Learning convolutional neural networks with interactive visualization. IEEE Transactions on Visualization and Computer Graphics, 27:1396–1406, 2020. doi: 10.1109/TVCG.2020.3030418 3
2020
-
[92]
L. Xue, X. Zhang, W. Jiang, K. Huo, and Q. Shen. A classification performance evaluation measure considering data separability. InArtificial Neural Networks and Machine Learning – ICANN, pp. 1–13, 2023. doi: 10.1007/978-3-031-44207-0_1 2
2023 doi
- [94]
- [2016]
-
[2017]
doi: 10.23915/distill
https://distill.pub/2017/feature-visualization. doi: 10.23915/distill. 00007 2, 3
2017 doi
-
[2021]
https://openreview.net/forum?id=uhiF-dV99ir. 1
Reviewed August 15, 2026 · model on record in the stance chip above.
Discussion (0). Continue with ORCID to comment.