Adaptive rerouting reshapes impacts of maritime chokepoint disruptions
Pith reviewed 2026-06-27 05:00 UTC · model grok-4.3
The pith
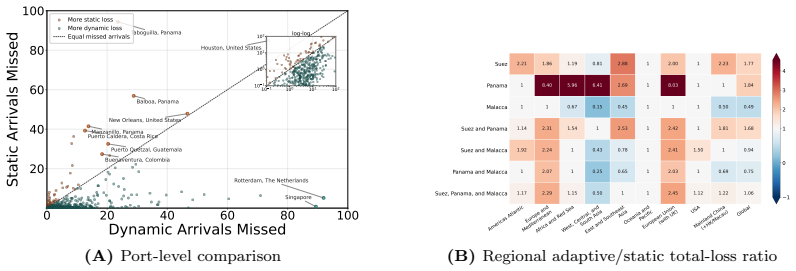
Adaptive rerouting turns static chokepoint exposure into cumulative arrival losses that grow with each extra day of closure.
A machine-rendered reading of the paper's core claim, the machinery that carries it, and where it could break.
Core claim
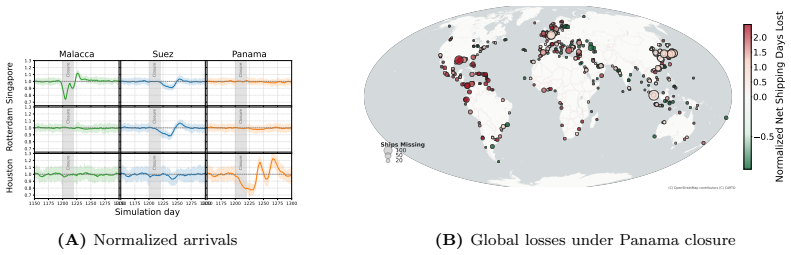
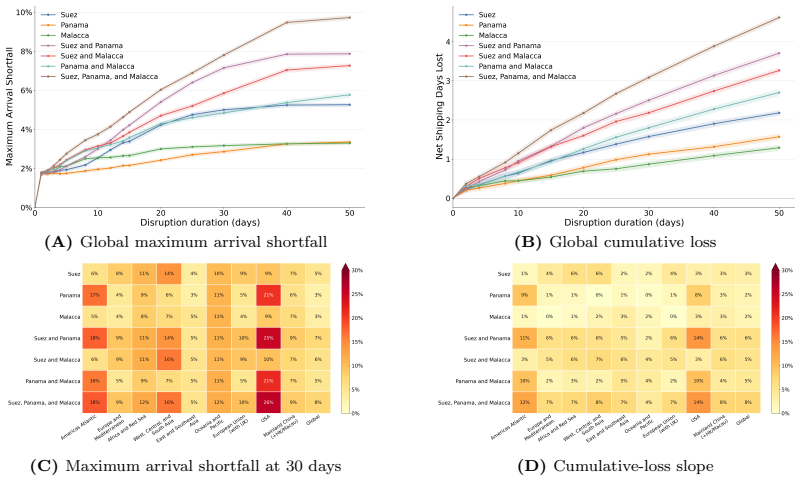
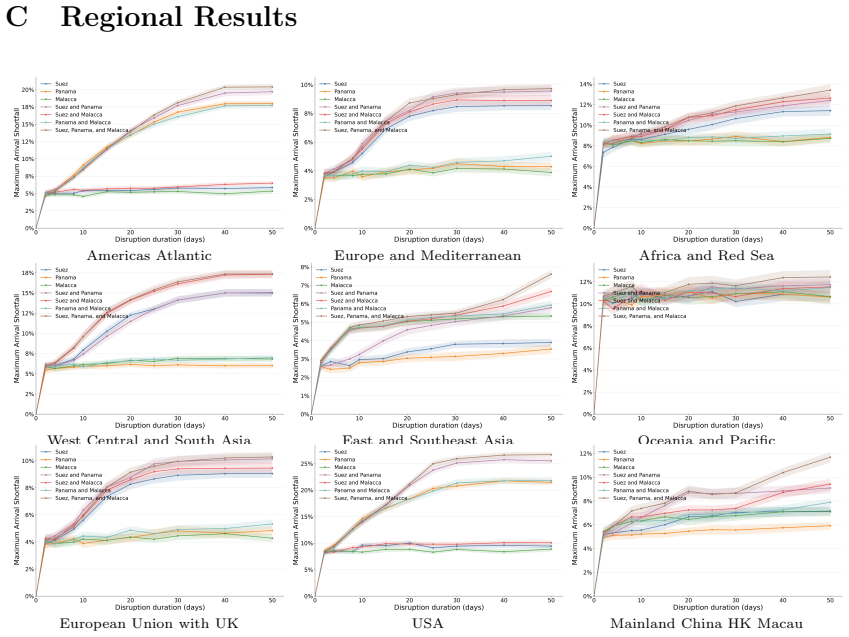
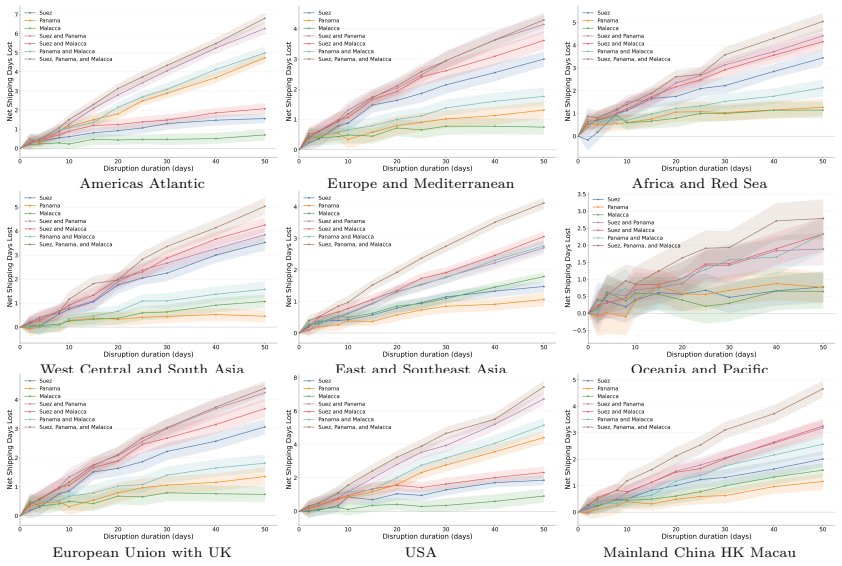
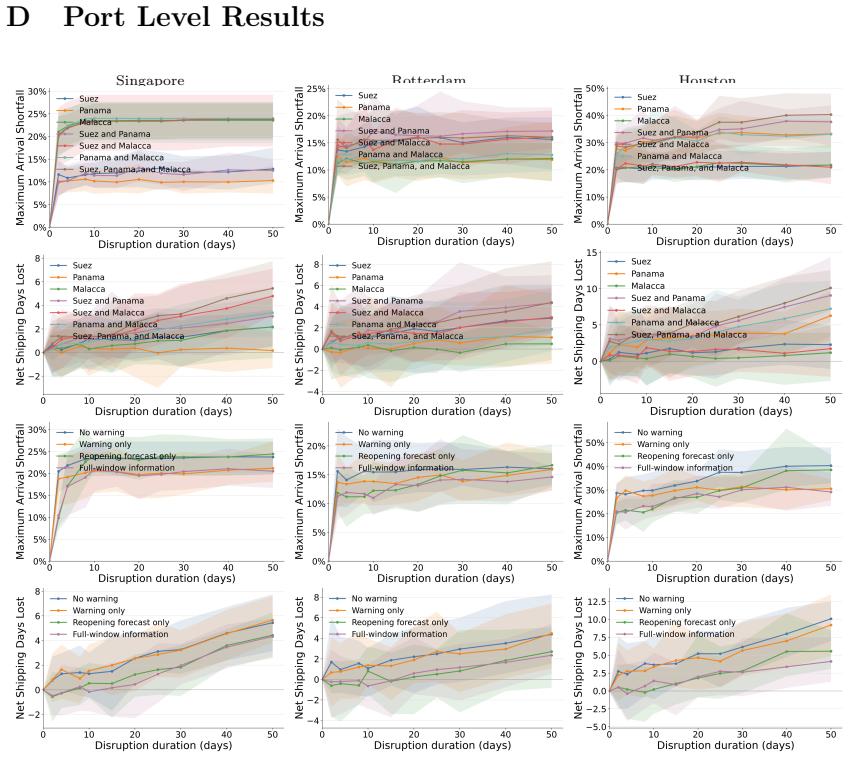
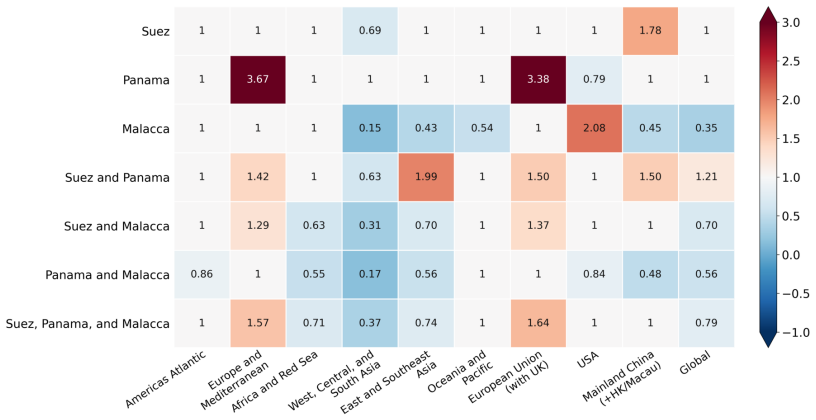
Static route exposure alone does not predict realized losses. In the adaptive model, rerouting reduces losses at some directly exposed ports, while delayed vessel cycles create losses at later port calls and in dependent regions. Cumulative net shipping-day losses therefore continue to rise with closure duration because longer routes keep ships delayed after the initial adjustment.
What carries the argument
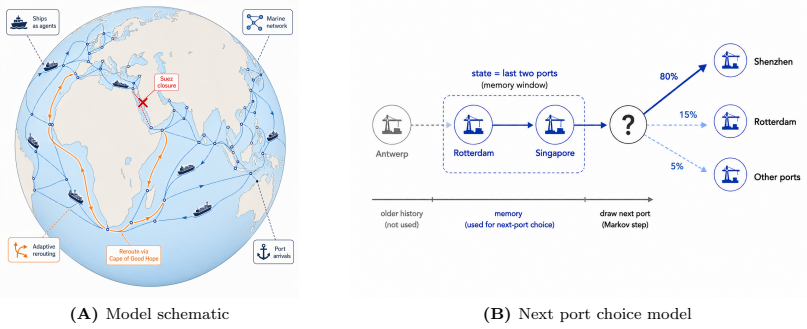
Empirically calibrated agent-based model of 35,954 ships moving among 1,651 ports that simulates rerouting decisions and port-call sequencing under closure scenarios.
If this is right
- Rerouting lowers losses at directly exposed ports but transfers them downstream to later calls and dependent regions.
- Cumulative losses rise steadily with closure length because longer routes sustain delays after the initial adjustment.
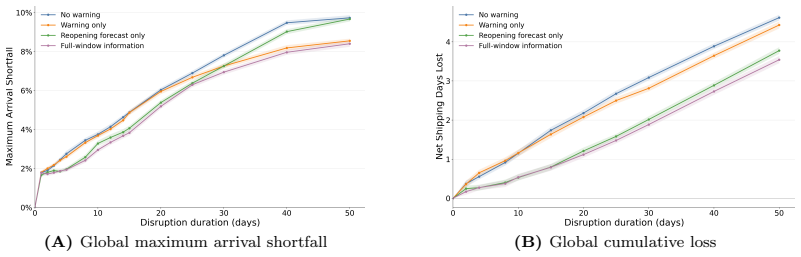
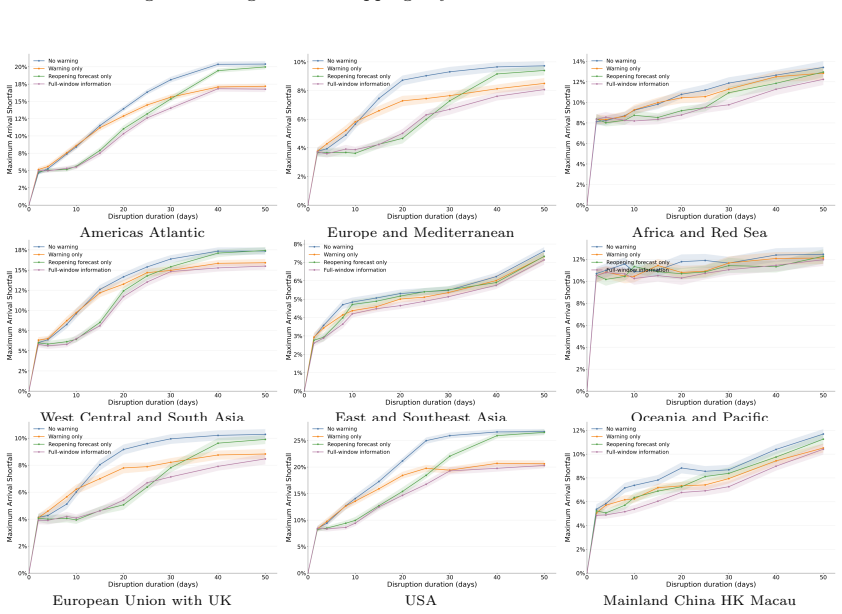
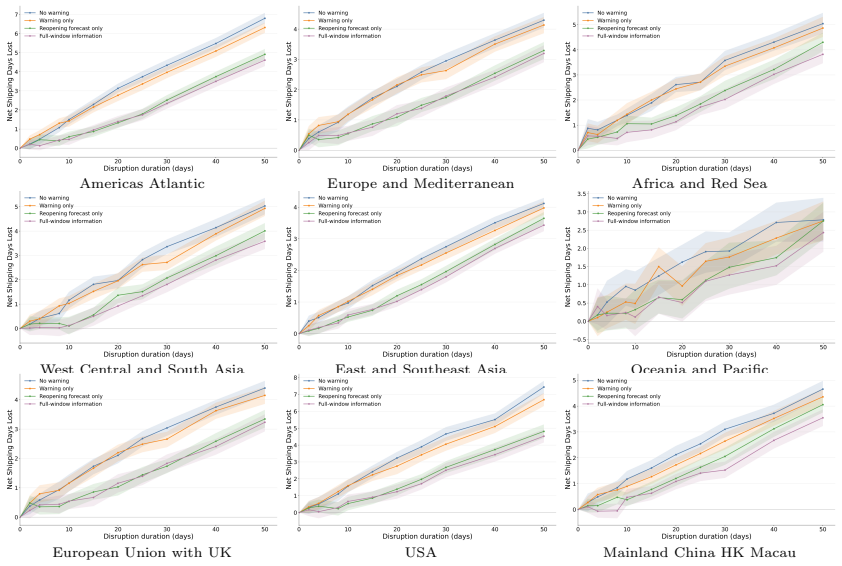
- Knowing the expected duration of a disruption produces lower short-run losses than an equivalent shock of unknown length.
- Impacts remain uneven across ports and regions even after adaptation.
Where Pith is reading between the lines
- Supply-chain planners could reduce avoidable losses by treating chokepoint risk as a time-dependent routing problem rather than a fixed network property.
- The same modeling approach could be extended to test whether similar adaptive delays appear in other time-sensitive networks such as air cargo or just-in-time manufacturing.
Load-bearing premise
The empirically calibrated rules for how ships choose routes and sequence port calls faithfully reproduce real-world adaptive decisions and schedule propagation.
What would settle it
Direct comparison of model-predicted daily arrival reductions (3.0 percent per Suez day, 7.7 percent per triple-chokepoint day) against observed global port-call counts during an actual extended closure.
Figures
read the original abstract
Maritime chokepoints concentrate shipping traffic. Disruptions to this traffic can have a widespread impact on the global economy. However, the way in which these impacts are shaped by the shipping sector's adaptive behavior is not well understood. Here, we introduce an empirically calibrated full-scale agent-based model of the global commercial shipping fleet, representing 35,954 active ships moving among 1,651 ports. We use the model to quantify how rerouting changes arrival losses under chokepoint closures. Static route exposure alone does not predict realized losses. In the adaptive model, rerouting reduces losses at some directly exposed ports, while delayed vessel cycles create losses at later port calls and in dependent regions. Cumulative net shipping-day losses therefore continue to rise with closure duration because longer routes keep ships delayed after the initial adjustment. Each additional closure day reduces global shipping arrivals by 3.0% for Suez and 7.7% for simultaneous Suez, Panama, and Malacca closures. These losses are unevenly distributed in exposed regions and ports. Disruptions with known duration show different loss profiles from unexpected shocks with unknown duration, revealing that end-date information can reduce avoidable short-run losses. The results show that chokepoint risk is a dynamic problem of routing, timing, and regional exposure and not a static property of maritime-network topology.
Editorial analysis
A structured set of objections, weighed in public.
Referee Report
Summary. The manuscript introduces an empirically calibrated agent-based model of the global commercial shipping fleet (35,954 ships among 1,651 ports) to quantify how adaptive rerouting alters arrival losses during chokepoint closures. It claims that static route exposure does not predict realized losses; rerouting reduces losses at some directly exposed ports while delayed vessel cycles create losses at later calls and dependent regions. Cumulative net shipping-day losses continue to rise with closure duration, yielding per-day global arrival reductions of 3.0% for Suez closures and 7.7% for simultaneous Suez-Panama-Malacca closures. The model further distinguishes loss profiles between known-duration and unexpected disruptions.
Significance. If the adaptive rules are shown to reproduce observed behavior, the work establishes that chokepoint risk is a dynamic routing-and-timing problem rather than a static network property, providing quantitative evidence that adaptation reshapes but does not eliminate losses and that end-date information can mitigate short-run impacts. The full-scale, data-calibrated simulation is a methodological strength relative to aggregate or topology-only approaches.
major comments (2)
- [Model construction paragraph (abstract and Methods)] Model construction paragraph (abstract and Methods): The statement that the model is 'empirically calibrated' to port and fleet data is not accompanied by any reported validation metrics (e.g., comparison of simulated reroute choices or port-call timing against vessel trajectory data from the 2021 Suez blockage or other historical events). This is load-bearing for the central claims because the reported 3.0% and 7.7% daily reductions and the reshaping of losses across ports and regions are direct outputs of the routing and sequencing rules.
- [Results on cumulative losses (Results section)] Results on cumulative losses (Results section): The assertion that 'cumulative net shipping-day losses therefore continue to rise with closure duration because longer routes keep ships delayed after the initial adjustment' is presented without accompanying sensitivity analysis on closure length, alternative routing heuristics, or the fraction of vessels that actually reroute. This directly supports the headline per-day loss rates and the claim that losses are not front-loaded.
minor comments (1)
- [Abstract] Abstract: The phrase 'each additional closure day reduces global shipping arrivals by 3.0%' should be clarified as a marginal daily rate derived from the simulation rather than an instantaneous percentage drop, to avoid misinterpretation.
Simulated Author's Rebuttal
We thank the referee for the constructive comments. We address each major point below and will revise the manuscript to strengthen the presentation of calibration and robustness checks.
read point-by-point responses
-
Referee: The statement that the model is 'empirically calibrated' to port and fleet data is not accompanied by any reported validation metrics (e.g., comparison of simulated reroute choices or port-call timing against vessel trajectory data from the 2021 Suez blockage or other historical events). This is load-bearing for the central claims because the reported 3.0% and 7.7% daily reductions and the reshaping of losses across ports and regions are direct outputs of the routing and sequencing rules.
Authors: We agree that explicit validation metrics against historical events would strengthen the claims. The term 'empirically calibrated' in the current manuscript refers to model initialization with real fleet composition (35,954 ships), port locations, and baseline route frequencies drawn from public AIS-derived datasets. However, we did not report quantitative comparisons to the 2021 Suez blockage. In revision we will add a dedicated validation subsection (likely in Methods) that compares simulated reroute decisions and port-call timing to observed vessel trajectories from that event, including metrics such as route-choice accuracy and delay reproduction. revision: yes
-
Referee: The assertion that 'cumulative net shipping-day losses therefore continue to rise with closure duration because longer routes keep ships delayed after the initial adjustment' is presented without accompanying sensitivity analysis on closure length, alternative routing heuristics, or the fraction of vessels that actually reroute. This directly supports the headline per-day loss rates and the claim that losses are not front-loaded.
Authors: We accept that additional sensitivity analyses are needed to support the headline per-day rates and the claim that losses are not front-loaded. The reported behavior follows from the model's adaptive rule set and the resulting extension of vessel cycles. In the revised Results section we will add sensitivity tests that (i) vary closure duration, (ii) compare the baseline heuristic against at least one alternative rerouting rule, and (iii) report the share of vessels that elect to reroute versus wait. These checks will confirm whether the cumulative-loss trajectory and per-day percentages remain stable. revision: yes
Circularity Check
No circularity: results are forward simulation outputs from externally calibrated model
full rationale
The paper's core quantitative results (3.0% and 7.7% per-day arrival reductions, plus reshaping of losses via rerouting) are generated by running an agent-based simulation of 35,954 ships under hypothetical chokepoint closure scenarios. The model is described as empirically calibrated to independent external port and fleet data, but the reported loss trajectories and port-specific effects are not equivalent to those calibration inputs by construction; they emerge from applying the routing rules to new disruption conditions. No self-citations, uniqueness theorems, ansatzes, or fitted-input predictions are invoked as load-bearing steps in the provided text. The derivation is a computational experiment, self-contained against external benchmarks.
Axiom & Free-Parameter Ledger
Reference graph
Works this paper leans on
-
[1]
Simulated global empty containers repositioning using agent-based modelling.Systems, 11(3):130, 2023
Alaa Abdelshafie, Bojan Rupnik, and Tomaˇ z Kramberger. Simulated global empty containers repositioning using agent-based modelling.Systems, 11(3):130, 2023. ISSN 2079-8954. doi: 10.3390/systems11030130. URLhttps://www.mdpi.com/2079-8954/11/3/130
-
[2]
Serkan Arslanalp, Marco Marini, and Patrizia Tumbarello. Big data on vessel traffic: Now- casting trade flows in real time.IMF Working Papers, 2019(275):34, 2019. doi: 10.5089/97 81513521121.001. URLhttps://www.imf.org/en/Publications/WP/Issues/2019/12/13 /Big-Data-on-Vessel-Traffic-Nowcasting-Trade-Flows-in-Real-Time-48837
work page doi:10.5089/97 2019
-
[3]
Nowcasting global trade from space.IMF Working Papers, 2025(093):37, 2025
Serkan Arslanalp, Seung Mo Choi, Parisa Kamali, Robin Koepke, Matthew McKetty, Michele Ruta, Mario Saraiva, Alessandra Sozzi, and Jasper Verschuur. Nowcasting global trade from space.IMF Working Papers, 2025(093):37, 2025. doi: 10.5089/9798229009294.001. URL https://www.imf.org/en/Publications/WP/Issues/2025/05/16/Nowcasting-Global-T rade-from-Space-566957
-
[4]
A metric of global maritime supply chain disruptions: The global supply chain stress index (GSCSI)
Jean-Fran¸ cois Arvis, Cordula Rastogi, Jean-Paul Rodrigue, and Daria Ulybina. A metric of global maritime supply chain disruptions: The global supply chain stress index (GSCSI). Technical Report 10839, World Bank, 2024. URLhttps://documents.worldbank.org/cu rated/en/099746107032431443/pdf/IDU19447dab513757140b1193cd19643f0ab7c10.pdf. 31
arXiv 2024
-
[5]
Geography, transporta- tion, and endogenous trade costs.Econometrica, 88(2):657–691, 2020
Giulia Brancaccio, Myrto Kalouptsidi, and Theodore Papageorgiou. Geography, transporta- tion, and endogenous trade costs.Econometrica, 88(2):657–691, 2020. ISSN 1468-0262. doi: 10.3982/ECTA15455. URLhttps://onlinelibrary.wiley.com/doi/abs/10.3982/ECTA 15455. eprint: https://onlinelibrary.wiley.com/doi/pdf/10.3982/ECTA15455
-
[6]
Agustina Calatayud, John Mangan, and Roberto Palacin. Vulnerability of international freight flows to shipping network disruptions: A multiplex network perspective.Transporta- tion Research Part E: Logistics and Transportation Review, 108:195–208, 2017. ISSN 1366-
2017
-
[7]
URLhttps://www.sciencedirect.com/science/ar ticle/pii/S1366554516307013
doi: 10.1016/j.tre.2017.10.015. URLhttps://www.sciencedirect.com/science/ar ticle/pii/S1366554516307013
-
[8]
Simone Caschili and Francesca Romana Medda. A review of the maritime container shipping industry as a complex adaptive system.Interdisciplinary Description of Complex Systems : INDECS, 10(1):1–15, 2012. ISSN 1334-4684, 1334-4676. doi: 10.7906/indecs.10.1.1. URL https://hrcak.srce.hr/77881
-
[9]
Cerdeiro, Andras Komaromi, Yang Liu, and Mamoon Saeed
Diego A. Cerdeiro, Andras Komaromi, Yang Liu, and Mamoon Saeed. World seaborne trade in real time: A proof of concept for building AIS-based nowcasts from scratch.IMF Working Papers, 2020(057):44, 2020. doi: 10.5089/9781513544106.001. URLhttps://www.imf.org/ en/publications/wp/issues/2020/05/14/world-seaborne-trade-in-real-time-a-pro of-of-concept-for-bui...
-
[10]
SeaRoute: Compute shortest maritime routes between ports.https://github.c om/eurostat/searoute, 2021
Eurostat. SeaRoute: Compute shortest maritime routes between ports.https://github.c om/eurostat/searoute, 2021. Accessed: 2026-02-03
2021
-
[11]
R. W. Fransen and I. Y. Davydenko. Empirical agent-based model simulation for the port nautical services: A case study for the Port of Rotterdam.Maritime Transport Research, 2: 100040, 2021. ISSN 2666-822X. doi: 10.1016/j.martra.2021.100040. URLhttps://www.sc iencedirect.com/science/article/pii/S2666822X21000319
-
[12]
Yude Fu, Xiang Li, Jichao Li, Mengjun Yu, Xiongyi Lu, Qizi Huangpeng, and Xiaojun Duan. Multi-scale higher-order dependencies (MSHOD): Higher-order interactions mining and key nodes identification for global liner shipping network.Journal of Marine Science and Engineering, 12(8):1305, 2024. ISSN 2077-1312. doi: 10.3390/jmse12081305. URL https://www.mdpi.c...
-
[13]
Tra- jectory prediction for ocean vessels base on k-order multivariate markov chain
Shuai Guo, Chao Liu, Zhongwen Guo, Yuan Feng, Feng Hong, and Haiguang Huang. Tra- jectory prediction for ocean vessels base on k-order multivariate markov chain. In Sriram Chellappan, Wei Cheng, and Wei Li, editors,Wireless Algorithms, Systems, and Applications, pages 140–150, Cham, 2018. Springer International Publishing. ISBN 978-3-319-94268-1. doi: 10....
-
[14]
Summer Guo, Haoqing Wang, and Shuaian Wang. Network disruptions and ripple effects: Queueing model, simulation, and data analysis of port congestion.Journal of Marine Science and Engineering, 11(9):1745, 2023. ISSN 2077-1312. doi: 10.3390/jmse11091745. URL https://www.mdpi.com/2077-1312/11/9/1745
-
[15]
Henesey, T
L. Henesey, T. Notteboom, and P. Davidsson. Agent-based simulation of stakeholders re- lations: An approach to sustainable port and terminal management. InProceedings of the International Association of Maritime Economists (IAME) Annual Conference, pages 314– 331, Busan, South Korea, 2003
2003
-
[16]
Liling Huang, Yong Tan, and Xu Guan. Hub-and-spoke network design for container shipping considering disruption and congestion in the post COVID-19 era.Ocean & Coastal Manage- ment, 225:106230, 2022. ISSN 0964-5691. doi: 10.1016/j.ocecoaman.2022.106230. URL https://www.sciencedirect.com/science/article/pii/S096456912200206X. 32
-
[17]
Modelling the global maritime container network.Maritime Economics & Logistics, 20(3):400–420, 2018
Yanni Huang, Taha Hossein Rashidi, and Lauren Gardner. Modelling the global maritime container network.Maritime Economics & Logistics, 20(3):400–420, 2018. ISSN 1479-294X. doi: 10.1057/s41278-016-0047-3. URLhttps://doi.org/10.1057/s41278-016-0047-3
-
[18]
Number 244 in ADB Briefs
Kijin Kim, Sanchita Basu Das, Madhavi Pundit, Paolo Magnata, Mahinthan Mariasingham, and Cherryl Chico.Economic Applicability of the Automatic Identification System Data: Use Cases and the Way Forward. Number 244 in ADB Briefs. Asian Development Bank,
-
[19]
ISBN 978-92-9270-071-3 978-92-9270-072-0. doi: 10.22617/BRF230082-2. URL https://www.adb.org/publications/economic-applicability-automatic-identific ation-system-data
-
[20]
Multiscale core-periphery structure in a global liner shipping network.Scientific Reports, 9(1):404, 2019
Sadamori Kojaku, Mengqiao Xu, Haoxiang Xia, and Naoki Masuda. Multiscale core-periphery structure in a global liner shipping network.Scientific Reports, 9(1):404, 2019. ISSN 2045-
2019
-
[21]
URLhttps://www.nature.com/articles/s41598 -018-35922-2
doi: 10.1038/s41598-018-35922-2. URLhttps://www.nature.com/articles/s41598 -018-35922-2
-
[22]
Network effects govern the evolution of maritime trade
Zuzanna Kosowska-Stamirowska. Network effects govern the evolution of maritime trade. Proceedings of the National Academy of Sciences of the United States of America, 117(23): 12719–12728, 2020. ISSN 1091-6490. doi: 10.1073/pnas.1906670117
-
[23]
Timothy LaRock, Mengqiao Xu, and Tina Eliassi-Rad. A path-based approach to analyzing the global liner shipping network.EPJ Data Science, 11(1):18, 2022. doi: 10.1140/epjds/s1 3688-022-00331-z. URLhttps://epjdatascience.springeropen.com/articles/10.1140 /epjds/s13688-022-00331-z
-
[24]
Scalable in-database machine learn- ing for the prediction of port-to-port routes.Journal f¨ ur Mobilit¨ at und Verkehr, (6):2–10,
Dennis Marten, Carsten Hilgenfeld, and Andreas Heuer. Scalable in-database machine learn- ing for the prediction of port-to-port routes.Journal f¨ ur Mobilit¨ at und Verkehr, (6):2–10,
-
[25]
doi: 10.34647/jmv.nr6.id42
-
[26]
PhD thesis, Universit¨ at Paderborn, 2018
Daniel M¨ uller.Decision support for liner shipping network decisions. PhD thesis, Universit¨ at Paderborn, 2018. URLhttps://digital.ub.uni-paderborn.de/hs/content/titleinfo /2964246
2018
-
[27]
Stephen Craig Pirrong. Contracting practices in bulk shipping markets: A transactions cost explanation.The Journal of Law and Economics, 36(2):937–976, 1993. ISSN 0022-2186. doi: 10.1086/467303. URLhttps://www.journals.uchicago.edu/doi/abs/10.1086/467303
-
[28]
Shen Qu, Yunlei She, Qi Zhou, Jasper Verschuur, Lu-Tao Zhao, Huan Liu, Ming Xu, and Yi-Ming Wei. Modeling the dynamic impacts of maritime network blockage on global supply chains.The Innovation, 5(4):100653, 2024. ISSN 2666-6758. doi: 10.1016/j.xinn.2024.100653. URLhttps://www.cell.com/the-innovation/abstract/S2666-6758(24)00091-2
-
[29]
Container world: GLOBAL agent- based modelling of the container transport business
Proshun Sinha-Ray, Jonathan Carter, Tony Field, James Marshall, John Polak, Kimberly Schumacher, Dongping Song, John Woods, and Jie Zhang. Container world: GLOBAL agent- based modelling of the container transport business. InProceedings of the 4th Workshop of Agent-Based Simulation, Montpellier, France, 2003
2003
-
[30]
Jon Mangatas Budiarto Sirait, Gunawan Gunawan, and Allessandro Setyo Anggito Utomo. Selection of the best ship route for container shipping optimization models using heuristic algorithms.Kapal: Jurnal Ilmu Pengetahuan dan Teknologi Kelautan, 20(2):224–237, 2023. ISSN 2301-9069, 1829-8370. doi: 10.14710/kapal.v20i2.51642. URLhttps://ejournal.und ip.ac.id/i...
-
[31]
Modeling maritime transportation behavior using AIS trajectories and markovian processes in the gulf of st
Gabriel Spadon, Ruixin Song, Vaishnav Vaidheeswaran, Md Mahbub Alam, Floris Goerlandt, and Ronald Pelot. Modeling maritime transportation behavior using AIS trajectories and markovian processes in the gulf of st. lawrence, 2025. URLhttps://arxiv.org/abs/2506 .00025. 33
2025
-
[32]
L´ or´ ant Tavasszy, Michiel Minderhoud, Jean-Fran¸ cois Perrin, and Theo Notteboom. A strate- gic network choice model for global container flows: specification, estimation and appli- cation.Journal of Transport Geography, 19(6):1163–1172, 2011. ISSN 0966-6923. doi: 10.1016/j.jtrangeo.2011.05.005. URLhttps://www.sciencedirect.com/science/ar ticle/pii/S09...
-
[33]
Kevin Teo, Naomi Arnold, Andrew Hone, Michael Coulon, Martin Ireland, Mauricio Santil- lana, and Istv´ an Zolt´ an Kiss. Unveiling individual and collective temporal patterns in the tanker shipping network.Nature Communications, 17:3300, 2026. doi: 10.1038/s41467-026 -70013-1. URLhttps://www.nature.com/articles/s41467-026-70013-1
-
[34]
Kevin Tierney, Jan Fabian Ehmke, Ann Melissa Campbell, and Daniel M¨ uller. Liner shipping single service design problem with arrival time service levels.Flexible Services and Manufac- turing Journal, 31(3):620–652, 2019. ISSN 1936-6582, 1936-6590. doi: 10.1007/s10696-018-9 325-y. URLhttp://link.springer.com/10.1007/s10696-018-9325-y
-
[35]
J. Verschuur, E. E. Koks, and J. W. Hall. Ports’ criticality in international trade and global supply-chains.Nature Communications, 13(1):4351, 2022. ISSN 2041-1723. doi: 10.1038/s4 1467-022-32070-0. URLhttps://www.nature.com/articles/s41467-022-32070-0
work page doi:10.1038/s4 2022
-
[36]
Koks, and Jim W
Jasper Verschuur, Elco E. Koks, and Jim W. Hall. Global economic impacts of COVID-19 lockdown measures stand out in high-frequency shipping data.PLOS ONE, 16(4):e0248818,
-
[37]
URLhttps://journals.plos.org/plosone/ar ticle?id=10.1371/journal.pone.0248818
doi: 10.1371/journal.pone.0248818. URLhttps://journals.plos.org/plosone/ar ticle?id=10.1371/journal.pone.0248818
-
[38]
Jasper Verschuur, Johannes Lumma, and Jim W. Hall. Systemic impacts of disruptions at maritime chokepoints.Nature Communications, 16:10421, 2025. doi: 10.1038/s41467-025-6 5403-w. URLhttps://www.nature.com/articles/s41467-025-65403-w
-
[39]
Tao Wen, Qiuya Gao, Yu-wang Chen, and Kang Hao Cheong. Exploring the vulnerability of transportation networks by entropy: A case study of asia–europe maritime transportation network.Reliability Engineering & System Safety, 226:108578, 2022. ISSN 0951-8320. doi: 10.1016/j.ress.2022.108578. URLhttps://www.sciencedirect.com/science/article/pi i/S0951832022002228
-
[40]
Nautical traffic simulation with multi-agent system for safety
Fangliang Xiao, Han Ligteringen, Coen van Gulijk, and Ben Ale. Nautical traffic simulation with multi-agent system for safety. In2013 16th International IEEE Conference on Intelligent Transportation Systems (ITSC), pages 1245–1252, The Hague, Netherlands, 2013. doi: 10.110 9/ITSC.2013.6728402. URLhttps://ieeexplore.ieee.org/abstract/document/6728402. 6–9 ...
arXiv 2013
discussion (0)
Sign in with ORCID, Apple, or X to comment. Anyone can read and Pith papers without signing in.