REVIEW 4 major objections 6 minor 37 references
Traffic Sign Detection under Challenging Conditions: A Deeper Look Into Performance Variations and Spectral Characteristics
T0 review · 4 major / 6 minor · reviewed 2026-08-14 · deepseek-v4-flash
Pith's one-line read A new traffic sign dataset applies each of twelve real-world challenges at five controlled severity levels and shows that the mean magnitude spectrum of the resulting distortions tracks detector failure.
desk verdict A genuinely useful controlled robustness dataset, but the spectral 'indicator' claim is confounded by hand-set challenge levels and needs a baseline before it can be taken seriously. read the letter →
The pith
A machine-rendered reading of the paper's core claim, the machinery that carries it, and where it could break.
The reading
What carries the argument
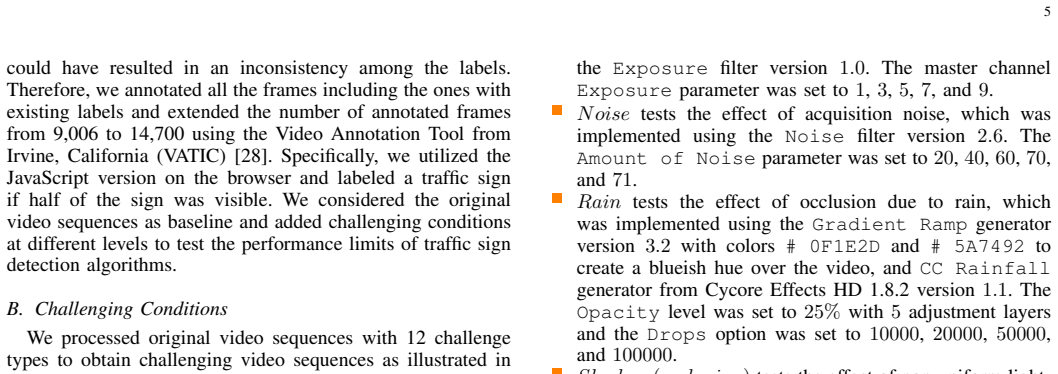
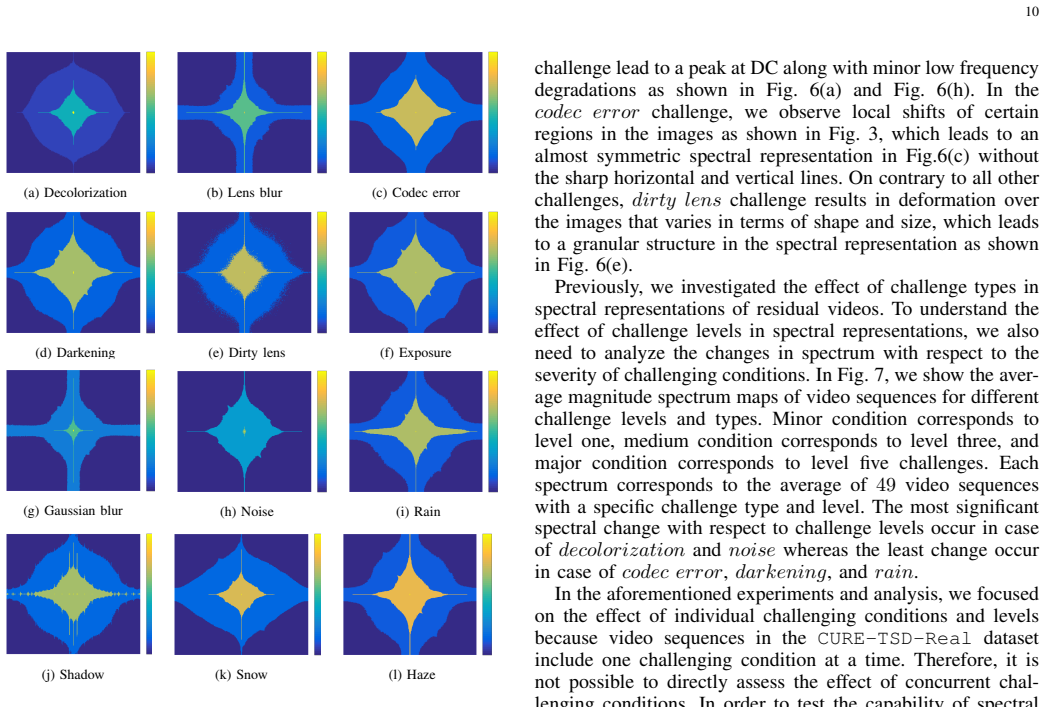
The load-bearing object is the residual magnitude spectrum: the transform $\log\left|\mathcal{F}\{|R|\}\right|$, where $R$ is the difference between a challenge-free frame and the corresponding challenging frame, $\mathcal{F}$ is the 2-D discrete Fourier transform, and the logarithm compresses the dynamic range. Differencing away the clean scene removes most scene context, so the remaining spectrum is dominated by the signature of the challenge itself. These spectra are averaged per challenge type and level to form magnitude spectrum maps, and the mean of each map is the predictor correlated with precision, recall, F0.5, and F2. The distinctive shapes—horizontal bands for rain and shadow, concentrated low-frequency energy for snow and blur, granular spread for dirty lens—show that the spectra are not just noise but structured descriptions of the degradation.
What would settle it
Generate a new set of degraded videos in which severity is set by an independent numeric parameter, such as Gaussian blur sigma or additive noise variance, and then measure detector recall and mean magnitude spectrum at each value; if the Spearman correlation does not survive this independent variation, the reported spectral indicator is an artifact of the fixed level ordering.
Extended reading notes
Core claim
The central discovery is that a simple spectral statistic of distorted video carries information about detection failure. For each degraded sequence, the paper forms a residual by taking the pixel-wise and frame-wise difference from its challenge-free reference, then computes the logarithm of the magnitude of the 2-D discrete Fourier transform of each residual frame. Averaging these spectra over the 49 reference videos for a given challenge type and level produces maps that are visually distinct for most of the twelve conditions. The mean intensity of these maps rises as challenge level increases while precision and recall fall. Across challenge categories, the Spearman rank correlation between mean magnitude spectrum and detection performance is 0.643 for precision, 0.848 for recall, 0.657 for F0.5, and 0.810 for F2. On the paper's terms, this establishes mean magnitude spectrum as an indicator of detection performance under challenging conditions.
Load-bearing premise
The five levels of each challenge are assumed to form a meaningful ordered severity scale, because they were set by visual inspection, and both the measured performance drop and the spectral magnitude move along that same hand-chosen ordering.
Editorial extensions
If this is right
- A fixed camera capturing the same region in different weather or lighting could estimate detector performance loss from spectral residuals, without needing ground-truth detections from a second pass.
- Challenge types have spectral fingerprints, so frequency-domain inspection can tell which degradation category is present, although exposure and darkening produce nearly identical maps.
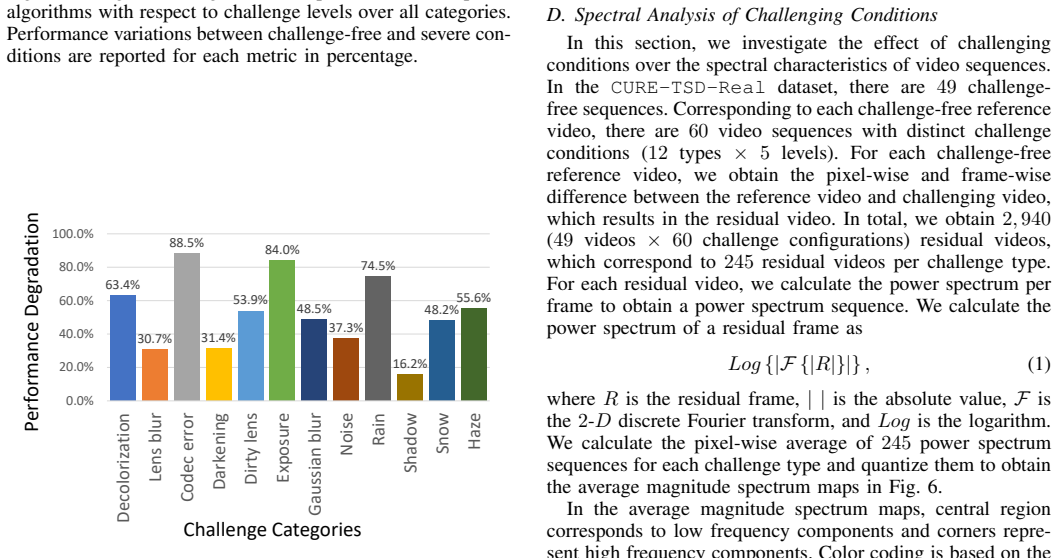
- Codec error and exposure cause the largest degradation (over 80% on average), while shadow causes the least (about 16%), pointing to where robustness engineering should focus.
- Algorithmic sensitivity differs sharply by challenge: one benchmark lost all detections under decolorization while the other lost under 10%, so the dataset exposes architectural dependencies on color information.
- The correlation between spectral magnitude and recall (0.848) is higher than for precision (0.643), suggesting that spectral residuals forecast missed detections more reliably than false alarms.
Reading between the lines
- A weighted pooling over frequency bands, tuned to the frequency sensitivities of detection networks, could improve on the direct mean pooling used in the paper; the reported correlations are likely a lower bound for a carefully chosen significance map.
- Because the five severity levels were selected by visual inspection, testing whether the spectral-performance correlation persists under an independent numerical severity scale (for example, blur sigma or noise variance) would separate the spectral indicator from the ordering built into the dataset design.
- The one-condition-at-a-time design leaves concurrent challenges unexplored; a factorial combination of two or three conditions could test whether the dominant-condition spectral behavior observed for rain plus exposure holds for other pairs.
- A no-reference extension—estimating spectral distortion without a clean reference—would be required before the indicator could be deployed from a moving vehicle, and the paper's fixed-camera analysis is the natural first validation point for such an estimator.
Signed reviews
Editorial analysis
A structured set of objections, weighed in public.
Referee Report
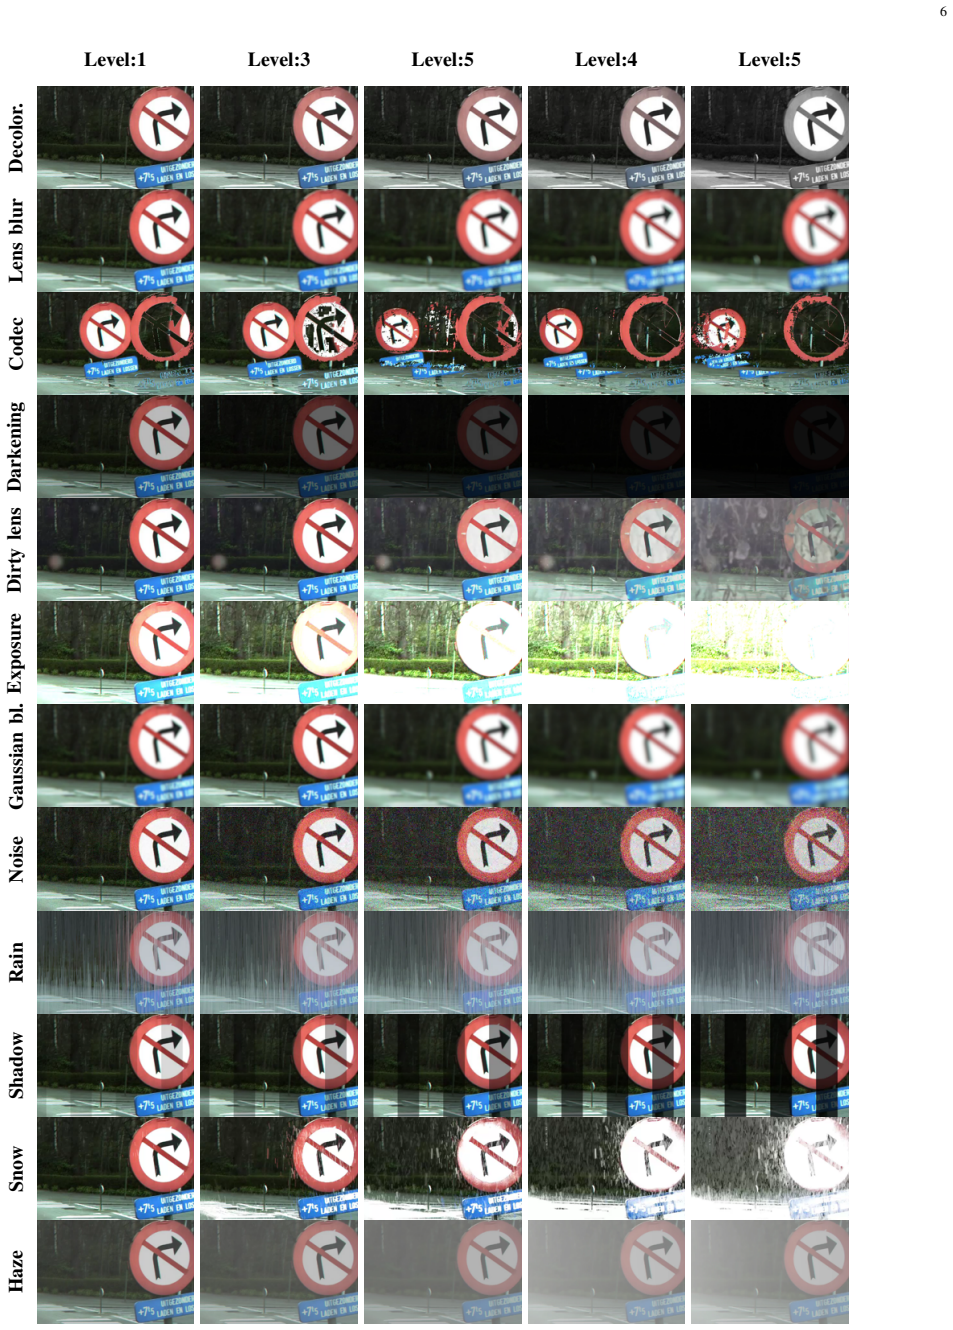
Summary. The paper introduces CURE-TSD-Real, a traffic sign detection benchmark built from BelgiumTS video sequences with twelve simulated challenging condition types (decolorization, blur, codec error, darkening, dirty lens, exposure, noise, rain, shadow, snow, haze) at five severity levels, together with 896,700 annotated frames. The authors evaluate two deep-learning benchmark algorithms from the IEEE VIP Cup, report precision/recall/F-score degradations under each challenge type and level, and analyze the magnitude spectra of residual videos (challenged minus reference). They further claim that the mean magnitude spectrum of residuals can serve as an indicator of detection performance, reporting Spearman correlations between 0.643 and 0.848. The dataset is released publicly, and the synthesis parameters are described in detail.
Significance. If the dataset is as described, it is a valuable resource for controlled, single-factor robustness evaluation of traffic sign detectors: it provides explicit metadata for challenge type and level, something most existing datasets lack, and the simulation parameters are specified to allow reproducibility. The spectral analysis is a potentially useful step toward no-reference performance estimation. The paper is transparent about the evaluation protocol, including IoU threshold and train/test splits, and it carefully documents the two benchmark algorithms. However, the central spectral-indicator claim is currently not established: the reported correlations are computed over only six ordinal levels whose ordering was set by visual inspection, and no statistical tests, baselines, or per-challenge-type results are provided.
major comments (4)
- [IV-E and III-B] The claim that mean magnitude spectrum can indicate detection performance (abstract, Section IV-E) is confounded by the experimental design. Section III-B states that challenge levels were "adjusted through visual inspection rather than numerical progression," and the levels form an ordinal severity ranking. Both detection performance and the mean magnitude spectrum of the residual videos are monotone functions of this same hand-constructed ordinal variable, so the reported Spearman correlations (0.643, 0.848, 0.657, 0.810) may largely reflect the chosen level ordering rather than an independent spectral indicator. The paper should report per-challenge-type correlations, include significance tests, and compare against baseline predictors such as the level index itself, the mean absolute residual, or the mean squared residual. If the spectral measure does not outperform these baselines, the claim should be weakened.
- [Table IV and Section IV-E] The statistical support for the spectral-indicator claim is insufficient. Each Spearman correlation is computed over only six ordinal points (levels 0-5) per challenge type and then averaged over types, but the paper reports only the averaged coefficients, not the per-category values or their range. With N=6, Spearman coefficients of 0.643 and 0.657 are below typical critical values for significance, so the averages may be driven by a few challenge types. The paper should provide per-category scatter plots or tables, confidence intervals or permutation tests, and a clear statement of how many of the twelve per-type correlations are significant.
- [Abstract, Section IV-C, Fig. 4, and Table III] There is an inconsistency in the reported degradation numbers. The abstract states that "severe conditions can result in an average performance degradation of 29% in precision and 68% in recall," but Section IV-C and Fig. 4, which report the comparison between challenge-free and severe (level 5) conditions, give 20% precision and 65% recall degradation. The 29%/68% figures appear to correspond to the average over all challenge levels from Table III. Please clarify which quantity is reported in each location and use consistent terminology for "severe" versus "average over levels."
- [Section IV-C and Table III] The external validity of the degradation analysis is limited by the very low absolute baseline performance of the two benchmark detectors, particularly top-II with a reference recall of 0.07 and the average top-I-II recall of 0.18. Percentage degradation relative to such low baselines can be misleading (e.g., decolorization causes 100% precision degradation for top-I but only 4% change for top-II). The paper should report absolute performance alongside relative degradation and discuss the implications of these low baselines for the generality of the robustness conclusions.
minor comments (6)
- [Conclusion] The text contains typos: "Spearmen" should be "Spearman" and "perfomance" should be "performance."
- [Section IV-A] In the description of IoU, "diving" should be "dividing."
- [Section III-B] The phrase "Hexagan Iris Shape" appears to be a typo; it should likely read "Hexagonal Iris Shape."
- [Table III] The formatting of the degradation rows is inconsistent: in many rows the downward-arrow symbol is missing for the top-II columns (e.g., "4 ↓ 10 ↓ 6 ↓ 10" should be "4↓ 10↓ 6↓ 10↓"), which makes the table harder to parse.
- [Section IV-E] The paper should define explicitly how the "mean magnitude spectrum" is computed: is it the average of the spectrum over all spatial frequencies, or the average over pixels of the spectrum map after frame-level averaging? This is central to interpreting Fig. 9 and Table IV.
- [Fig. 9] The scatter plot in Fig. 9 would be more informative if the twelve challenge types were distinguished (e.g., by color or marker), since the aggregated plot hides the large variation across categories.
Circularity Check
No significant circularity: spectral indicator is independently computed, not fitted to detector outputs, and self-citations are contextual rather than load-bearing.
full rationale
The paper's central contributions are the CURE-TSD-Real dataset, benchmark performance measurements, and a spectral analysis of residual videos. The benchmark results come from externally submitted VIP Cup algorithms; no parameter is fitted to the detection-performance data. The mean magnitude spectrum is computed from the pixel-wise and frame-wise difference between reference and challenged videos per Eq. (1), independently of the detector outputs, so the spectral indicator is not a renamed fit or a prediction forced by construction. The only notable methodological weakness is that challenge levels were 'adjusted ... through visual inspection rather than numerical progression' (Section III-B), which means both spectral magnitude and detection performance are monotone functions of the same hand-ordered severity level. That is a confound or correctness risk for the Spearman correlations in Table IV, but it is not a circular reduction: the spectral statistic is not defined in terms of detection performance, nor is any claim imported solely from a self-citation chain. Self-citations are contextual background and are not load-bearing for the main derivation. Accordingly, no circular step meets the required evidentiary standard.
Assumptions & free parameters
free parameters (1)
- Challenge severity parameters per type =
None (hand-set; see Section III-B)
assumptions (6)
- domain assumption Simulated challenges (After Effects filters) are representative of real-world degradations
- domain assumption The two VIP Cup benchmark algorithms are indicative of traffic sign detector performance
- domain assumption Residual power spectrum isolates challenge effects from scene context
- domain assumption Mean magnitude spectrum is a valid monotonic severity quantifier
- domain assumption Image annotation rule (label a sign if half visible) is consistent
- standard math 2D discrete Fourier transform and Spearman rank correlation provide valid standard tools
Cite this review
Pith. "Pith review of Traffic Sign Detection under Challenging Conditions: A Deeper Look Into Performance Variations and Spectral Characteristics." pith.science (2026). https://pith.science/paper/HES5JW23
@misc{pith2026190811262,
  author       = {Pith},
  title        = {Pith review of: Traffic Sign Detection under Challenging Conditions: A Deeper Look Into Performance Variations and Spectral Characteristics},
  year         = {2026},
  howpublished = {\url{https://pith.science/paper/HES5JW23}},
  note         = {Machine review of arXiv:1908.11262}
}
read the original abstract
Traffic signs are critical for maintaining the safety and efficiency of our roads. Therefore, we need to carefully assess the capabilities and limitations of automated traffic sign detection systems. Existing traffic sign datasets are limited in terms of type and severity of challenging conditions. Metadata corresponding to these conditions are unavailable and it is not possible to investigate the effect of a single factor because of simultaneous changes in numerous conditions. To overcome the shortcomings in existing datasets, we introduced the CURE-TSD-Real dataset, which is based on simulated challenging conditions that correspond to adversaries that can occur in real-world environments and systems. We test the performance of two benchmark algorithms and show that severe conditions can result in an average performance degradation of 29% in precision and 68% in recall. We investigate the effect of challenging conditions through spectral analysis and show that challenging conditions can lead to distinct magnitude spectrum characteristics. Moreover, we show that mean magnitude spectrum of changes in video sequences under challenging conditions can be an indicator of detection performance. CURE-TSD-Real dataset is available online at https://github.com/olivesgatech/CURE-TSD.
Figures


Figures from the paper (7 more)



Reference graph
Works this paper leans on
-
[1]
Distance sets for shape filters and shape recognition,
C. Grigorescu and N. Petkov, “Distance sets for shape filters and shape recognition,” IEEE Trans. Im. Proc. , vol. 12, no. 10, pp. 1274–1286, Oct 2003
work page 2003
-
[2]
Multi- view traffic sign detection, recognition, and 3D localisa- tion,
R. Timofte, K. Zimmermann, and L. V . Gool, “Multi- view traffic sign detection, recognition, and 3D localisa- tion,” in Works. Applic. Comp. Vis. , Dec 2009, pp. 1–8
work page 2009
-
[3]
Multi- view traffic sign detection, recognition, and 3D localisa- tion,
R. Timofte, K. Zimmermann, and L. Van Gool, “Multi- view traffic sign detection, recognition, and 3D localisa- tion,” Mach. Vis. Applic. , vol. 25, no. 3, pp. 633–647, 2014
work page 2014
-
[4]
Road sign detection in images: A case study,
R. Belaroussi, P. Foucher, J. P. Tarel, B. Soheilian, P. Charbonnier, and N. Paparoditis, “Road sign detection in images: A case study,” in Int. Conf. on Patt. Recog. , Aug 2010, pp. 484–488
work page 2010
-
[5]
Using fourier descriptors and spatial models for traffic sign recognition,
F. Larsson and M. ‘ Felsberg, “Using fourier descriptors and spatial models for traffic sign recognition,” in Scand. Conf. Im. Analy., Berlin, Heidelberg, 2011, SCIA’11, pp. 238–249, Springer-Verlag
work page 2011
-
[6]
The German Traffic Sign Recognition Benchmark: A multi- class classification competition,
J. Stallkamp, M. Schlipsing, J. Salmen, and C. Igel, “The German Traffic Sign Recognition Benchmark: A multi- class classification competition,” in Int. Joi. Conf. Neur. Netw., July 2011, pp. 1453–1460
work page 2011
-
[7]
Man versus computer: Benchmarking machine learning algorithms for traffic sign recognition ,
J. Stallkamp, M. Schlipsing, J. Salmen, and C. Igel, “Man versus computer: Benchmarking machine learning algorithms for traffic sign recognition ,” Neur. Netw., vol. 32, pp. 323 – 332, 2012
work page 2012
-
[8]
Detection of traffic signs in real-world images: The German Traffic Sign Detection Benchmark,
S. Houben, J. Stallkamp, J. Salmen, M. Schlipsing, and C. Igel, “Detection of traffic signs in real-world images: The German Traffic Sign Detection Benchmark,” in Int. Joi. Conf. Neur. Netw., Aug 2013, pp. 1–8
work page 2013
Show all 37 references
-
[9]
Vision-based traffic sign detection and analysis for intel- ligent driver assistance systems: Perspectives and survey,
A. Mogelmose, M. M. Trivedi, and T. B. Moeslund, “Vision-based traffic sign detection and analysis for intel- ligent driver assistance systems: Perspectives and survey,” IEEE Trans. Intell. Transp. Syst., vol. 13, no. 4, pp. 1484– 1497, Dec 2012
2012
-
[10]
Traffic-sign detection and classification in the wild,
Z. Zhu, D. Liang, S. Zhang, X. Huang, B. Li, and S. Hu, “Traffic-sign detection and classification in the wild,” in IEEE Conf. Comp. Vis. Patt. Recog. , June 2016, pp. 2110–2118
2016
-
[11]
Towards real- time traffic sign detection and classification,
Y . Yang, H. Luo, H. Xu, and F. Wu, “Towards real- time traffic sign detection and classification,” IEEE Trans. Intell. Transp. Syst. , vol. 17, no. 7, pp. 2022–2031, July 2016. 13
2022
-
[12]
A real-time chinese traffic sign detection algorithm based on modified yolov2,
J. Zhang, M. Huang, X. Jin, and X. Li, “A real-time chinese traffic sign detection algorithm based on modified yolov2,” Algorithms, vol. 10, no. 4, 2017
2017
-
[13]
Knowledge-based recurrent attentive neural network for small object detection,
K. Yi, Z. Jian, S. Chen, Y . Yang, and N. Zheng, “Knowledge-based recurrent attentive neural network for small object detection,” in arXiv:1803.05263, 2018
2018 arXiv
-
[14]
CURE-TSR: Challenging unreal and real environments for traffic sign recognition,
D. Temel, G. Kwon, M. Prabhushankar, and G. AlRegib, “CURE-TSR: Challenging unreal and real environments for traffic sign recognition,” in Neur. Inform. Proces. Syst. MLITS Works., 2017
2017
-
[15]
Traffic signs in the wild: Highlights from the ieee video and image processing cup 2017 student competition [sp competitions],
D. Temel and G. AlRegib, “Traffic signs in the wild: Highlights from the ieee video and image processing cup 2017 student competition [sp competitions],” IEEE Sig. Proc. Mag., vol. 35, no. 2, pp. 154–161, 2018
2017
-
[16]
Challenging environments for traffic sign detection: Reliability assessment under inclement conditions,
D. Temel, T. Alshawi, M.-H. Chen, and G. AlRegib, “Challenging environments for traffic sign detection: Reliability assessment under inclement conditions,” in arXiv:1902.06857, 2019
1902 arXiv
-
[17]
Intriguing properties of neural networks,
C. Szegedy, W. Zaremba, I. Sutskever, J. Bruna, D. Erhan, I. Goodfellow, and R. Fergus, “Intriguing properties of neural networks,” in Int. Conf. on Learn. Rep. , 2014
2014
-
[18]
Explaining and harnessing adversarial examples,
I. Goodfellow, J. Shlens, and C. Szegedy, “Explaining and harnessing adversarial examples,” in Int. Conf. on Learn. Rep., 2015
2015
-
[19]
No need to worry about adversarial examples in object detection in autonomous vehicles,
J. Lu, H. Sibai, E. Fabry, and D. Forsyth, “No need to worry about adversarial examples in object detection in autonomous vehicles,” in IEEE Conf. Comp. Vis. Patt. Recog, Spot. Oral Works. , 2017
2017
-
[20]
Keeping the bad guys out: Protecting and vaccinating deep learning with jpeg compression,
N. Das, M. Shanbhogue, S.-T. Chen, F. Hohman, L. Chen, M. E. Kounavis, and D. H. Chau, “Keeping the bad guys out: Protecting and vaccinating deep learning with jpeg compression,” in arXiv:1705.02900, 2017
2017 arXiv
-
[21]
Traffic sign recognition using a multi-task convolutional neural network,
H. Luo, Y . Yang, B. Tong, F. Wu, and B. Fan, “Traffic sign recognition using a multi-task convolutional neural network,” IEEE Trans. Intell. Transp. Syst. , vol. PP, no. 99, pp. 1–12, 2017
2017
-
[22]
CURE-OR: Challeng- ing unreal and real environments for object recognition,
D. Temel, J. Lee, and G. AlRegib, “CURE-OR: Challeng- ing unreal and real environments for object recognition,” in IEEE Int. Conf. Mach. Learn. Appl. , Dec 2018, pp. 137–144
2018
-
[23]
Object recognition under multifarious conditions: A reliability analysis and a feature similarity-based performance estimation,
D. Temel, J. Lee, and G. AlRegib, “Object recognition under multifarious conditions: A reliability analysis and a feature similarity-based performance estimation,” in IEEE Int. Conf. Im. Proces. , Sept 2019
2019
-
[24]
Semantically interpretable and controllable filter sets,
M. Prabhushankar, G. Kwon, D. Temel, and G. AIRegib, “Semantically interpretable and controllable filter sets,” in IEEE Int. Conf. Im. Proces., Oct 2018, pp. 1053–1057
2018
-
[25]
Distorted representation space characterization through backpropagated gradients,
G. Kwon, M. Prabhushankar, D. Temel, and G. AlRegib, “Distorted representation space characterization through backpropagated gradients,” in IEEE Int. Conf. Im. Pro- ces., Sep. 2019, pp. 2651–2655
2019
-
[26]
Modelling the power spectra of natural images: Statistics and informa- tion,
A. Van der Schaaf and J.H. van Hateren, “Modelling the power spectra of natural images: Statistics and informa- tion,” Vis. Res., vol. 36, no. 17, pp. 2759 – 2770, 1996
1996
-
[27]
Statistics of natural image categories,
A. Torralba and A. Oliva, “Statistics of natural image categories,” Netw.: Comp.Neur. Syst., vol. 14, no. 3, pp. 391–412, 2003, PMID: 12938764
2003
-
[28]
Efficiently scaling up crowdsourced video annotation,
C. V ondrick, D. Patterson, and D. Ramanan, “Efficiently scaling up crowdsourced video annotation,” Int. Jour. Comp. Vis., pp. 1–21, 10.1007/s11263-012-0564-1
-
[29]
Definition of shadow,
Merriam-Webster, “Definition of shadow,” Merriam- Webster Online Dictionary , https://www.merriam- webster.com/dictionary/shadow
-
[30]
Bundled camera paths for video stabilization,
S. Liu, L. Yuan, P. Tan, and J. Sun, “Bundled camera paths for video stabilization,” ACM Trans. Graph. , vol. 32, no. 4, pp. 78:1–78:10, July 2013
2013
-
[31]
Steadyflow: Spatially smooth optical flow for video stabilization,
S. Liu, L. Yuan, P. Tan, and J. Sun, “Steadyflow: Spatially smooth optical flow for video stabilization,” in IEEE Conference on Computer Vision and Pattern Recognition (CVPR), June 2014
2014
-
[32]
Rolling- shutter-aware differential sfm and image rectification,
B. Zhuang, L. Cheong, and G. H. Lee, “Rolling- shutter-aware differential sfm and image rectification,” in International Conference on Computer Vision , Oct 2017, pp. 948–956
2017
-
[33]
U-net: Con- volutional networks for biomedical image segmentation,
O. Ronneberger, P. Fischer, and T. Brox, “U-net: Con- volutional networks for biomedical image segmentation,” in arXiv:1505.04597, 2015
2015 arXiv
-
[34]
Deep residual learning for image recognition,
K. He, X. Zhang, S. Ren, and J. Sun, “Deep residual learning for image recognition,” in arXiv:1512.03385, 2015
2015 arXiv
-
[35]
Very deep convolu- tional networks for large-scale image recognition,
K. Simonyan and A. Zisserman, “Very deep convolu- tional networks for large-scale image recognition,” in arXiv:1409.1556, 2014
2014 arXiv
-
[36]
Going deeper with convolutions,
C. Szegedy, W. Liu, Y . Jia, P. Sermanet, S. Reed, D. Anguelov, D. Erhan, V . Vanhoucke, and A. Ra- binovich, “Going deeper with convolutions,” in arXiv:1409.4842, 2014
2014 arXiv
-
[37]
The jpeg still picture compression standard,
G. K. Wallace, “The jpeg still picture compression standard,” IEEE Transactions on Consumer Electronics , vol. 38, no. 1, pp. xviii–xxxiv, Feb 1992. Dogancan Temel received his M.S. and Ph.D. de- grees in electrical and computer engineering (ECE) from the Georgia Institute of ...
2017
Reviewed August 14, 2026 · model on record in the stance chip above.
Discussion (0). Continue with ORCID to comment.