REVIEW 4 major objections 3 minor 13 references
Graph Embedding Using Infomax for ASD Classification and Brain Functional Difference Detection
T0 review · 4 major / 3 minor · reviewed 2026-08-14 · deepseek-v4-flash
Pith's one-line read Adding an unsupervised Infomax loss to a graph neural network improves ASD classification from fMRI and reveals separable brain-region representations between autism and healthy controls.
desk verdict A clearly written fMRI-GNN paper whose 'Infomax' regularizer turns out to be a supervised contrastive loss because negatives come from the opposite class, so the main classification gain and region-separability result are confounded. read the letter →
The pith
A machine-rendered reading of the paper's core claim, the machinery that carries it, and where it could break.
The reading
What carries the argument
The mechanism is a three-part pipeline: a GraphSAGE encoder with mean-pooling propagation maps each brain graph to node embeddings; DHP hierarchical pooling summarizes them into a graph-level readout; and a bilinear discriminator scores pairs of node embeddings and the summary, with a loss that maximizes mutual information between local and global representations. The training objective combines binary cross-entropy classification loss with the Infomax term, so node embeddings must serve both classification and representation quality. The Infomax term encourages nodes within the same graph to share common signals while pushing embeddings of negative graphs apart.
What would settle it
Re-run the (16,16) comparison with layer width and regularization chosen on a validation split (or pre-specified), then test on held-out subjects; if the classification-only model reaches the same F-score as the Infomax model, the claimed regularizing benefit collapses. Also, on an independent ASD dataset, check whether the same 31 regions remain separable with Silhouette score above 0.1.
Extended reading notes
Core claim
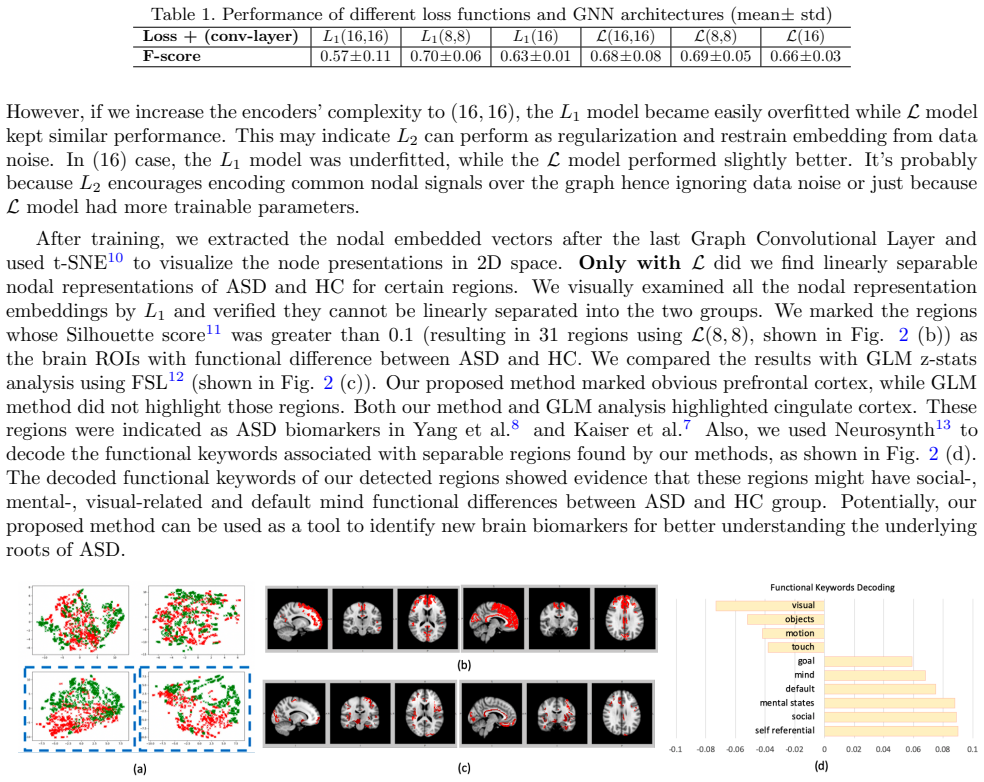
The central discovery claimed is that a graph embedding trained with an added Infomax loss regularizes the noisy fMRI representation and makes ASD and healthy-control differences visible at the node level. Specifically, the paper reports that the (16,16) GraphSAGE model with classification loss only gives an F-score of 0.57 and overfits, while the same architecture with the combined loss gives 0.68. The paper also finds that 31 brain regions, including prefrontal and cingulate cortex, have node embeddings with Silhouette score above 0.1, indicating linear separability of the two groups. These separable regions are presented as functional differences between ASD and HC that align with prior literature and could serve as new biomarkers.
Load-bearing premise
The central comparison assumes that the choice of layer width and regularization strength, described only as 'adjusted correspondingly to get the best performance,' was made without using the held-out test folds; if test performance guided those choices, the Infomax improvement is not a valid generalization result.
Editorial extensions
If this is right
- Adding the Infomax loss to a graph neural network can act as a regularizer, preventing overfitting when the encoder becomes deeper or wider.
- The learned node embeddings can be used to locate brain regions with functional differences between ASD and healthy controls without requiring region-level labels.
- The detected regions, such as prefrontal and cingulate cortex, align with existing ASD biomarker literature and may suggest new biomarkers when applied to other datasets.
- Training a graph embedding with a combined classification and mutual-information loss is a viable strategy for other noisy, high-dimensional graph classification problems.
Reading between the lines
- A testable extension is that the benefit of Infomax should grow with encoder capacity and data noise; comparing the (8,8) and (16,16) results already hints at this, and larger, noisier fMRI cohorts would put it to the test.
- The same pipeline could be applied to other neurodevelopmental or psychiatric conditions, with negative samples drawn from the opposite diagnostic group as the paper does.
- The biomarker-detection claim would be stronger if the 31 separable regions were compared against multiple established fMRI contrast maps rather than a single GLM baseline.
Signed reviews
Editorial analysis
A structured set of objections, weighed in public.
Referee Report
Summary. The manuscript proposes a graph neural network pipeline for classifying autism spectrum disorder (ASD) versus healthy controls (HC) from task-fMRI parcellated into 148 ROIs, and for detecting regional functional differences between the groups. The encoder is a supervised GraphSAGE network with dense hierarchical pooling; in addition to the classification cross-entropy L1, the model optimizes an Infomax term L2 that is intended to maximize mutual information between node embeddings and a graph summary. Experiments on 75 ASD and 43 HC children report F-scores for L1-only and joint L models under three architectures, and the authors identify 31 ROIs with Silhouette score above 0.1 as showing separable ASD/HC representations, comparing these with GLM z-statistics. The central claims are that adding Infomax improves classification as a regularizer and that the learned node embeddings reveal region-level ASD/HC functional differences.
Significance. If the claims held, the contribution would be a practical demonstration that a local-global mutual-information regularizer improves robustness of GNN-based ASD classification and yields a candidate biomarker-discovery tool from whole-brain fMRI graphs. The pipeline is modular and uses established components (GraphSAGE, differentiable pooling, Deep Graph Infomax), which is a strength for reproducibility of the architecture. The paper is also explicit about its negative-sampling choice, which makes the deviation from DGI auditable. However, the central comparison is currently confounded by label information in the negative sampling and by the absence of statistical testing, so the significance of the reported improvement is not yet established.
major comments (4)
- [Section 2.4 and Eq. (4)] The negative graph is sampled from the opposite class: the text states 'We randomly sample an instance from the opposite class as the negative sample (X', A').' With the loss written in Eq. (4), the discriminator is trained to push node embeddings of the opposite class away from the summary of the current class. This makes L2 a supervised contrastive term, not the unsupervised Infomax objective of Deep Graph Infomax (Ref. 3), where negatives are produced by a corruption function on the same graph. Consequently, Table 1's comparison between L and L1 models conflates the effect of the MI regularizer with an additional supervised signal derived from class labels. This is load-bearing for the paper's first central claim.
- [Section 2.5, Eq. (4)] As printed, the negative-sample term is E[1 - log D(h'_i, s)], rather than E[log(1 - D(h'_i, s))]. Maximizing 1 - log D does not correspond to the standard binary cross-entropy or MINE objective and can even encourage D to increase for negative pairs. If this is a typographical error, it must be corrected; as written, Eq. (4) is not a valid MI loss.
- [Section 3.2, Table 1] No significance testing is reported, and the claimed benefit of L2 rests on a single architecture: for (8,8), L(8,8) with F-score 0.69±0.05 is not better than L1(8,8) with 0.70±0.06, and for (16), the difference is 0.66 vs 0.63 with overlapping standard deviations. The text also states that 'regularization parameters are adjusted correspondingly to get the best performance' without specifying whether this tuning was done on the held-out folds. If it was, the F-score improvement is not a valid generalization result. A paired test across folds and a nested or pre-registered validation procedure are needed to support the claim that Infomax improves classification.
- [Section 3.2, region-level analysis] The region-level detection is circular and threshold-based. The embeddings used for t-SNE and Silhouette analysis are produced by a model whose objective explicitly separates the two classes at the node level; therefore, observing group separability in these embeddings does not independently confirm functional differences. Additionally, the threshold Silhouette > 0.1 and the visual selection of t-SNE panels are arbitrary, and no multiple-comparison correction is applied over 148 ROIs. The comparison with GLM is qualitative. The region-level claim therefore needs either a held-out embedding protocol or an independent statistical test.
minor comments (3)
- [Section 3.1] The graph augmentation is described only as 'described in our previous work'; the authors should state the augmentation factor and explain how augmented graphs were split (by subject or by graph) to avoid data leakage between training and test folds.
- [Figure 2] The t-SNE panels in Fig. 2(a) do not include axis labels or scales, and because t-SNE distances are not quantitatively meaningful, the visual impression alone is not sufficient evidence of separability; please clarify how the four displayed regions were selected from the 148 ROIs.
- [Section 2.1] The notation V = (v_1, ..., v_N)^T in R^{N x D} conflates the vertex set with the node attribute matrix; using X for the attribute matrix would make the encoder input in Eq. (1) consistent with the text.
Circularity Check
Opposite-class negative sampling makes the 'Infomax' term a supervised contrastive loss, so the classification gain and separable-region detection are in part built from the labels.
-
self definitional
[Sec. 2.4, Eq. (4); Sec. 3.2 (Table 1 and Silhouette analysis)]
"Sec. 2.4: 'We randomly sample an instance from the opposite class as the negative sample (X′, A′).' Eq. (4): L = L1 + 1/2N(Σ E(X,A)[log D(h_i,s)] + E(X′,A′)[1 − log D(h′_i,s)]). Sec. 3.2: 'Only with L did we find linearly separable nodal representations of ASD and HC for certain regions.'"
The 'Infomax' term L2 is defined by sampling negatives from the opposite class, so it is a supervised contrastive objective rather than the unsupervised DGI objective cited as Ref. [3]. The paper then attributes the Table 1 F-score gain (0.57±0.11 vs 0.68±0.08) and the node-separability finding to 'Infomax graph embedding' as an unsupervised regularizer. By construction, however, L2 already injects the class labels into the representation: it trains the discriminator to push opposite-class node embeddings away from the graph summary and pull same-class embeddings together. The later Silhouette-based identification of separable ROIs is therefore in part reading back the optimization target, not an independent functional-difference discovery.
full rationale
The only significant circularity is the construction of L2. Section 2.4 states that negatives are sampled from the opposite class, and Eq. (4) defines L2 as a discriminator over those pairs. This makes the claimed 'unsupervised Infomax' term label-dependent, so the L-vs-L1 comparison in Table 1 cannot isolate unsupervised MI regularization; it is partly a supervised contrastive effect. The node embeddings used for the Silhouette-based 'functional difference' detection were trained with this same label-dependent loss, so reporting separable regions is, in part, reporting the training objective back. The paper is otherwise self-contained: the encoder, GraphSAGE, DHP, and DGI are external methods, the classification loss is standard cross-entropy, and the GLM/Neurosynth comparisons are external validations. No load-bearing self-citation chain is present; Ref. [1] is used for data augmentation but is not the source of the central claim. The hyperparameter-selection ambiguity in Sec. 3.2 is a correctness risk rather than circularity. Because not every ROI becomes separable, the Silhouette result retains some empirical content, and the reported F-scores are measured rather than derived, so the circularity is partial rather than total.
Assumptions & free parameters
free parameters (5)
- GNN architecture and hidden width F =
(8,8), (16,16), or (16) compared
- Pooling ratio r =
0.5
- Silhouette score threshold =
0.1
- Regularization parameters of the loss =
not reported
- Graph augmentation factor =
75 ASD to 750 graphs, 43 HC to 860 graphs
assumptions (3)
- domain assumption ROI parcellation plus correlation-based adjacency captures ASD-relevant functional organization.
- domain assumption Graph augmentation in [1] produces valid samples without distorting subject-level generalization.
- ad hoc to paper t-SNE projections and Silhouette scores are valid detectors of true group differences in embedding space.
Cite this review
Pith. "Pith review of Graph Embedding Using Infomax for ASD Classification and Brain Functional Difference Detection." pith.science (2026). https://pith.science/paper/HHDWCA4S
@misc{pith2026190804769,
  author       = {Pith},
  title        = {Pith review of: Graph Embedding Using Infomax for ASD Classification and Brain Functional Difference Detection},
  year         = {2026},
  howpublished = {\url{https://pith.science/paper/HHDWCA4S}},
  note         = {Machine review of arXiv:1908.04769}
}
read the original abstract
Significant progress has been made using fMRI to characterize the brain changes that occur in ASD, a complex neuro-developmental disorder. However, due to the high dimensionality and low signal-to-noise ratio of fMRI, embedding informative and robust brain regional fMRI representations for both graph-level classification and region-level functional difference detection tasks between ASD and healthy control (HC) groups is difficult. Here, we model the whole brain fMRI as a graph, which preserves geometrical and temporal information and use a Graph Neural Network (GNN) to learn from the graph-structured fMRI data. We investigate the potential of including mutual information (MI) loss (Infomax), which is an unsupervised term encouraging large MI of each nodal representation and its corresponding graph-level summarized representation to learn a better graph embedding. Specifically, this work developed a pipeline including a GNN encoder, a classifier and a discriminator, which forces the encoded nodal representations to both benefit classification and reveal the common nodal patterns in a graph. We simultaneously optimize graph-level classification loss and Infomax. We demonstrated that Infomax graph embedding improves classification performance as a regularization term. Furthermore, we found separable nodal representations of ASD and HC groups in prefrontal cortex, cingulate cortex, visual regions, and other social, emotional and execution related brain regions. In contrast with GNN with classification loss only, the proposed pipeline can facilitate training more robust ASD classification models. Moreover, the separable nodal representations can detect the functional differences between the two groups and contribute to revealing new ASD biomarkers.
Figures

Reference graph
Works this paper leans on
-
[1]
Graph neural network for interpreting task-fmri biomarkers,
Li, X. et al., “Graph neural network for interpreting task-fmri biomarkers,” MICCAI (2019). 4
work page 2019
-
[2]
Mine: mutual information neural estimation,
Belghazi, M. I. et al., “Mine: mutual information neural estimation,” ICML (2018)
work page 2018
- [3]
-
[4]
Inductive representation learning on large graphs,
Hamilton, W. L., Ying, R., and Leskovec, J., “Inductive representation learning on large graphs,” in [ NIPS], (2017)
work page 2017
-
[5]
Hierarchical graph representation learning with differentiable pooling,
Ying, Z. et al., “Hierarchical graph representation learning with differentiable pooling,” in [ NeurIPS], 4805– 4815 (2018)
work page 2018
-
[6]
Learning deep representations by mutual information estimation and maximization,
Hjelm, R. D. et al., “Learning deep representations by mutual information estimation and maximization,” arXiv preprint arXiv:1808.06670 (2018)
arXiv 2018
-
[7]
Kaiser, M. D. et al., “Neural signatures of autism,” PNAS (2010)
work page 2010
-
[8]
Brain responses to biological motion predict treatment outcome in young children with autism,
Yang, D. et al., “Brain responses to biological motion predict treatment outcome in young children with autism,” Translational psychiatry 6(11), e948 (2016)
work page 2016
Show all 13 references
-
[9]
Automatic parcellation of human cortical gyri and sulci using standard anatomical nomenclature,
Destrieux, C. et al., “Automatic parcellation of human cortical gyri and sulci using standard anatomical nomenclature,” Neuroimage 53(1), 1–15 (2010)
2010
-
[10]
Visualizing data using t-sne,
Maaten, L. v. d. and Hinton, G., “Visualizing data using t-sne,” Journal of machine learning re- search 9(Nov), 2579–2605 (2008)
2008
-
[11]
Silhouettes: a graphical aid to the interpretation and validation of cluster analysis,
Rousseeuw, P. J., “Silhouettes: a graphical aid to the interpretation and validation of cluster analysis,” Journal of computational and applied mathematics 20, 53–65 (1987)
1987
-
[12]
et al., “FSL,” NeuroImage (2012)
Jenkinson, M. et al., “FSL,” NeuroImage (2012)
2012
-
[13]
Large-scale automated synthesis of human functional neuroimaging data,
Yarkoni, T. et al., “Large-scale automated synthesis of human functional neuroimaging data,” Nature meth- ods 8(8), 665 (2011). 5
2011
Reviewed August 14, 2026 · model on record in the stance chip above.
Discussion (0). Continue with ORCID to comment.