REVIEW 3 major objections 6 minor 28 references
Adding inter-cluster distance to the k-means objective produces more accurate clusters and better outlier placement.
Reviewed by Pith at T0; open to challenge. T0 means a machine referee read the full paper against a public rubric. the ladder, T0–T4 →
T0 review · deepseek-v4-flash
2026-08-03 20:52 UTC pith:IJORGWUA
load-bearing objection The paper's central mechanism is missing—Algorithm 1 never uses the inter-cluster distance in updates—so the reported gains are unsupported. the 3 major comments →
A novel k-means clustering approach using two distance measures for Gaussian data
The pith
A machine-rendered reading of the paper's core claim, the machinery that carries it, and where it could break.
Core claim
The central claim is that including both within-cluster distance (WCD) and inter-cluster distance (ICD) in the k-means objective produces better clusters than the traditional within-cluster-only objective. WCD is defined as the sum, over clusters, of squared Euclidean distances from each point to its cluster center; ICD is the summed distance between points in different clusters. The algorithm first determines k using a cluster-validity index, initializes centers, then loops through assignment and centroid-recomputation while aiming to optimize the relative cost C_j/D — the ratio of within-cluster cost to inter-cluster distance. On the paper's evidence, this ratio makes the algorithm more ac
What carries the argument
The load-bearing object is the relative cost C_j/D: the ratio of the within-cluster squared distance summed over clusters (C_j) to the inter-cluster distance (D), which sums distances between points in different clusters. The paper's Algorithm 1 wraps this ratio around the usual k-means loop — assign each point to the nearest center, recompute each center as the mean of its cluster — and reports that optimizing this ratio is what improves convergence, outlier assignment, and stability to initial centers. A cluster-validity index fixes k before the loop runs.
Load-bearing premise
The load-bearing premise is that the pseudocode step 'Optimize relative cost, C_j/D' actually changes how points are assigned to clusters or how centroids move; the paper does not give the equation linking ICD to the assignment or update, and if that step is a no-op, the reported accuracy gains cannot be attributed to including inter-cluster distance.
What would settle it
Instrument Algorithm 1 at the 'Optimize relative cost' step: log cluster assignments and centroids before and after evaluating C_j/D, then rerun the same code with the ICD term (D) artificially held constant. If assignments and centroids are identical in both runs, the ICD term is not doing any work and the reported gains come from elsewhere; if they differ, the two-distance mechanism is real.
If this is right
- A simple change to the k-means objective — adding an inter-cluster separation term — can yield higher clustering accuracy without adding user-tuned hyperparameters.
- Outlier points near cluster boundaries, which classic k-means tends to misassign, are placed into their true cluster more often when between-cluster separation is part of the objective.
- The method's accuracy fluctuates less across random initial centroid placements, so it partially addresses k-means' well-known initialization sensitivity.
- The improvement persists on overlapping, higher-variance data, indicating the method is not limited to well-separated clusters.
Where Pith is reading between the lines
- Editorial inference: Since the paper never writes an explicit assignment or update equation for the ICD term, a fair test of the mechanism would be to vary D in the 'Optimize relative cost' step and check whether cluster assignments change; without such a check, the reported gains could be an artifact of implementation details rather than the two-distance objective.
- Editorial inference: The average-over-100-runs design with identical initial centers for both methods means part of the reported advantage may reflect reduced variance across restarts rather than a direct ICD effect; an ablation that fixes the assignment rule exactly would isolate the cause.
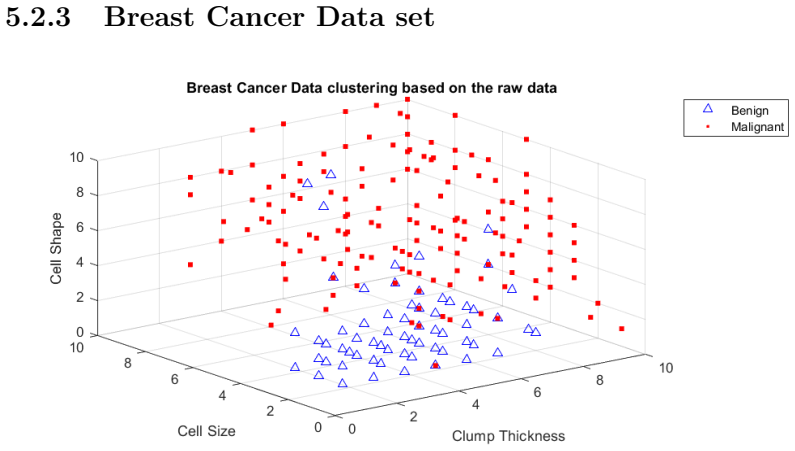
- Editorial inference: High-dimensional results show only a small gain on the breast-cancer set, so the method's advantage may shrink as dimensionality grows; testing on a range of dimensionalities would map where the ratio helps.
- Editorial inference: A natural next step is to derive a joint assignment rule — assign each point to the cluster that minimizes the ratio C_j/D — and compare it against stronger initialization baselines to see whether ICD still helps once initialization is controlled.
Editorial analysis
A structured set of objections, weighed in public.
Referee Report
Summary. The paper proposes a k-means variant that, in addition to within-cluster distance (WCD), uses inter-cluster distance (ICD) to form clusters. The algorithm selects k via the Calinski-Harabasz criterion, initializes centroids randomly, and claims to optimize a relative cost C_j/D. Experiments on four synthetic Gaussian datasets and three UCI benchmarks report modest improvements in accuracy, recall, precision, and F1 over traditional k-means, plus better visual outlier handling. The central contribution is the joint use of WCD and ICD.
Significance. If substantiated, explicitly maximizing inter-cluster separation within k-means is a reasonable direction and could be a small incremental contribution. The paper sensibly reports standard metrics and uses shared initialization for comparison. However, the manuscript provides no concrete optimization step through which ICD affects cluster assignment or centroid updates; the described procedure is standard k-means. Consequently, the reported improvements are not attributable to the proposed method. The evaluation also lacks error bars and uses a binary confusion matrix for multiclass problems. As it stands, the central claim is unsupported.
major comments (3)
- [Section 3.2/3.3, Algorithm 1] The pseudocode step 'Optimize relative cost, C_j/D' (Algorithm 1, line 7) is never operationalized. Section 3.1 describes only nearest-centroid assignment and mean recomputation, which minimize the within-cluster sum of squares (sum of C_j), not the ratio sum C_j / D. No equation in Sections 3.2 or 3.3 shows how D enters the assignment rule or the centroid update. As written, the algorithm is identical to vanilla k-means, so the accuracy differences in Tables 5.1–5.7 cannot be attributed to ICD. The authors must specify the exact objective and the update rules that use D, and ideally prove or demonstrate that the relative-cost objective is decreased by those updates.
- [Section 5, Tables 5.1–5.7] The paper states (e.g., p. 15) that both methods use the same initial centroid positions for each iteration. Under identical initialization and the identical updates described in Section 3.1, the two methods would produce identical clusterings; the reported differences imply either an undisclosed implementation difference or an evaluation artifact. Moreover, no standard deviations or significance tests accompany the averages over 100 iterations. On Breast Cancer the difference is only 0.3%, and Figure 5.17 shows the traditional method frequently scoring higher. The claim of consistent outperformance is therefore not established by the reported statistics.
- [Section 3.2, confusion matrix] The definitions of TP/FN/FP/TN and overall accuracy are for binary classification, but the experiments include three-class datasets (Iris, Wine) and the synthetic data have k=3. The paper does not explain how the 2x2 confusion matrix is extended to multiclass problems, nor how cluster labels are matched to ground-truth labels before accuracy is computed. Without this, the accuracy, recall, precision, and F1 numbers in all multiclass tables are not well-defined.
minor comments (6)
- [Section 3.1] The phrase 'the average of the sum of the within-cluster distance' is unclear; presumably the new centroid is the mean of the points in the cluster, not an average of a sum. Please rewrite.
- [Algorithm 1] The loop variables M and Z are not defined, and the two nested loops are both named 'iteration', which is confusing. The role of the inner loop relative to the outer loop is not explained.
- [Table 5.7] The table header contains a typo: 'Breast Caner data set' should be 'Breast Cancer data set'.
- [Section 5.2.1 and 5.2.2] Assertions about specific outlier points (e.g., near (2,2,0) in Iris, or around (0.6,0.5,2.5) in Wine) are based on visual inspection only. No quantitative measure of outlier-clustering performance is provided, so this claim remains anecdotal.
- [Section 4.1] The synthetic data generation via Kronecker product is described only verbally. The exact offsets, sample sizes, and how the Kronecker product is used are not specified, which hinders reproducibility.
- [References] Several references are incomplete or inconsistent, e.g., reference [5] lacks author names, and [23] is a Wikipedia citation. Please standardize the bibliography.
Circularity Check
No material circularity: the empirical claim is not definitionally loaded, but the ICD term is never wired into the algorithm (an omitted-proof/correctness issue), and the one self-citation is unrelated and non-load-bearing.
full rationale
The WCD/ICD definitions are independent of the benchmark labels, and the reported accuracy is computed from a confusion-matrix comparison against external labels, so no fitted parameter is relabeled as a prediction and no quantity is defined in terms of the result it is supposed to support. The only self-citation ([28], an aluminum-specifications paper) appears in a literature list about initialization methods and is not load-bearing. The most serious defect is not circular: Algorithm 1's 'Optimize relative cost, C_j/D' (line 7) is never connected to the nearest-centroid assignment or the centroid update; Section 3.1 and Algorithm 1 (lines 8-11) describe only standard k-means mean updates. If the implementation matches the pseudocode, the method is vanilla k-means and the reported differences are unexplained. That is an omitted proof/empirical validity problem, not a definitional reduction: the conclusion is not assumed in the premises, it is simply not derived. Accordingly, no circularity step is reported and the score reflects only a minor non-load-bearing self-citation.
Axiom & Free-Parameter Ledger
free parameters (1)
- Number of clusters k =
3 for synthetic/Iris/Wine; 2 for Breast Cancer
axioms (4)
- standard math Standard k-means mean-update converges and minimizes within-cluster sum of squares
- ad hoc to paper The relative cost C_j/D is optimized by nearest-centroid assignment plus mean recomputation
- domain assumption Calinski-Harabasz index recovers the true number of clusters for these datasets
- domain assumption Ground-truth label accuracy is the appropriate measure of clustering quality
read the original abstract
Clustering algorithms have long been the topic of research, representing the more popular side of unsupervised learning. Since clustering analysis is one of the best ways to find some clarity and structure within raw data, this paper explores a novel approach to k-means clustering. Here we present a k-means clustering algorithm that takes both the within cluster distance (WCD) and the inter cluster distance (ICD) as the distance metric to cluster the data into k clusters pre-determined by the Calinski-Harabasz criterion in order to provide a more robust output for the clustering analysis. The idea with this approach is that by including both the measurement metrics, the convergence of the data into their clusters becomes solidified and more robust. We run the algorithm with some synthetically produced data and also some benchmark data sets obtained from the UCI repository. The results show that the convergence of the data into their respective clusters is more accurate by using both WCD and ICD measurement metrics. The algorithm is also better at clustering the outliers into their true clusters as opposed to the traditional k means method. We also address some interesting possible research topics that reveal themselves as we answer the questions we initially set out to address.
Figures




Reference graph
Works this paper leans on
-
[1]
Supervised Learning
Bing Liu. “Supervised Learning”. In:Web data mining. Springer, 2011, pp. 63– 132
2011
-
[2]
Prentice- Hall, Inc., 1988
Anil K Jain and Richard C Dubes.Algorithms for Clustering Data. Prentice- Hall, Inc., 1988
1988
-
[3]
Unsupervised Learn- ing
Peter Dayan, Maneesh Sahani, and Gr´ egoire Deback. “Unsupervised Learn- ing”. In:The MIT encyclopedia of the cognitive sciences(1999), pp. 857–859
1999
-
[4]
Deep Reinforcement Learning: An Overview
Yuxi Li. “Deep Reinforcement Learning: An Overview”. In:arXiv preprint arXiv:1701.07274(2017)
Pith/arXiv arXiv 2017
-
[5]
An Improved Genetick-means Algorithm for Opti- mal Clustering
Hai-xiang Guo et al. “An Improved Genetick-means Algorithm for Opti- mal Clustering”. In:Sixth IEEE International Conference on Data Mining- Workshops (ICDMW’06). IEEE. 2006, pp. 793–797
2006
-
[6]
Algorithmic Complexity: Three NP-hard problems in Com- putational Statistics
William J Welch. “Algorithmic Complexity: Three NP-hard problems in Com- putational Statistics”. In:Journal of Statistical Computation and Simulation 15.1 (1982), pp. 17–25
1982
-
[7]
Using Metaheuristic Algorithms to Improvek-Means Clus- tering: A Comparative Study
Sasan Harifi et al. “Using Metaheuristic Algorithms to Improvek-Means Clus- tering: A Comparative Study”. In:Rev. d’Intelligence Artif.34.3 (2020), pp. 297– 305
2020
-
[8]
A Selection Process for Genetic Algorithm Using Clus- tering Analysis
Adam Chehouri et al. “A Selection Process for Genetic Algorithm Using Clus- tering Analysis”. In:Algorithms10.4 (2017), p. 123
2017
-
[9]
Genetick-means Clustering Algo- rithm for Mixed Numeric and Categorical Data Sets
Dharmendra K Roy and Lokesh K Sharma. “Genetick-means Clustering Algo- rithm for Mixed Numeric and Categorical Data Sets”. In:International Jour- nal of Artificial Intelligence & Applications1.2 (2010), pp. 23–28
2010
-
[10]
Genetic Algorithm based onk-means Clustering Tech- nique for Multi-Objective Resource Allocation Problems
Mai A Farag et al. “Genetic Algorithm based onk-means Clustering Tech- nique for Multi-Objective Resource Allocation Problems”. In:British Journal of Applied Science & Technology8.1 (2015), pp. 80–96
2015
-
[11]
Survey of Clustering Algorithms
Rui Xu and Donald Wunsch II. “Survey of Clustering Algorithms”. In:IEEE Transactions on Neural Networks16.3 (May 2005), pp. 645–678.doi: 10.1109/ TNN.2005.845141
arXiv 2005
-
[12]
Trevor Hastie et al.The Elements of Statistical Learning: Data Mining, Infer- ence, and Prediction. Vol. 2. Springer, 2009
2009
-
[13]
Data Mining in Education
Cristobal Romero and Sebastian Ventura. “Data Mining in Education”. In: Wiley Interdisciplinary Reviews: Data Mining and Knowledge Discovery3.1 (2013), pp. 12–27
2013
-
[14]
Unsupervisedk-means Clustering Algorithm
Kristina P Sinaga and Miin-Shen Yang. “Unsupervisedk-means Clustering Algorithm”. In:IEEE access8 (2020), pp. 80716–80727. 34
2020
-
[15]
A Survey of Kernel and Spectral Methods for Clus- tering
Maurizio Filippone et al. “A Survey of Kernel and Spectral Methods for Clus- tering”. In:Journal of the Pattern Recognition Society41.1 (2008), pp. 176– 190
2008
-
[16]
An Efficientk-Means Clustering Algorithm: Analysis and Implementation
Tapas Kaungo et al. “An Efficientk-Means Clustering Algorithm: Analysis and Implementation”. In:IEEE Transactions on Pattern Analysis and Machine In- telligence24.7 (July 2002), pp. 881–892.doi: 10.1109/TPAMI.2002.1017616
Pith/arXiv arXiv 2002
-
[17]
The Globalk-means Clustering Algorithm
Aristidis Likas, Nikos Vlassis, and Jakob J Verbeek. “The Globalk-means Clustering Algorithm”. In:Journal of The Pattern Recognition Society36.2 (2003), pp. 451–461
2003
-
[18]
Selection ofkink- means clustering
Duc Truong Pham, Stefan S Dimov, and Chi D Nguyen. “Selection ofkink- means clustering”. In:Proceedings of the Institution of Mechanical Engineers, Part C: Journal of Mechanical Engineering Science219.1 (2005), pp. 103–119
2005
-
[19]
A Comparative Study of Efficient Initialization Methods for thek-means Clustering Algo- rithm
M Emre Celebi, Hassan A Kingravi, and Patricio A Vela. “A Comparative Study of Efficient Initialization Methods for thek-means Clustering Algo- rithm”. In:Expert Systems with Applications40.1 (2013), pp. 200–210
2013
-
[20]
An Empirical Comparison of Four Initialization Methods for Thek-means Algorithm
Jos´ e M Pena, Jose Antonio Lozano, and Pedro Larranaga. “An Empirical Comparison of Four Initialization Methods for Thek-means Algorithm”. In: Pattern Recognition Letters20.10 (1999), pp. 1027–1040
1999
-
[21]
K-means with Three dif- ferent Distance Metrics
Archana Singh, Avantika Yadav, and Ajay Rana. “K-means with Three dif- ferent Distance Metrics”. In:International Journal of Computer Applications 67.10 (2013)
2013
-
[22]
Inter Cluster Distance Man- agement Model with Optimal Centroid Estimation fork-means Clustering Al- gorithm
M Vijayakumar, S Prakash, and RMS Parvathi. “Inter Cluster Distance Man- agement Model with Optimal Centroid Estimation fork-means Clustering Al- gorithm”. In:WSEAS transactions on communications10.6 (2011), pp. 182– 191
2011
-
[23]
[Online; accessed 13-June-2022]
Wikipedia contributors.Kronecker Product - Wikipedia, The Free Encyclope- dia. [Online; accessed 13-June-2022]. 2022.url: https://en.wikipedia.org/w/ index.php?title=Kronecker product&oldid=1068887742
2022
-
[24]
2017.url: http://archive.ics.uci.edu/ml
Dheeru Dua and Casey Graff.UCI Machine Learning Repository. 2017.url: http://archive.ics.uci.edu/ml
2017
-
[25]
Extensions ofk-means Type Algorithms: A New Clustering Framework by Integrating Intracluster Com- pactness and Intercluster Separation
Xiaohui Huang, Yunming Ye, and Haijun Zhang. “Extensions ofk-means Type Algorithms: A New Clustering Framework by Integrating Intracluster Com- pactness and Intercluster Separation”. In:IEEE transactions on neural net- works and learning systems25.8 (2013), pp. 1433–1446
2013
-
[26]
Cluster Center Initialization Algorithm fork-means Clustering
Shehroz S Khan and Amir Ahmad. “Cluster Center Initialization Algorithm fork-means Clustering”. In:Pattern recognition letters25.11 (2004), pp. 1293– 1302
2004
-
[27]
Two Improvedk-means Algorithms
Shyr-Shen Yu et al. “Two Improvedk-means Algorithms”. In:Applied Soft Computing68 (2018), pp. 747–755
2018
-
[28]
Exploring Property Based Aluminum Specifications
Naitik Gada and Gabrielle Gaustad. “Exploring Property Based Aluminum Specifications”. In:ICAA13 Pittsburgh. Ed. by Hasso Weiland, Anthony D. Rollett, and William A. Cassada. Cham: Springer International Publishing, 2016, pp. 1303–1308.isbn: 978-3-319-48761-8. 35
2016
discussion (0)
Sign in with ORCID, Apple, or X to comment. Anyone can read and Pith papers without signing in.