REVIEW 1 major objections 1 minor 32 references
Intercomparison of Machine Learning Algorithms for Remote Sensing-based In-season Crop Mapping
T0 review · 1 major / 1 minor · reviewed 2026-06-28 · grok-4.3
Pith's one-line read Support vector machines achieve the highest accuracy for mapping almonds and corn by early June using satellite time series and rotation history in unseen years.
desk verdict This paper delivers a practical year-holdout benchmark of ten algorithms for early-season crop mapping and finds SVM on top by mean F1, but the interannual swings make the overall ranking claim shaky without per-year breakdowns. read the letter →
The pith
A machine-rendered reading of the paper's core claim, the machinery that carries it, and where it could break.
The reading
What carries the argument
Year-wise cross-validation of ten machine learning algorithms with hyperparameter tuning on combined satellite reflectance time series and crop rotation history inputs.
What would settle it
Demonstrating that a different algorithm or additional inputs consistently produce higher F1 scores than 0.74 for almonds and 0.59 for corn when tested on multiple new years would falsify the superiority of support vector machines with these inputs.
Extended reading notes
Core claim
Harmonized Landsat-Sentinel surface reflectance imagery time series combined with crop rotation history information can be used with support vector machines to map corn in Iowa and almonds in California at 30m resolution accurately by early June in unseen years, outperforming other algorithms across thousands of model configurations evaluated with year-wise cross-validation.
Load-bearing premise
That satellite imagery time series and crop rotation history provide enough information to produce accurate in-season crop maps in years not seen during training without additional data or specific adjustments.
Editorial extensions
If this is right
- Interannual variation is a large source of uncertainty in the maps.
- Ensemble approaches or additional ancillary data show potential to improve performance further.
- The methods can be extended to multiclass maps of all crop types and CONUS-wide application.
- In-season crop yield forecasting becomes feasible with these approaches.
Reading between the lines
- These mapping techniques could be adapted to other crops and regions facing similar climate risks.
- Integration with real-time climate data might enable proactive emergency responses.
- Quantifying uncertainty from phenology could help prioritize areas for ground verification.
Editorial analysis
A structured set of objections, weighed in public.
Referee Report
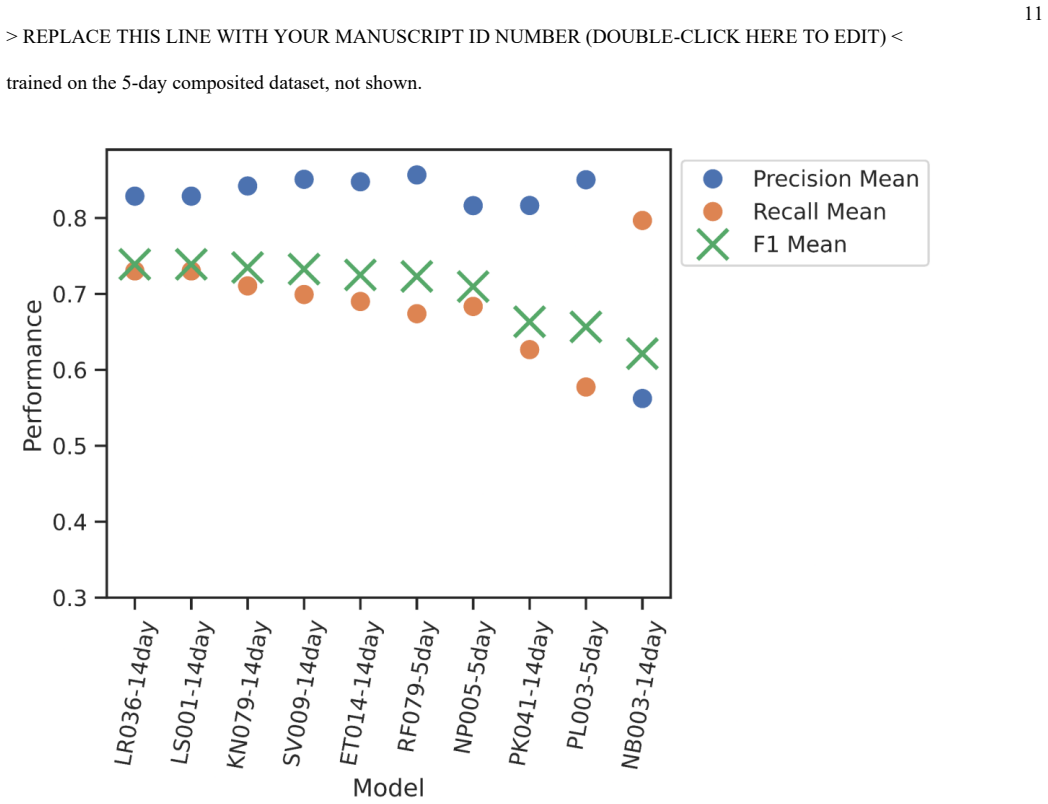
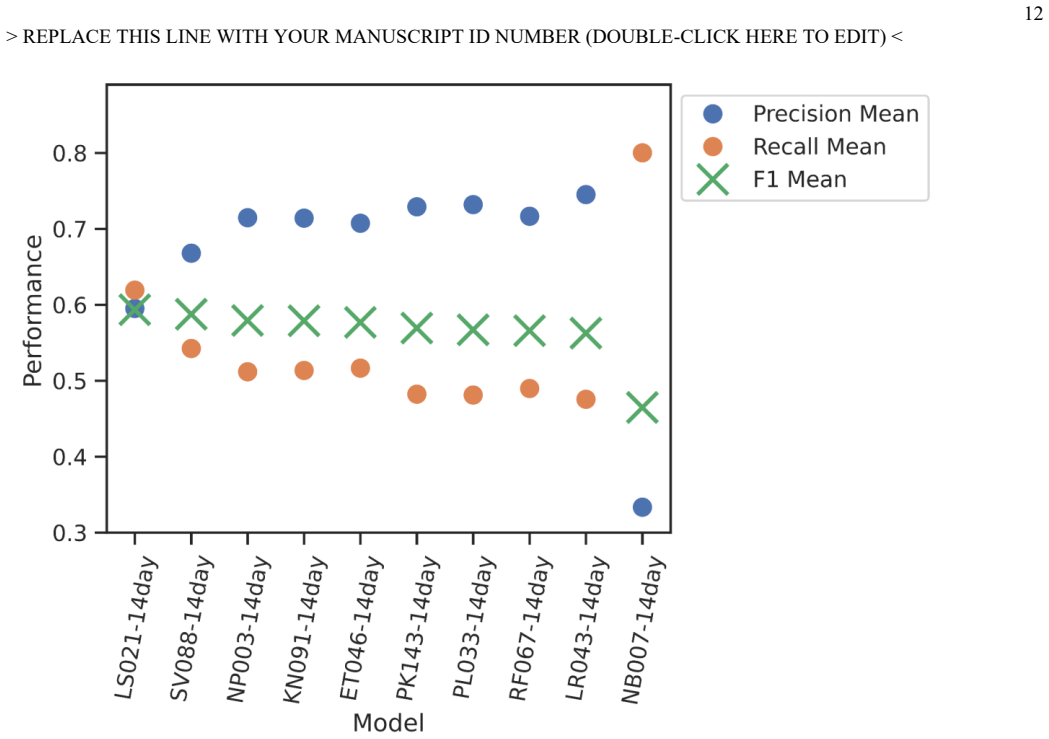
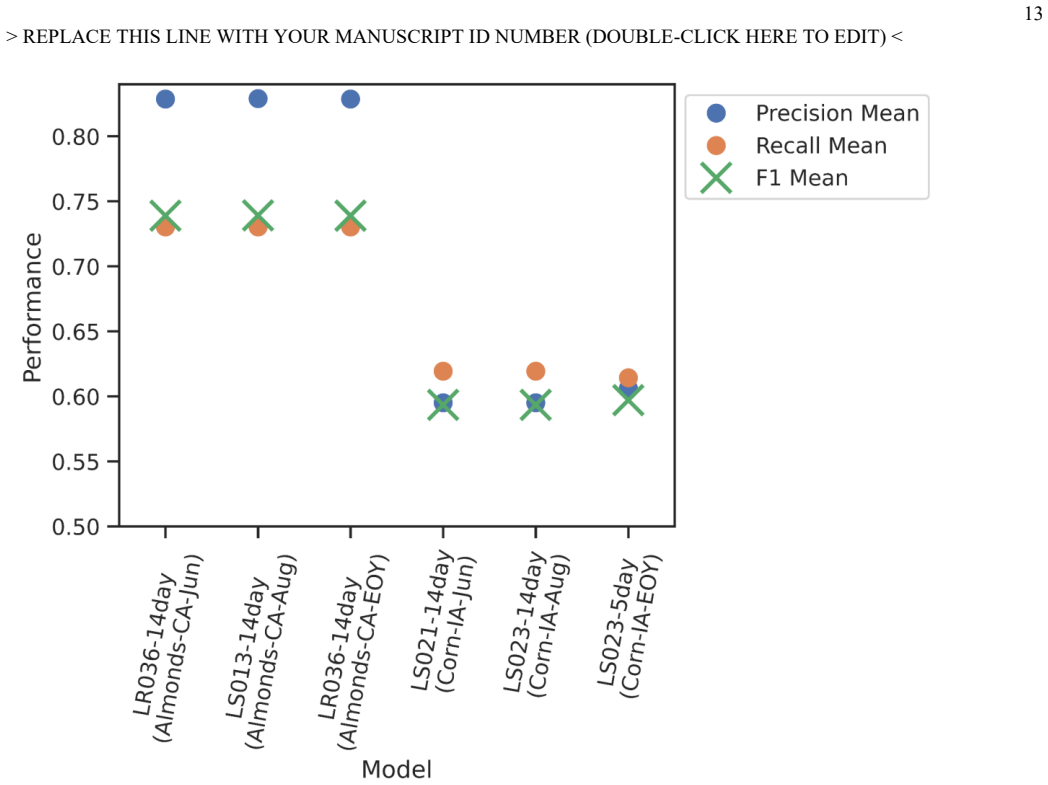
Summary. The manuscript intercompares ten machine learning algorithms for in-season 30 m crop mapping of almonds in California and corn in Iowa. It combines Harmonized Landsat-Sentinel surface reflectance time series with crop rotation history, performs year-wise cross-validation across five unseen years, and reports that Support Vector Machines achieve the highest mean F1 scores (0.74 for almonds, 0.59 for corn) by early June, while identifying interannual variation as a major uncertainty source and suggesting potential for ensembles or ancillary data.
Significance. If the per-year results and uncertainty quantification hold, the study supplies a practical benchmark for temporal generalization in remote-sensing crop classification, directly addressing the latency gap with the USDA Cropland Data Layer. The year-wise hold-out design is a clear methodological strength for assessing real-world applicability.
major comments (1)
- [Abstract] Abstract: the headline claim that SVM is 'the most successful algorithm overall' rests only on the highest mean F1 across five years; given the explicit statement that 'interannual variation was a large source of uncertainty,' the manuscript must show either (a) per-year rankings or (b) paired statistical tests confirming that SVM differences are significant and consistent, otherwise the aggregate mean does not support declaring one algorithm superior.
minor comments (1)
- The abstract refers to 'early June' without stating the precise day-of-year or phenological window used for each crop; this should be clarified for reproducibility.
Simulated Author's Rebuttal
We thank the referee for the constructive review. We address the single major comment below.
read point-by-point responses
-
Referee: [Abstract] Abstract: the headline claim that SVM is 'the most successful algorithm overall' rests only on the highest mean F1 across five years; given the explicit statement that 'interannual variation was a large source of uncertainty,' the manuscript must show either (a) per-year rankings or (b) paired statistical tests confirming that SVM differences are significant and consistent, otherwise the aggregate mean does not support declaring one algorithm superior.
Authors: We agree that the abstract phrasing overstates the result given the acknowledged interannual variation. The revised manuscript will change the abstract to state that SVMs achieved the highest mean F1 score rather than declaring them 'the most successful algorithm overall.' We will also add a table (or expanded supplementary table) listing per-year F1 scores for the top three algorithms across the five validation years so readers can directly evaluate consistency. This revision directly addresses the request for per-year rankings. revision: yes
Circularity Check
No circularity: empirical ML comparison with external year-holdout validation
full rationale
The paper conducts a standard empirical intercomparison of ten ML algorithms for crop mapping, using year-wise cross-validation on five unseen validation years. Hyperparameter search and model selection occur within training folds, with F1 scores and other metrics evaluated on held-out years that are never used for fitting. No equations, self-definitional steps, fitted-input predictions, or load-bearing self-citations appear in the methodology; the reported performance metrics are computed directly on independent test data and do not reduce to the training inputs by construction. This is a self-contained empirical study against external benchmarks.
Assumptions & free parameters
free parameters (1)
- Hyperparameters across ten algorithms
assumptions (1)
- domain assumption Year-wise cross-validation isolates interannual variability without leakage from spatial or temporal autocorrelation
Cite this review
Pith. "Pith review of Intercomparison of Machine Learning Algorithms for Remote Sensing-based In-season Crop Mapping." pith.science (2026). https://pith.science/paper/IMAHGRZH
@misc{pith2026260605731,
  author       = {Pith},
  title        = {Pith review of: Intercomparison of Machine Learning Algorithms for Remote Sensing-based In-season Crop Mapping},
  year         = {2026},
  howpublished = {\url{https://pith.science/paper/IMAHGRZH}},
  note         = {Machine review of arXiv:2606.05731}
}
read the original abstract
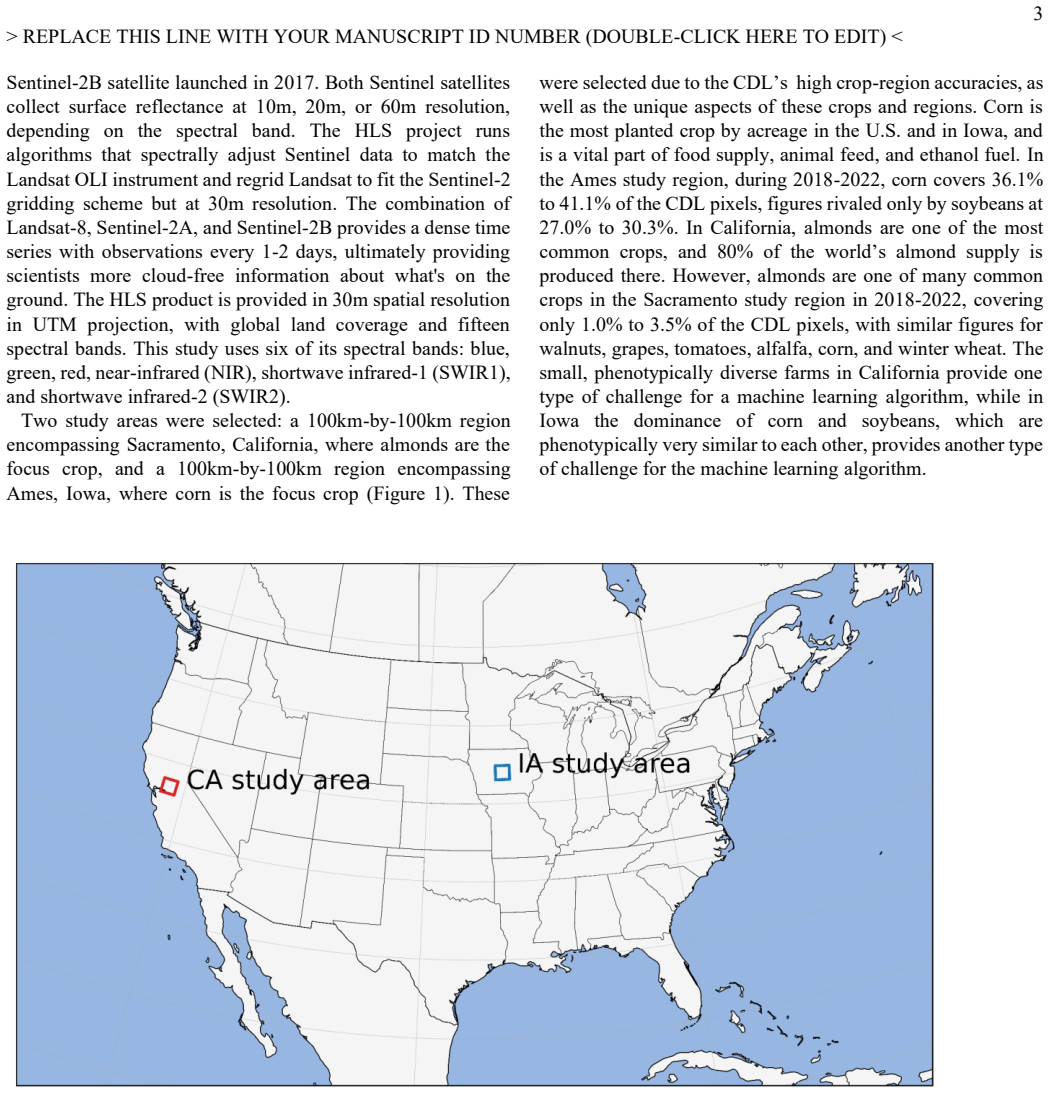
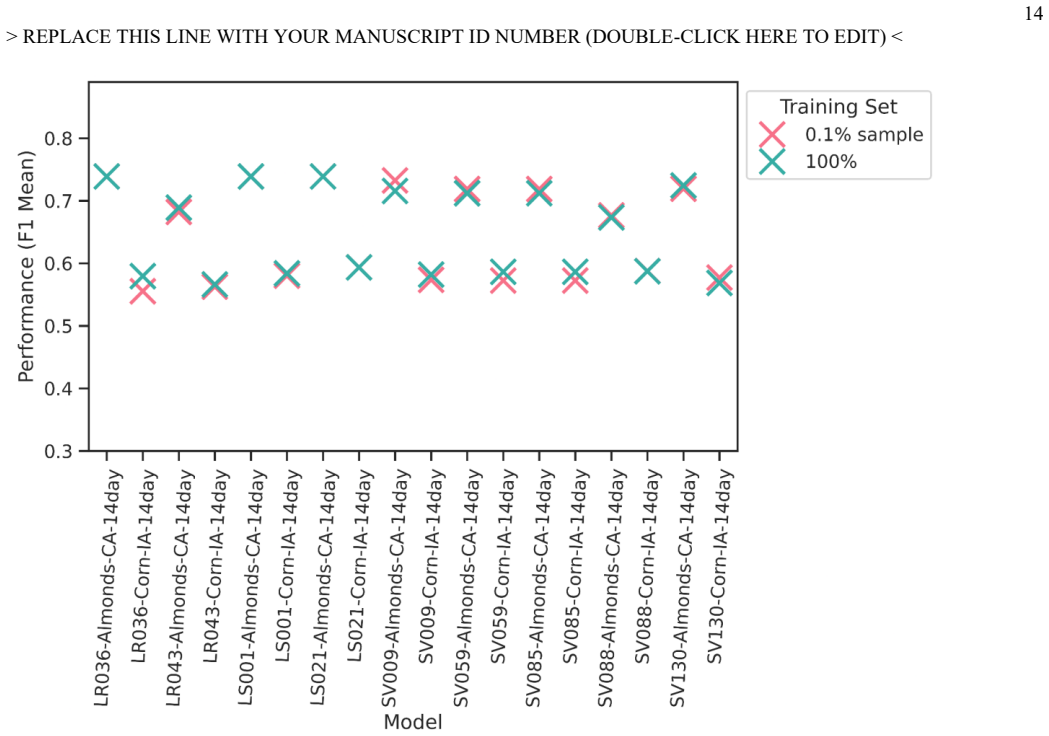
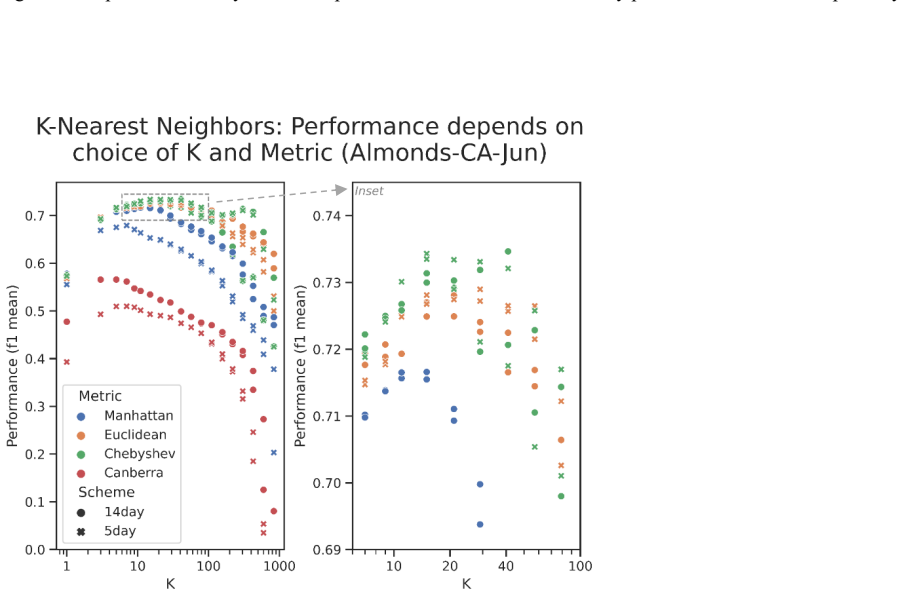
In-season crop type mapping is critical for food security in the face of increasingly extreme climate-related threats to crops. Currently, the USDA Cropland Data Layer provides crop type labels at 30m resolution and is available the February after harvest, but no product exists that maps crop types before harvest with satisfactory accuracy that would allow emergency managers to respond to crop threats in near real time. Furthermore, the relative advantages of a wide range of algorithms have not been evaluated in a way that accounts for interannual variability, until this study. Here, Harmonized Landsat-Sentinel surface reflectance imagery time series and crop rotation history information are combined to map corn in Iowa and almonds in California at 30m resolution accurately by early June in unseen years, with robust quantification of uncertainty due to phenology and crop distribution. Thousands of model configurations across ten machine learning algorithms were compared using a year-wise cross-validation and a suite of metrics. Hyperparameter search revealed Support Vector Machines to be the most successful algorithm overall, with a mean F1 score of 0.74 (0.59) across five unseen validation years for almonds by early June in California (corn by early June in Iowa). Interannual variation was a large source of uncertainty, but patterns showed the potential to further improve performance with ensemble approaches or ancillary data. Future work may extend these methods to include multiclass maps of all crop types, CONUS-wide maps, and in-season crop yield forecasting.
Figures
Figures from the paper (5 more)
Reference graph
Works this paper leans on
-
[1]
Enhancement of river flooding due to global warming,
H. Alifu, Y. Hirabayashi, Y. Imada et al., "Enhancement of river flooding due to global warming," Sci. Rep., vol. 12, Art. no. 20687, 2022, doi: 10.1038/s41598-022-25182-6
-
[2]
Climate- mediated shifts in temperature fluctuations promote extinction risk,
K. Duffy, T. C. Gouhier, and A. R. Ganguly, "Climate- mediated shifts in temperature fluctuations promote extinction risk," Nat. Clim. Change, vol. 12, pp. 1037- 1044, 2022, doi: 10.1038/s41558-022-01490-7
-
[3]
The impacts of climate change on river flood risk at the global scale,
N. W. Arnell and S. N. Gosling, "The impacts of climate change on river flood risk at the global scale," Clim. 21 > REPLACE THIS LINE WITH YOUR MANUSCRIPT ID NUMBER (DOUBLE -CLICK HERE TO EDIT) < Change, vol. 134, pp. 387-401, 2016, doi: 10.1007/s10584-014-1084-5
-
[4]
Climate change impacts on crop yields,
E. E. Rezaei, H. Webber, S. Asseng et al., "Climate change impacts on crop yields," Nat. Rev. Earth Environ., vol. 4, pp. 831-846, 2023, doi: 10.1038/s43017-023-00491-0
-
[5]
Monitoring US agriculture: the USDA- NASS Cropland Data Layer program,
C. Boryan et al., "Monitoring US agriculture: the USDA- NASS Cropland Data Layer program," Geocarto Int., vol. 26, no. 5, pp. 341-358, 2011, doi: 10.1080/10106049.2011.562309
-
[6]
Y. Cai, K. Guan, J. Peng et al., "A high-performance and in-season classification system of field-level crop types using time-series Landsat data and machine learning," Remote Sens. Environ., vol. 210, pp. 35-47, 2018, doi: 10.1016/j.rse.2018.02.045
-
[7]
L. Blickensdörfer, M. Schwieder, D. Pflugmacher et al., "Mapping of crop types and crop sequences with combined time series of Sentinel-1, Sentinel-2 and Landsat 8 data for Germany," Remote Sens. Environ., vol. 269, Art. no. 112831, 2022, doi: 10.1016/j.rse.2021.112831
-
[8]
Synergistic use of Sentinel-1 and Sentinel-2 images for in-season crop type classification,
S. Sharma, D. Ryu, S. K. C. et al., "Synergistic use of Sentinel-1 and Sentinel-2 images for in-season crop type classification," in Proc. IGARSS, 2023, pp. 3498-3501, doi: 10.1109/IGARSS52108.2023.10282334
Show all 32 references
-
[9]
Development of a 10-m resolution maize and soybean map over China,
H. Li et al., "Development of a 10-m resolution maize and soybean map over China," Remote Sens. Environ., vol. 294, Art. no. 113623, 2023, doi: 10.1016/j.rse.2023.113623
2023 doi
-
[10]
Rapid early-season maize mapping without crop labels,
N. You, J. Dong, J. Li et al., "Rapid early-season maize mapping without crop labels," Remote Sens. Environ., vol. 290, Art. no. 113496, 2023, doi: 10.1016/j.rse.2023.113496
2023 doi
-
[11]
Mapping crops within the growing season across the United States,
V. Konduri et al., "Mapping crops within the growing season across the United States," Remote Sens. Environ., vol. 251, Art. no. 112048, 2020, doi: 10.1016/j.rse.2020.112048
2020 doi
-
[12]
Mapcurves: A quantitative method for comparing categorical maps,
W. W. Hargrove, F. M. Hoffman, and P. F. Hessburg, "Mapcurves: A quantitative method for comparing categorical maps," J. Geographical Syst., vol. 8, no. 2, pp. 187-208, 2006, doi: 10.1007/s10109-006-0025-x
2006 doi
-
[13]
Pre- and within-season crop type classification trained with archival land-cover information,
D. Johnson and R. Mueller, "Pre- and within-season crop type classification trained with archival land-cover information," Remote Sens. Environ., vol. 264, Art. no. 112576, 2021, doi: 10.1016/j.rse.2021.112576
2021 doi
-
[14]
In-season wall-to-wall crop-type mapping using ensemble of image-segmentation models,
S. A. Zaheer et al., "In-season wall-to-wall crop-type mapping using ensemble of image-segmentation models," IEEE Trans. Geosci. Remote Sens., vol. 61, Art. no. 4411311, 2023, doi: 10.1109/TGRS.2023.3335214
2023 doi
-
[15]
Automated in-season crop-type data-layer mapping without ground truth for CONUS,
H. Li et al., "Automated in-season crop-type data-layer mapping without ground truth for CONUS," IEEE Trans. Geosci. Remote Sens., vol. 62, Art. no. 4403214, 2024, doi: 10.1109/TGRS.2024.3361895
2024 doi
-
[16]
The Harmonized Landsat and Sentinel-2 surface reflectance data set,
M. Claverie et al., "The Harmonized Landsat and Sentinel-2 surface reflectance data set," Remote Sens. Environ., vol. 219, pp. 145-161, 2018, doi: 10.1016/j.rse.2018.09.002
2018 doi
-
[17]
The Harmonized Landsat and Sentinel-2 Version 2.0 Surface Reflectance Dataset,
J. Ju, Q. Zhou, B. Freitag, D. P. Roy, H. K. Zhang, M. Sridhar, J. Mandel, S. Arab, G. Schmidt, C. J. Crawford, F. Gascon, P. A. Strobl, J. G. Masek, and C. S. R. Neigh, "The Harmonized Landsat and Sentinel-2 Version 2.0 Surface Reflectance Dataset," Remote Sens. Environ., vol...
2025 doi
-
[18]
Random forests,
L. Breiman, "Random forests," Mach. Learn., vol. 45, pp. 5-32, 2001
2001
-
[19]
Scikit-learn: Machine learning in Python,
F. Pedregosa et al., "Scikit-learn: Machine learning in Python," J. Mach. Learn. Res., vol. 12, pp. 2825-2830, 2011
2011
-
[20]
Extremely randomized trees,
P. Geurts, D. Ernst, and L. Wehenkel, "Extremely randomized trees," Mach. Learn., vol. 63, pp. 3-42, 2006
2006
-
[21]
The regression analysis of binary sequences,
D. R. Cox, "The regression analysis of binary sequences," J. Roy. Stat. Soc. B, vol. 20, pp. 215-242, 1958
1958
-
[22]
SAGA: A fast incremental gradient method with support for non- strongly convex composite objectives,
A. Defazio, F. Bach, and S. Lacoste-Julien, "SAGA: A fast incremental gradient method with support for non- strongly convex composite objectives," arXiv:1407.0202, 2014, doi: 10.48550/arXiv.1407.0202
-
[23]
Support-vector networks,
C. Cortes and V. Vapnik, "Support-vector networks," Mach. Learn., vol. 20, pp. 273-297, 1995
1995
-
[24]
Learning Bayesian networks: The combination of knowledge and statistical data,
D. Heckerman, D. Geiger, and D. M. Chickering, "Learning Bayesian networks: The combination of knowledge and statistical data," Mach. Learn., vol. 20, pp. 197-243, 1995
1995
-
[25]
Discriminatory analysis, non- parametric discrimination: Consistency properties,
E. Fix and J. L. Hodges, "Discriminatory analysis, non- parametric discrimination: Consistency properties," USAF School of Aviation Medicine, Tech. Rep. 21-49- 004, 1951
1951
-
[26]
Beyond regression: New tools for prediction and analysis in the behavioral sciences,
P. J. Werbos, "Beyond regression: New tools for prediction and analysis in the behavioral sciences," Ph.D. dissertation, Harvard Univ., Cambridge, MA, USA, 1975
1975
-
[27]
Learning representations by back-propagating errors,
D. E. Rumelhart, G. E. Hinton, and R. J. Williams, "Learning representations by back-propagating errors," Nature, vol. 323, pp. 533-536, 1986
1986
-
[28]
On lines and planes of closest fit to systems of points in space,
K. Pearson, "On lines and planes of closest fit to systems of points in space," Philos. Mag., vol. 2, pp. 559-572, 1901
1901
-
[29]
Analysis of a complex of statistical variables into principal components,
H. Hotelling, "Analysis of a complex of statistical variables into principal components," J. Educ. Psychol., vol. 24, pp. 417-441, 1933
1933
-
[30]
Bagging predictors,
L. Breiman, "Bagging predictors," Mach. Learn., vol. 24, pp. 123-140, 1996. August Posch received a B.A. in mathematics from Bowdoin College, Brunswick, ME , USA in 2018 , and M.S. in data science from Roux Institute and Khoury College of Computer Sciences, Northeastern Univer...
1996
-
[31]
Figure S5
Reflectance scale has a factor of 105, so 1000 on the plot means 10% of the sun’s light was reflected back to the satellite. Figure S5. Green reflectance by year by period. Here, period 0 means days 1 -90, period 1 means days 91-104, period 2 means days 105-118, period 3 means...
-
[32]
Figure S7
Reflectance scale has a factor of 10 5, so 1000 on the plot means 10% of the sun’s light was reflected back to the satellite. Figure S7. Near-infrared reflectance by year by period. Here, period 0 means days 1-90, period 1 means days 91- 104, period 2 means days 105-118, perio...
2018
Reviewed June 28, 2026 · model on record in the stance chip above.
Discussion (0). Continue with ORCID to comment.