REVIEW 4 major objections 4 minor 30 references
Testing known and unknown systematics in HST/WFC3 spatial scans with the Wayne simulator
T0 review · 4 major / 4 minor · reviewed 2026-08-14 · deepseek-v4-flash
Pith's one-line read The paper shows that a 0.025-pixel horizontal-shift miscalibration in HST/WFC3 spatial-scan data changes the retrieved transmission spectrum and creates false HCN and NH3 detections, so shifts must be calibrated to better than 1% of a…
desk verdict Useful simulation-based warning about horizontal shift calibration in WFC3 reductions, but the headline false-detection claim lacks statistical backing. read the letter →
The pith
A machine-rendered reading of the paper's core claim, the machinery that carries it, and where it could break.
The reading
What carries the argument
The central object is the Wayne simulator, a tool that produces synthetic WFC3 spatial-scan exposures with all known instrument systematics and with user-controlled values for additional ones. The argument is carried by an input-output loop: the simulator's known input spectrum serves as ground truth, the standard reduction pipeline used for the real HD 209458 b and 55 Cancri e spectra is run on the simulated frames, and any difference between the recovered and input spectra is attributed to the injected systematic. The specific tests modify one thing at a time: the static flat-field component is ignored while estimating horizontal shifts, an in-scan drift is added during the scan, and the non-linearity coefficients are scaled up or down. For in-scan drifts, a secondary diagnostic is introduced: the inclination of the blue edge of the two-dimensional spectrum, which is shown to be linearly related to the drift and independent of the target.
What would settle it
Generate a new set of simulations in which the input spectrum is flat, apply the same 0.025-pixel horizontal-shift bias during reduction, and check whether the output spectrum still develops a slope and whether a molecular retrieval code still reports HCN and NH3; if the artifacts disappear or shrink by more than an order of magnitude, the causal role of shift miscalibration would be disproven.
Extended reading notes
Core claim
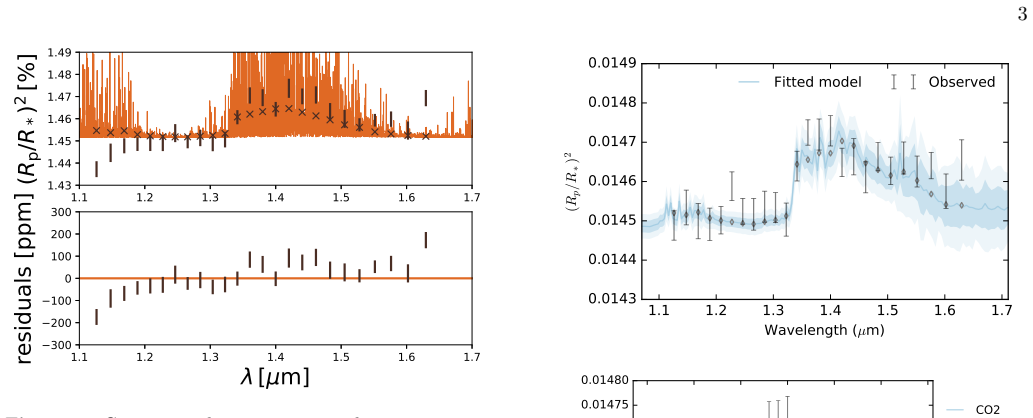
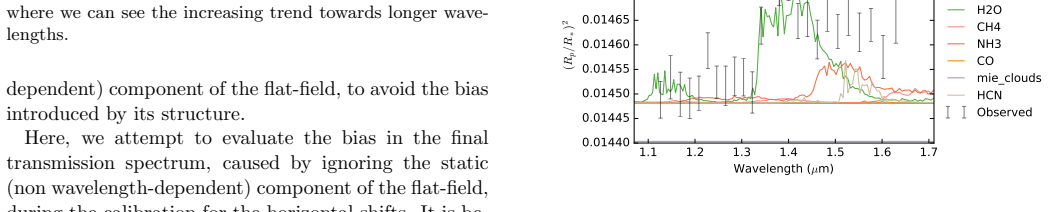
The paper's central discovery is that the most dangerous systematic in WFC3 spatial-scan spectroscopy is not an exotic one: it is the routine horizontal shift of the spectrum between exposures, when its estimation is biased. In a simulation where the input spectrum is known, deliberately miscalibrated shifts (discrepancies of the order of 0.025 pixels, varying between minus 2.5% and plus 1.0% of a pixel) change the recovered transmission spectrum by building up a slope toward longer wavelengths and strengthening the water feature; feeding that biased spectrum to a retrieval code makes it report HCN and NH3 even though neither molecule is present. The paper concludes that horizontal-shift calibration must be accurate to better than 1% of a pixel, and that the same simulation-based approach shows the spectra of HD 209458 b and 55 Cancri e are insensitive to in-scan drifts below about 1% and to non-linearity variations at the level of current uncertainties.
Load-bearing premise
The conclusions assume the Wayne simulator faithfully reproduces the real WFC3 spatial-scan systematics and that the input spectra used as truth are representative; if the simulator and the reduction pipeline share a hidden flaw, the agreement between input and output spectra cannot certify the real observations.
Editorial extensions
If this is right
- Horizontal-shift calibration methods for WFC3 must be benchmarked against simulations; a shift error near 0.025 pixels can turn a spectrum into one that appears to contain HCN and NH3 when it does not.
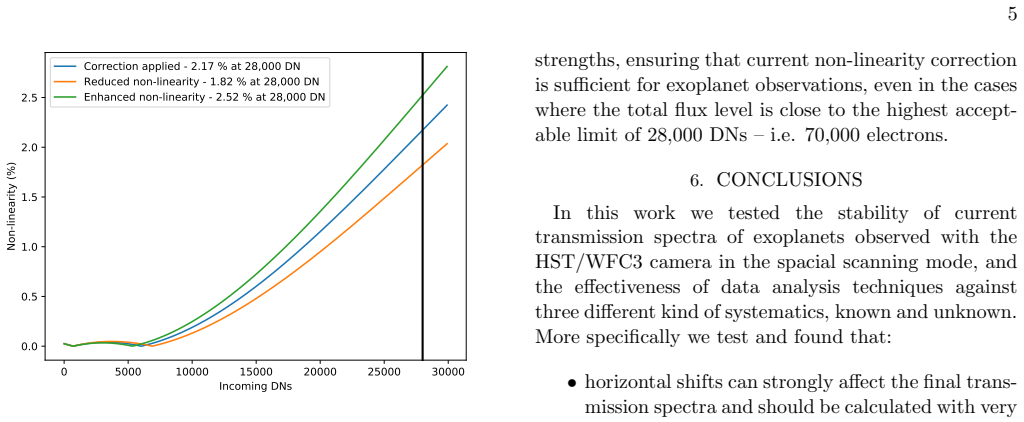
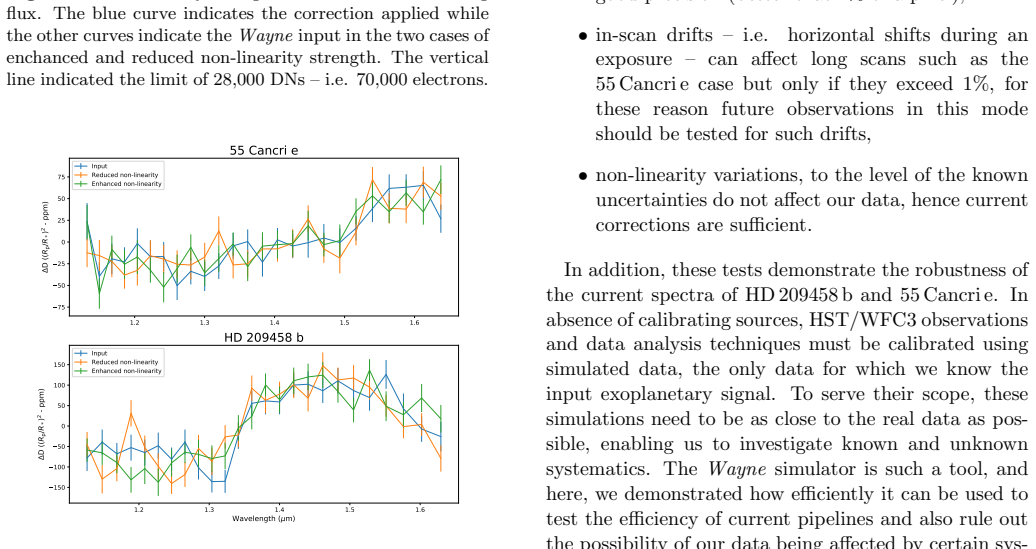
- The published HD 209458 b and 55 Cancri e spectra are stable against in-scan drifts below about 1% and against non-linearity variations at the level of the known correction uncertainties.
- Long spatial scans, such as 55 Cancri e's roughly 350-pixel scan, should be checked for in-scan drift using the blue-edge inclination before their spectra are interpreted.
- In the absence of absolute calibration targets, simulation-based validation becomes a necessary step for certifying any WFC3 transmission spectrum.
Reading between the lines
- If the 1%-of-a-pixel threshold generalizes beyond WFC3, then any spectrograph that registers spectra by sub-pixel shifts could exhibit the same failure mode, and the HCN/NH3 example gives a concrete template for that artifact.
- The blue-edge inclination diagnostic could be applied retroactively to archival long-scan WFC3 observations to flag datasets whose in-scan drift may exceed 1%.
- Some reported molecular detections in WFC3 exoplanet spectra could be artifacts of horizontal-shift biases; re-running retrievals on spectra with shifts calibrated to sub-1%-of-a-pixel precision would test this directly.
Signed reviews
Editorial analysis
A structured set of objections, weighed in public.
Referee Report
Summary. This paper presents a forward-inverse simulation study of HST/WFC3 spatial-scan exoplanet spectroscopy. Using the Wayne simulator (Varley et al. 2017) and the Iraclis analysis pipeline, the authors generate synthetic observations of HD 209458 b and 55 Cancri e that include known WFC3 systematics and then test three perturbations: (i) miscalibrated horizontal shifts caused by ignoring the static flat-field component, (ii) in-scan drifts of ±2%, and (iii) enhanced/reduced non-linearity corrections. They report that horizontal-shift errors of order 0.025 pixels produce a wavelength-dependent bias and apparent HCN/NH3 features, that long scans such as 55 Cancri e are sensitive to in-scan drifts, and that non-linearity variations at the tested level do not affect the spectra. They conclude that horizontal shifts require calibration precision better than 1% of a pixel and that the published spectra are robust to the tested systematics.
Significance. If the conclusions were fully supported, this would be a useful methodological contribution: it demonstrates a practical way to benchmark WFC3 spectral extraction pipelines against known inputs, it identifies a specific calibration bias (ignoring the static flat-field component) that creates spurious molecular signatures, and it offers a blue-edge inclination diagnostic for in-scan drifts. The public availability of Wayne and Iraclis and the deliberate comparison of input and output spectra in simulated observations are strengths. However, the headline quantitative claims currently rest on visual T-REx fits and single noise realizations, and the benchmark shares code heritage with the pipeline it validates; for these reasons the significance is conditional on a major revision.
major comments (4)
- [Section 3, Figure 3] The statement that ~0.025-pixel horizontal-shift errors 'lead to the misinterpretation of the molecular consistency' and the identification of HCN and NH3 is not quantitatively established. The manuscript shows the best-fit T-REx model and molecule contributions but reports no detection significance, ΔBIC, Bayesian evidence, or abundance uncertainties. Because a retrieval will always assign small finite opacities to additional molecules, 'identified' does not imply 'detected.' This issue is load-bearing: the final '<1% of a pixel' precision requirement is motivated by the false-detection result. Please report a formal detection statistic or replace the conclusion with a more limited statement about spectral biases.
- [Section 2 and Section 6] The benchmark is circular in an important way. The input planetary spectra for the simulated observations are set to the spectra recovered by Iraclis itself from the real data, and both Wayne and Iraclis were developed within the same group (Varley, Tsiaras, Karpouzas; Tsiaras). A systematic error shared by the simulator and the analyzer would leave the input-output comparisons unchanged, so the tests cannot certify the absolute robustness of the published HD 209458 b and 55 Cancri e spectra. Please either validate against independent truth inputs (for example, spectra from a different retrieval code or a simulator constructed independently) or explicitly restrict the conclusions to the relative sensitivity to the injected systematics.
- [Sections 3-5] No difference spectrum or inferred drift is reported with uncertainties, and each systematic level is represented by a single simulation. Consequently the residuals in Figures 2, 4, and 7 could be within noise, and statements such as 'in-scan drifts up to a level of +/-1% are... not detectable' (Section 4.2) have no statistical support. The '<1% of a pixel' threshold is also not directly tested: the demonstrated shift disagreement is about 0.025 pixels (2.5% of a pixel) with residuals between -2.5% and +1.0%, and no simulation is shown with a 1% shift error. Please add repeated noise realizations with propagated uncertainties, and either test the 1% level explicitly or rephrase the requirement as an order-of-magnitude recommendation.
- [Section 4.2] The linear calibration between blue-edge inclination and in-scan drift is used to infer drifts of -0.08% and 0.17% in the real datasets, but the number of simulated drift levels, the scatter around the fitted line in Figure 5, and the uncertainties on the inferred drifts are not reported. Since this calibration is a new diagnostic and the conclusion that the real spectra are unaffected by in-scan drifts depends on it, please characterize its precision and provide uncertainties on the inferred values.
minor comments (4)
- [Section 5.1] The text contains an apparent copy-paste error from Section 4 ('the spectrum of HD 209458 b is not sensitive to the in-scan drifts, while the spectrum of 55 Cancri e shows an increased slope...') in the discussion of non-linearity, as well as the malformed 'Figure 6 Figure 7'. Please rewrite this paragraph so it describes only the non-linearity results.
- [Various] Typos should be corrected: 'spacial scanning' (Section 6), 'ra requirement' (Section 5), 'better that 1%' (Abstract), 'the and 55 Cancri e dataset' (Section 1), 'HD 209548 b' (Figure 3 caption), and 'are to sufficent' (Section 4.2).
- [Section 4] The '+2% and -2%' drift values need their units and reference frame defined; it is not stated whether the percentage is relative to the scan length, the scan speed, or the pixel scale.
- [Section 3] The horizontal-shift calibration accuracy statement in Section 3 cites Varley et al. (2017) as 0.5% of a pixel, while the current test produces residuals up to 2.5%; a sentence reconciling these numbers would help the reader.
Circularity Check
Closed-loop validation: the simulated 'known' spectra are Iraclis's own recovered spectra and Wayne/Iraclis are same-group tools, so the robustness claims are largely self-consistency checks; the perturbed-systematics results retain independent content.
-
self definitional
[Section 2 'GENERAL SET-UP', second paragraph]
"The sky background, horizontal shifts, vertical shifts, exposure times and planetary spectra are configured to match those recovered from the real observations (for more details we refer the reader to Tsiaras et al. (2016a) and Tsiaras et al. (2016b) for details on HD 209458 b and on 55 Cancri e, respectively)."
The 'known' planetary signal used as the truth benchmark in the Wayne simulations is not an independent calibration source; it is the spectrum produced by Iraclis, the same pipeline whose robustness is being tested. The unperturbed input-output agreement shown in Figures 2, 4, and 7 is therefore a self-consistency check between Wayne and Iraclis, not an external validation. When Section 6 concludes that 'these tests demonstrate the robustness of the current spectra of HD 209458 b and 55 Cancri e,' the demonstrated property is that the pipeline recovers close to its own input when that input is its own previous solution. This makes the validation target self-defined by the pipeline under test.
-
self citation load bearing
[Section 3 'HORIZONTAL SHIFTS', third paragraph]
"The efficiency of the calibration method used in Iraclis was tested in Varley et al. (2017) and found to be accurate within 0.5% of the pixel."
This is the load-bearing calibration claim that defines the reference accuracy for horizontal shifts. Varley et al. (2017) is the Wayne simulator paper co-authored by the present first author, and the test it reports uses the same Iraclis/Wayne pair. Thus the premise that the standard pipeline is accurate to 0.5% of a pixel rests on an internal, same-group benchmark. The new 0.025-pixel disagreement is then presented as a newly discovered bias relative to that internal standard. The paper does not reduce to this citation alone, because the T-REx fits and perturbed spectra are new, but the baseline accuracy claim is imported from the authors' own prior work rather than from an independent external test.
full rationale
The paper is not deriving a prediction from first principles; it is using a simulator to test how known systematics propagate through a reduction pipeline. Most of the specific experiments are not circular by construction: the horizontal-shift test compares a known injected shift with the shift estimated by a deliberately modified Iraclis, and the resulting spectrum is then fitted with T-REx, producing HCN and NH3 features that were not present in the input. The in-scan drift and non-linearity tests similarly compare perturbed simulations against known inputs. However, the overall validation loop is partially closed. Section 2 states that the input planetary spectra are 'configured to match those recovered from the real observations,' i.e., the truth benchmark is the output of the very pipeline being validated. Wayne and Iraclis also share authorship and were developed as a pair, so the unperturbed agreement does not certify correctness against an external standard. The paper itself acknowledges this limitation when it defers cross-validation: 'we will make the data sets used here available to the community, to enable cross-validation between different methods.' Accordingly, the central horizontal-shift warning has independent empirical content, but the framing that the current published spectra are 'robust' is partly a self-consistency claim rather than an independent confirmation. This warrants a score of 4, not higher, because the key false-detection result is not equivalent to the input by definition.
Assumptions & free parameters
free parameters (4)
- Blue-edge inclination vs. in-scan drift calibration line
- Sinusoidal scan-speed variation period and amplitude =
0.7 s period, 1.5 amplitude
- Jitter noise level =
0.02 pixels/s
- Non-linearity coefficient multipliers =
c3 x0.9/1.1, c4 x0.93232/1.0612
assumptions (5)
- domain assumption Wayne reproduces all relevant known WFC3 systematics and only the injected systematics differ in the tests.
- domain assumption The linear relation between blue-edge inclination and in-scan drift, calibrated on simulations, extrapolates to real observations.
- standard math The input PHOENIX stellar spectrum is an adequate representation of HD 209458.
- domain assumption T-REx retrievals correctly identify molecules in transmission spectra.
- domain assumption The static component of the flat-field is wavelength-independent in the horizontal shift calibration.
Cite this review
Pith. "Pith review of Testing known and unknown systematics in HST/WFC3 spatial scans with the Wayne simulator." pith.science (2026). https://pith.science/paper/IX6YV4HA
@misc{pith2026190801692,
  author       = {Pith},
  title        = {Pith review of: Testing known and unknown systematics in HST/WFC3 spatial scans with the Wayne simulator},
  year         = {2026},
  howpublished = {\url{https://pith.science/paper/IX6YV4HA}},
  note         = {Machine review of arXiv:1908.01692}
}
read the original abstract
The Wide Field Camera 3 is one of the instruments currently onboard the Hubble Space Telescope and, since 2012, with the use of the spatial scanning technique, has provided the largest number of observed exoplanetary atmosphere, ranging from super-Earths to hot Jupiters. This technique enables the observation of bright targets without saturating the sensitive detectors, but at the same time requires more complicated data reduction and calibration techniques to extract the planetary signal from the observations. In absence of absolute calibration sources, the validation of current data analysis techniques is not possible as the planetary signal is not known. Here, we demonstrate how simulated observations can help us understand the effect of different analysis processes, and potential unknown systematics on the final transmission spectra of exoplanets. We test and validate the robustness of two of the most precise WFC3 exoplanetary spectra - HD 209458 b and 55 Cancri e - against three different known and potential sources of systematics. In addition, we identify the horizontal shifts seen in WFC3 observations as the most important source of systematic errors in the planetary spectra, concluding that a precision better that 1% of a pixel is necessary.
Figures

Figures from the paper (3 more)

Reference graph
Works this paper leans on
-
[1]
Allard, F., Homeier, D., & Freytag, B. 2012, Philosophical Transactions of the Royal Society of London Series A, 370, 2765, doi: 10.1098/rsta.2011.0269 Baraffe, I., Homeier, D., Allard, F., & Chabrier, G. 2015, A&A, 577, A42, doi: 10.1051/0004-6361/201425481
arXiv 2012
-
[2]
Charbonneau, D., Brown, T. M., Noyes, R. W., & Gilliland, R. L. 2002, ApJ, 568, 377, doi: 10.1086/338770
doi:10.1086/338770 2002
-
[3]
2014, ApJ, 795, 166, doi: 10.1088/0004-637X/795/2/166
Madhusudhan, N. 2014, ApJ, 795, 166, doi: 10.1088/0004-637X/795/2/166
-
[4]
2013, ApJ, 774, 95, doi: 10.1088/0004-637X/774/2/95
Deming, D., Wilkins, A., McCullough, P., et al. 2013, ApJ, 774, 95, doi: 10.1088/0004-637X/774/2/95
-
[5]
Evans, T. M., Sing, D. K., Kataria, T., et al. 2017, Nature, 548, 58, doi: 10.1038/nature23266
-
[6]
Fossati, L., Haswell, C. A., Froning, C. S., et al. 2010, ApJL, 714, L222, doi: 10.1088/2041-8205/714/2/L222
-
[7]
2014, Nature, 513, 526, doi: 10.1038/nature13785
Fraine, J., Deming, D., Benneke, B., et al. 2014, Nature, 513, 526, doi: 10.1038/nature13785
-
[8]
M., Madhusudhan, N., Deming, D., & Knutson, H
Haynes, K., Mandell, A. M., Madhusudhan, N., Deming, D., & Knutson, H. 2015, ApJ, 806, 146, doi: 10.1088/0004-637X/806/2/146
Show all 30 references
-
[9]
2008, WFC3 TV3 Testing: IR Channel Nonlinearity Correction, Tech
Hilbert, B. 2008, WFC3 TV3 Testing: IR Channel Nonlinearity Correction, Tech. rep. —. 2014, Updated non-linearity calibration method for WFC3/IR, Tech. rep
2008
-
[10]
A., Benneke, B., Deming, D., & Homeier, D
Knutson, H. A., Benneke, B., Deming, D., & Homeier, D. 2014a, Nature, 505, 66, doi: 10.1038/nature12887
-
[11]
A., Dragomir, D., Kreidberg, L., et al
Knutson, H. A., Dragomir, D., Kreidberg, L., et al. 2014b, ApJ, 794, 155, doi: 10.1088/0004-637X/794/2/155
-
[12]
L., D´ esert, J.-M., et al
Kreidberg, L., Bean, J. L., D´ esert, J.-M., et al. 2014a, Nature, 505, 69, doi: 10.1038/nature12888 —. 2014b, ApJL, 793, L27, doi: 10.1088/2041-8205/793/2/L27
-
[13]
R., Bean, J
Kreidberg, L., Line, M. R., Bean, J. L., et al. 2015, ApJ, 814, 66, doi: 10.1088/0004-637X/814/1/66
2015 doi
-
[14]
R., Stevenson, K
Line, M. R., Stevenson, K. B., Bean, J., et al. 2016, AJ, 152, 203, doi: 10.3847/0004-6256/152/6/203
2016 doi
-
[15]
L., Yang, H., France, K., et al
Linsky, J. L., Yang, H., France, K., et al. 2010, ApJ, 717, 1291, doi: 10.1088/0004-637X/717/2/1291
2010 doi
-
[16]
2014, ApJ, 791, 55, doi: 10.1088/0004-637X/791/1/55
Madhusudhan, N. 2014, ApJ, 791, 55, doi: 10.1088/0004-637X/791/1/55
2014 doi
-
[17]
K., Wakeford, H
Sing, D. K., Wakeford, H. R., Showman, A. P., et al. 2015, MNRAS, 446, 2428, doi: 10.1093/mnras/stu2279
2015 doi
-
[18]
B., D´ esert, J.-M., Line, M
Stevenson, K. B., D´ esert, J.-M., Line, M. R., et al. 2014, Science, 346, 838, doi: 10.1126/science.1256758
2014 doi
-
[19]
P., Rocchetto, M., et al
Tsiaras, A., Waldmann, I. P., Rocchetto, M., et al. 2016a, ApJ, 832, 202, doi: 10.3847/0004-637X/832/2/202
-
[20]
P., et al
Tsiaras, A., Rocchetto, M., Waldmann, I. P., et al. 2016b, ApJ, 820, 99, doi: 10.3847/0004-637X/820/2/99
-
[21]
P., Zingales, T., et al
Tsiaras, A., Waldmann, I. P., Zingales, T., et al. 2018, AJ, 155, doi: 10.3847/1538-3881/aaaf75
2018 doi
-
[22]
2017, ApJS, 231, 13, doi: 10.3847/1538-4365/aa7750
Varley, R., Tsiaras, A., & Karpouzas, K. 2017, ApJS, 231, 13, doi: 10.3847/1538-4365/aa7750
2017 doi
-
[23]
2003, Nature, 422, 143, doi: 10.1038/nature01448
Vidal-Madjar, A., Lecavelier des Etangs, A., D´ esert, J.-M., et al. 2003, Nature, 422, 143, doi: 10.1038/nature01448
2003 doi
-
[24]
M., Bourrier, V., et al
Vidal-Madjar, A., Huitson, C. M., Bourrier, V., et al. 2013, A&A, 560, A54, doi: 10.1051/0004-6361/201322234
2013 doi
-
[25]
R., Sing, D
Wakeford, H. R., Sing, D. K., Kataria, T., et al. 2017, Science, 356, 628, doi: 10.1126/science.aah4668
2017 doi
-
[26]
R., Sing, D
Wakeford, H. R., Sing, D. K., Deming, D., et al. 2018, AJ, 155, 29, doi: 10.3847/1538-3881/aa9e4e
2018 doi
-
[27]
R., Lewis, N
Wakeford, H. R., Lewis, N. K., Fowler, J., et al. 2019, AJ, 157, 11, doi: 10.3847/1538-3881/aaf04d
2019 doi
-
[28]
P., Rocchetto, M., Tinetti, G., et al
Waldmann, I. P., Rocchetto, M., Tinetti, G., et al. 2015a, ApJ, 813, 13, doi: 10.1088/0004-637X/813/1/13
-
[29]
P., Tinetti, G., Rocchetto, M., et al
Waldmann, I. P., Tinetti, G., Rocchetto, M., et al. 2015b, ApJ, 802, 107, doi: 10.1088/0004-637X/802/2/107
-
[30]
N., Deming, D., Madhusudhan, N., et al
Wilkins, A. N., Deming, D., Madhusudhan, N., et al. 2014, ApJ, 783, 113, doi: 10.1088/0004-637X/783/2/113
2014 doi
Reviewed August 14, 2026 · model on record in the stance chip above.
Discussion (0). Continue with ORCID to comment.