REVIEW 1 major objections 2 minor 1 cited by
Representation Alignment Rests on Linear Structure
T0 review · 1 major / 2 minor · reviewed 2026-06-30 · grok-4.3
Pith's one-line read Alignment between AI model representations arises because they share linear encodings of object-attribute relationships.
desk verdict The paper gives a workable tripartite breakdown of alignment into linear signal, centering bias, and frequency-driven noise, but the key SAE comparison does not rule out training artifacts. read the letter →
The pith
A machine-rendered reading of the paper's core claim, the machinery that carries it, and where it could break.
The reading
What carries the argument
The Linear Representation Hypothesis: the claim that relationships between objects and attributes are encoded as linear directions in representation space, which sparse autoencoders can isolate to reveal alignment.
What would settle it
If a linear direction identified by a sparse autoencoder is replaced by a random direction of equal magnitude while preserving sparsity statistics, and the cross-modal alignment score remains unchanged, the claim that linearity drives the alignment would be falsified.
Extended reading notes
Core claim
Platonic alignment arises from the universal relationship between objects and attributes, which is encoded linearly in representations according to the Linear Representation Hypothesis. Extracting these linear object-attribute features with sparse autoencoders produces representations that often exhibit stronger cross-modal alignment than their dense counterparts. Model-specific biases are partially removed by centering and normalization. Representational noise is driven by data scarcity, as shown by a consistent positive correlation between word frequency and alignment. These elements are combined into a statistical model that refines the Linear Representation Hypothesis and explains furthe
Load-bearing premise
The stronger cross-modal alignment observed in sparse autoencoder features is produced by their linear object-attribute structure rather than by other properties of how the autoencoders are trained or selected.
Editorial extensions
If this is right
- Sparse linear features isolated by autoencoders align more strongly across modalities than the dense representations they are extracted from.
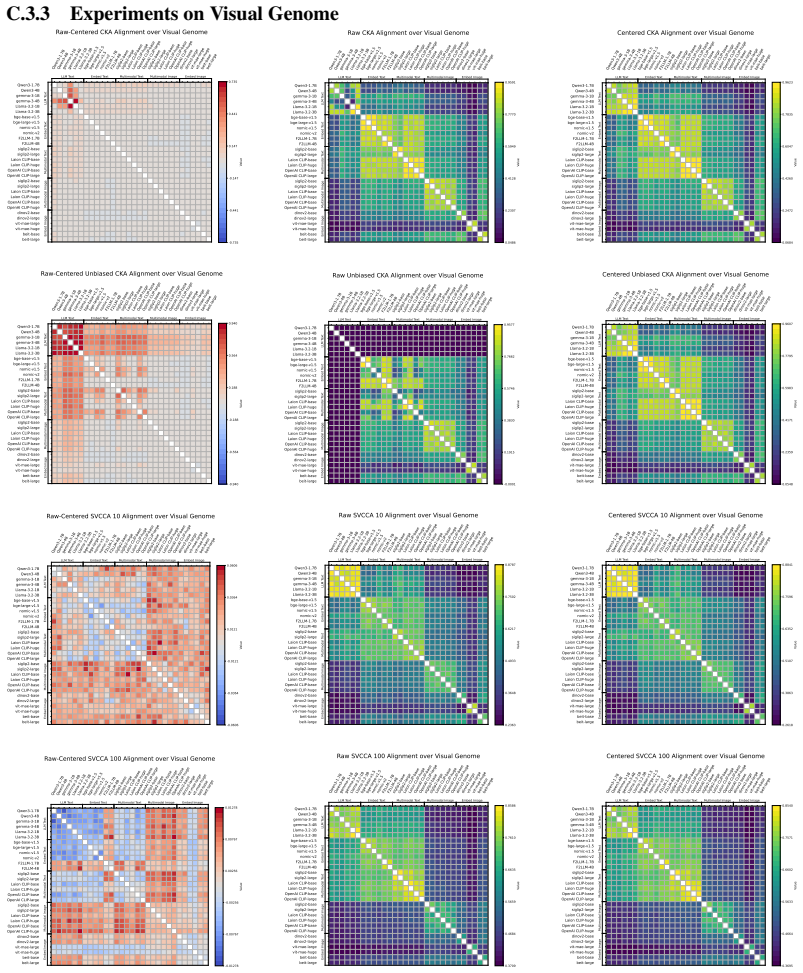
- Centering and normalizing representations reduces the effect of architecture-specific biases on alignment scores.
- Alignment between representations increases reliably with word frequency, indicating that data scarcity is the main source of representational noise.
- A statistical model that decomposes representations into linear signal, bias, and frequency-dependent noise accounts for observed alignment across diverse model families.
Reading between the lines
- If the linear encoding is the dominant source of alignment, then explicitly encouraging linear directions during pretraining could increase interoperability without additional paired data.
- The same linear-feature extraction procedure could be applied to modalities other than text and images to test whether object-attribute linearity generalizes beyond the cases examined.
- Models whose internal activations already lie close to the sparse linear subspace identified by autoencoders may require less post-hoc alignment work when combined with other models.
- Controlled synthetic datasets in which object-attribute relations are made explicitly linear or nonlinear would provide a direct test of whether linearity is necessary for the reported alignment gains.
Editorial analysis
A structured set of objections, weighed in public.
Referee Report
Summary. The manuscript proposes a tripartite statistical framework (signal, bias, noise) to explain the Platonic Representation Hypothesis (PRH). It argues that alignment arises from universal object-attribute relations encoded linearly per the Linear Representation Hypothesis (LRH), with evidence from sparse autoencoders (SAEs) showing stronger cross-modal alignment in extracted sparse features than dense representations; centering/normalization mitigates architectural biases; and word-frequency correlations indicate noise from data scarcity. A synthesized statistical model is offered to refine LRH and account for alignment phenomena.
Significance. If the central empirical claims are substantiated with appropriate controls, the work would supply a mechanistic account linking linear feature structure to cross-modal alignment, along with practical mitigations (centering) and a frequency-based noise model. This could inform representation learning and evaluation in multimodal systems.
major comments (1)
- [Signal section] Signal section (abstract and referenced signal discussion): the central evidence that SAE-extracted sparse object-attribute features exhibit stronger cross-modal alignment than dense counterparts does not isolate linearity from SAE training/selection effects. No ablation is described that holds sparsity level and selection fixed while varying linearity (e.g., random sparse bases or non-linear dictionary learning), leaving open that the alignment boost could arise from preferential extraction of high-magnitude or cross-modally consistent directions rather than from linear object-attribute encoding.
minor comments (2)
- [Abstract] Abstract and methods: empirical claims (SAE alignment gains, centering effects, frequency-alignment correlations) are stated without dataset details, sample sizes, error bars, or statistical tests; these must be supplied to allow evaluation of the reported patterns.
- [Framework introduction] Notation and framework: the tripartite decomposition (signal/bias/noise) is introduced without formal definitions or equations showing how the components combine into the proposed statistical model; explicit equations would clarify the synthesis.
Simulated Author's Rebuttal
We thank the referee for their constructive feedback. We address the major comment on the signal section below.
read point-by-point responses
-
Referee: [Signal section] Signal section (abstract and referenced signal discussion): the central evidence that SAE-extracted sparse object-attribute features exhibit stronger cross-modal alignment than dense counterparts does not isolate linearity from SAE training/selection effects. No ablation is described that holds sparsity level and selection fixed while varying linearity (e.g., random sparse bases or non-linear dictionary learning), leaving open that the alignment boost could arise from preferential extraction of high-magnitude or cross-modally consistent directions rather than from linear object-attribute encoding.
Authors: We acknowledge that the current experiments compare dense representations to SAE-extracted sparse features without additional controls that hold sparsity and selection fixed while varying linearity. This leaves open the possibility that the alignment improvement arises from SAE-specific selection of high-magnitude or consistent directions. In the revised manuscript we will add the suggested ablations, including random sparse bases and non-linear dictionary learning at matched sparsity levels, to better isolate the contribution of linear object-attribute structure. revision: yes
Circularity Check
No significant circularity; central claims rest on external empirical comparisons
full rationale
The paper advances a tripartite statistical framework (signal/bias/noise) and supports the signal component via an empirical comparison: SAE-extracted sparse linear features show stronger cross-modal alignment than dense representations. This is an observational result, not a derivation in which the target alignment metric is recovered by construction from a fitted parameter or from a self-citation chain. No equations reduce the claimed PRH explanation to the inputs by definition, no uniqueness theorem is imported from the authors' prior work, and the LRH is invoked as an external hypothesis rather than defined circularly. The evidence therefore remains falsifiable against external benchmarks and does not trigger any of the enumerated circularity patterns.
Assumptions & free parameters
Cite this review
Pith. "Pith review of Representation Alignment Rests on Linear Structure." pith.science (2026). https://pith.science/paper/J4MANZD7
@misc{pith2026260528870,
  author       = {Pith},
  title        = {Pith review of: Representation Alignment Rests on Linear Structure},
  year         = {2026},
  howpublished = {\url{https://pith.science/paper/J4MANZD7}},
  note         = {Machine review of arXiv:2605.28870}
}
read the original abstract
We investigate the Platonic Representation Hypothesis (PRH) through a tripartite statistical framework of representations: signal, bias, and noise. {1) Signal:} We propose that Platonic alignment arises from the universal relationship between objects and attributes, which is encoded linearly in representations according to the Linear Representation Hypothesis (LRH). We provide evidence that LRH helps explain PRH by extracting linear object-attribute features with sparse autoencoders and showing that these sparse representations often exhibit stronger cross-modal alignment than their dense counterparts. {2) Bias:} Models have different implicit biases due to the diverse architectures and training procedures used. We show that this difference can be partially mitigated. Centering and normalization consistently improve cross-model alignment. {3) Noise:} Finite-sample training leads to noise in representations. We provide evidence that representational noise is driven by data scarcity by revealing a strong and consistent positive correlation between word frequency and alignment in LLMs and text embedding models. Synthesizing signal, bias, and noise, we propose a statistical model that refines the Linear Representation Hypothesis and explains further phenomena related to the alignment of representations emerging from diverse modern AI architectures.
Figures


Figures from the paper (31 more)





Forward citations
Cited by 1 Pith paper
-
Laguerre Geometry for Interpreting Large Language Models
LLM concepts are Laguerre–Voronoi cells; Geometric Lens reads the exact cell of any hidden vector by isolating residual piecewise-linear flow from cross-token attention transport.
Reference graph
Works this paper leans on
-
[1]
Then, first recorded is minparams′ ij = min(logN i,logN j)
min params:Suppose that the two models i, j have respectively Ni and Nj parame- ters. Then, first recorded is minparams′ ij = min(logN i,logN j). Once computed for all models, minparams is formed by centering and normalizing to unit norm the vector (minparams′ ij)i̸=j. 2.max params:Same as above butmaxinstead ofmin
-
[2]
Then, first recorded is mindepth′ ij = min(Li, Lj)
min depth:Suppose that the two models i, j have respectively depths Li and Lj. Then, first recorded is mindepth′ ij = min(Li, Lj). Once computed for all models, mindepth is formed by centering and normalizing to unit norm the vector(mindepth ′ ij)i̸=j. 4.max depth:Same as above butmaxinstead ofmin
-
[3]
The dimension is the dimension of the representation, i.e
min dimension:Suppose that the two models i, j have respectively dimension di and dj. The dimension is the dimension of the representation, i.e. the output for multimodal and text embedding models. For image models, it is the dimension of the CLS token. In LLMs, it is the width of the respective layer. Then, first recorded is mindimension′ ij = min(logd i...
-
[4]
Then, first recorded is minimages′ ij = min(logK i,logK j)
min training images:Suppose that the two models i, j have been trained respectively on Ki and Kj images. Then, first recorded is minimages′ ij = min(logK i,logK j). Once computed for all models, minimages is formed by centering and normalizing to unit norm the vector(minimages ′ ij)i̸=j. 8.max training images:Same as above butmaxinstead ofmin
-
[5]
Then, first recorded is mintokens′ ij = min(logT i,logT j)
min training text tokens:Suppose that the two models i, j have been trained respectively on Ti and Tj text tokens. Then, first recorded is mintokens′ ij = min(logT i,logT j). Once computed for all models, mintokens is formed by centering and normalizing to unit norm the vector(mintokens ′ ij)i̸=j. 10.max training text tokens:Same as above butmaxinstead ofmin
-
[6]
Then, first recorded is minyear′ ij = min(Yi, Yj)
min year:Suppose that the two models i, j have been released respectively in years Yi and Yj. Then, first recorded is minyear′ ij = min(Yi, Yj). Once computed for all models, minyearis formed by centering and normalizing to unit norm the vector(minyear ′ ij)i̸=j. 12.max year:Same as above butmaxinstead ofmin
-
[7]
Again, they are centered and normalized
text-text, text-img, img-img:Those variables one-hot encode the modality of the repre- sented data. Again, they are centered and normalized. 45 C.5.2 Model Specifics Table 1: Specifications of Used Models: Architecture Model Identifier Params (B) Depth Width Llama-3.2-1B 1.0 16 2048 Llama-3.2-3B 3.0 28 3072 Qwen3-1.7B 1.7 28 2048 Qwen3-4B 4.0 36 2560 Gemm...
Reviewed June 30, 2026 · model on record in the stance chip above.
Discussion (0). Continue with ORCID to comment.