VT-Bench: A Unified Benchmark for Visual-Tabular Multi-Modal Learning
Pith reviewed 2026-05-21 00:27 UTC · model grok-4.3
The pith
VT-Bench collects 14 visual-tabular datasets across nine domains to create the first standard test for models that combine images with tables.
A machine-rendered reading of the paper's core claim, the machinery that carries it, and where it could break.
Core claim
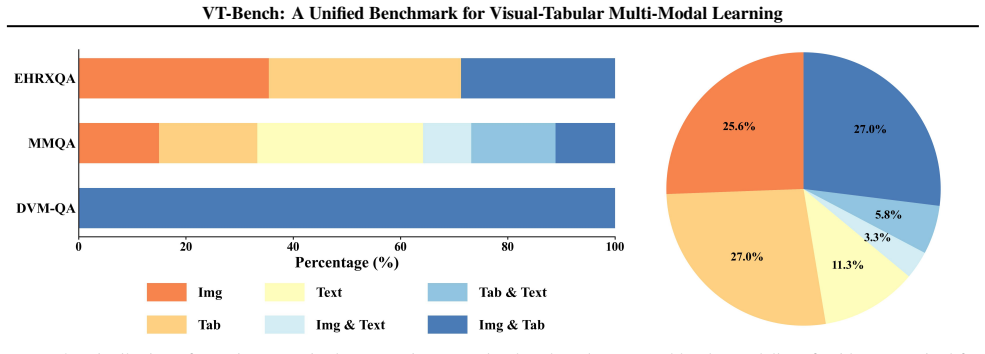
VT-Bench is the first unified benchmark for standardizing vision-tabular discriminative prediction and generative reasoning tasks. It aggregates 14 datasets across 9 domains with over 756K samples and evaluates 23 representative models, including unimodal experts, specialized visual-tabular models, general-purpose vision-language models, and tool-augmented methods, to highlight substantial challenges of visual-tabular learning.
What carries the argument
VT-Bench, the aggregated collection of 14 datasets and defined tasks that standardizes testing of models required to process both visual inputs and tabular records at once.
If this is right
- Researchers gain a single, reproducible way to compare unimodal, specialized, and vision-language models on the same visual-tabular problems.
- The evaluation results identify concrete performance gaps that new model designs must close.
- Development of foundation models able to handle combined vision and tabular data receives a clear target for improvement.
- High-stakes applications in healthcare and industry obtain a pathway toward more reliable multi-modal systems.
Where Pith is reading between the lines
- Similar aggregation efforts could be applied to other modality pairs such as audio with tables to test whether the same integration problems appear.
- Adding datasets from additional domains over time would let the benchmark track whether progress generalizes beyond the initial nine areas.
- The identified challenges suggest value in testing whether new fusion layers or reasoning modules improve results across the full set of tasks.
Load-bearing premise
The chosen datasets and domains supply a representative sample of visual-tabular difficulties without selection effects or domain artifacts shaping the measured challenges.
What would settle it
A new model achieving high scores on VT-Bench yet showing poor results on fresh visual-tabular cases drawn from a medical or industrial setting outside the nine included domains would show that the benchmark does not capture the full range of real difficulties.
Figures


read the original abstract
Multi-model learning has attracted great attention in visual-text tasks. However, visual-tabular data, which plays a pivotal role in high-stakes domains like healthcare and industry, remains underexplored. In this paper, we introduce \textit{VT-Bench}, the first unified benchmark for standardizing vision-tabular discriminative prediction and generative reasoning tasks. VT-Bench aggregates 14 datasets across 9 domains (medical-centric, while covering pets, media, and transportation) with over 756K samples. We evaluate 23 representative models, including unimodal experts, specialized visual-tabular models, general-purpose vision-language models (VLMs), and tool-augmented methods, highlighting substantial challenges of visual-tabular learning. We believe VT-Bench will stimulate the community to build more powerful multi-modal vision-tabular foundation models. Benchmark: https://github.com/Ziyi-Jia990/VT-Bench
Editorial analysis
A structured set of objections, weighed in public.
Referee Report
Summary. The manuscript introduces VT-Bench as the first unified benchmark for visual-tabular multi-modal learning. It aggregates 14 datasets across 9 domains (described as medical-centric while covering pets, media, and transportation) totaling over 756K samples, defines discriminative prediction and generative reasoning tasks, and evaluates 23 models spanning unimodal experts, specialized visual-tabular models, VLMs, and tool-augmented approaches to demonstrate substantial challenges.
Significance. A well-curated, standardized benchmark in this underexplored area could provide a valuable testbed for future work on multi-modal models in high-stakes domains. The public release of the benchmark and associated code is a concrete strength that supports reproducibility and community follow-up.
major comments (3)
- [§3] §3 (Benchmark Construction): The manuscript states the collection is 'medical-centric' but provides no quantitative breakdown of sample counts or task difficulty per domain, nor explicit inclusion/exclusion criteria or cross-domain calibration. This directly bears on the central claim that the benchmark 'highlights substantial challenges' in a generalizable way rather than domain-specific artifacts.
- [§4] §4 (Evaluation Protocol): Task standardization, preprocessing pipelines, and handling of missing tabular values or image resolutions are not described with sufficient detail to verify fairness across the 23 models. Without these, performance gaps cannot be confidently attributed to intrinsic visual-tabular difficulties.
- [§5] §5 (Results): Reported model performances lack error bars, statistical significance tests, or ablation on domain subsets. This weakens the claim that the benchmark reveals 'substantial challenges' that are representative rather than driven by the majority medical samples.
minor comments (2)
- [Abstract] The abstract could more precisely state the number of discriminative vs. generative tasks and the primary quantitative findings from the 23-model evaluation.
- [Figure 1] Figure 1 or the benchmark overview table should include per-domain sample counts and modality statistics for immediate clarity.
Simulated Author's Rebuttal
We thank the referee for their thoughtful and constructive review. We have addressed each major comment by adding quantitative details, expanding methodological descriptions, and incorporating statistical analyses to strengthen the transparency and generalizability of VT-Bench.
read point-by-point responses
-
Referee: [§3] §3 (Benchmark Construction): The manuscript states the collection is 'medical-centric' but provides no quantitative breakdown of sample counts or task difficulty per domain, nor explicit inclusion/exclusion criteria or cross-domain calibration. This directly bears on the central claim that the benchmark 'highlights substantial challenges' in a generalizable way rather than domain-specific artifacts.
Authors: We agree that a quantitative breakdown strengthens the claims. In the revised manuscript, we have added Table 2 in §3 detailing sample counts, task types, and difficulty proxies (e.g., class imbalance ratios) for each domain. Inclusion criteria are now explicitly stated: datasets were chosen for paired image-tabular availability, public accessibility, and coverage of high-stakes applications, with exclusion of purely synthetic or single-modality sets. Cross-domain calibration is achieved via unified task templates (e.g., standardized input formatting for prediction and reasoning), while preserving domain-specific features to reflect real-world variability. This supports that challenges are not artifacts of medical dominance alone. revision: yes
-
Referee: [§4] §4 (Evaluation Protocol): Task standardization, preprocessing pipelines, and handling of missing tabular values or image resolutions are not described with sufficient detail to verify fairness across the 23 models. Without these, performance gaps cannot be confidently attributed to intrinsic visual-tabular difficulties.
Authors: We appreciate this point on reproducibility. Section 4 has been expanded with a dedicated subsection on preprocessing: all images are resized to 224×224 with consistent augmentations; missing tabular values are handled via median imputation for numerical features and mode for categorical, with explicit masking flags; task standardization includes fixed prompt templates for generative tasks and label encoding for discriminative ones. These details ensure consistent evaluation across unimodal, VLM, and tool-augmented models. revision: yes
-
Referee: [§5] §5 (Results): Reported model performances lack error bars, statistical significance tests, or ablation on domain subsets. This weakens the claim that the benchmark reveals 'substantial challenges' that are representative rather than driven by the majority medical samples.
Authors: We acknowledge the need for statistical rigor. The revised §5 now includes error bars (standard deviation over 5 random seeds) for all reported metrics, paired t-tests for significance between top models, and a new ablation table comparing performance on medical vs. non-medical domain subsets. Results confirm that substantial challenges (e.g., low generative accuracy) persist in both subsets, supporting generalizability beyond medical data dominance. revision: yes
Circularity Check
No circularity: empirical benchmark with no derivations or self-referential predictions
full rationale
VT-Bench is a curation and evaluation paper that aggregates 14 existing datasets across domains and runs 23 models on them to report performance. No equations, fitted parameters, or first-principles derivations appear in the abstract or described content. The central claim (that the benchmark highlights substantial challenges) is an empirical observation from the released testbed rather than a closed-loop result that reduces to its own inputs by construction. Dataset selection and domain coverage are open to criticism on representativeness, but that is a question of external validity, not circularity in any derivation chain.
Axiom & Free-Parameter Ledger
Lean theorems connected to this paper
-
IndisputableMonolith/Cost/FunctionalEquation.leanwashburn_uniqueness_aczel unclear?
unclearRelation between the paper passage and the cited Recognition theorem.
VT-Bench aggregates 14 datasets across 9 domains (medical-centric...) with over 756K samples. We evaluate 23 representative models... highlighting substantial challenges of visual-tabular learning.
-
IndisputableMonolith/Foundation/AlphaCoordinateFixation.leanJ_uniquely_calibrated_via_higher_derivative unclear?
unclearRelation between the paper passage and the cited Recognition theorem.
We introduce two modality-specific diagnostic metrics, Modality Contribution Ratio (MCR) and Modality Informativeness Ratio (MIR)
What do these tags mean?
- matches
- The paper's claim is directly supported by a theorem in the formal canon.
- supports
- The theorem supports part of the paper's argument, but the paper may add assumptions or extra steps.
- extends
- The paper goes beyond the formal theorem; the theorem is a base layer rather than the whole result.
- uses
- The paper appears to rely on the theorem as machinery.
- contradicts
- The paper's claim conflicts with a theorem or certificate in the canon.
- unclear
- Pith found a possible connection, but the passage is too broad, indirect, or ambiguous to say the theorem truly supports the claim.
discussion (0)
Sign in with ORCID, Apple, or X to comment. Anyone can read and Pith papers without signing in.