REVIEW 3 major objections 3 minor 1 cited by
Once a protostar forms, the unaccreted gas lifetime scales with final stellar mass: low-mass stars accrete briefly from local gas, high-mass stars for millions of years from a larger volume.
Reviewed by Pith at T0; open to challenge. T0 means a machine referee read the full paper against a public rubric. the ladder, T0–T4 →
T0 review · grok-4.5
2026-07-13 09:01 UTC pith:JFBI2GOX
load-bearing objection Useful STARFORGE Lagrangian tracking of mass-dependent accretion, but the post-selected cell definition makes the lifetime–mass trend partly tautological. the 3 major comments →
The Evolution of Star-Forming Gas in STARFORGE: From Clouds, to Cores, to Stars
The pith
A machine-rendered reading of the paper's core claim, the machinery that carries it, and where it could break.
Core claim
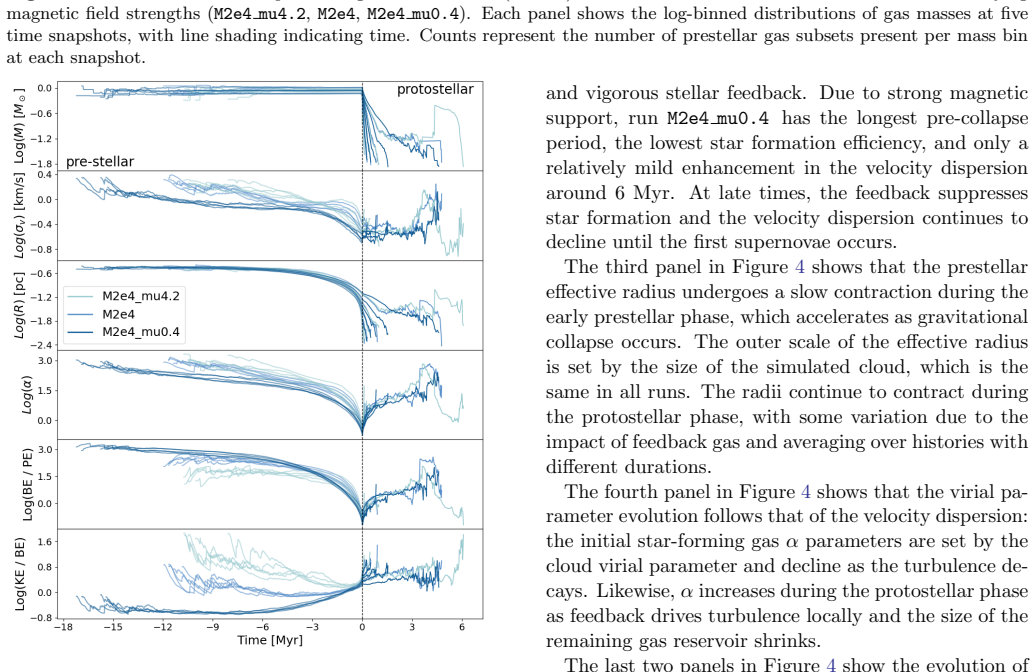
Once a protostar forms, the lifetime of its unaccreted gas correlates with final stellar mass: low-mass stars (M_* < 0.5 M_☉) accrete for 0.5–0.6 Myr from a relatively local reservoir, while high-mass stars (M_* > 2 M_☉) accrete over 3.3–4.7 Myr from a much larger volume. At formation the unaccreted gas follows turbulently regulated core scalings σ_v ∝ R^{0.47–0.55} and M ∝ R^{1.0–1.1}, and high-mass accretion histories are not well-fit by isothermal-sphere, turbulent-core, or competitive-accretion models.
What carries the argument
Lagrangian cell tracking of unaccreted gas in the STARFORGE radiation-magnetohydrodynamic cloud simulations: every fluid element that will later join a sink particle is followed from the moment of protostar formation, yielding the mass-dependent lifetime, radius, and accretion history of the true reservoir.
Load-bearing premise
That the fluid cells labelled as unaccreted gas in these three simulated clouds are a faithful stand-in for the real physical reservoir that feeds a protostar.
What would settle it
Direct comparison of measured accretion durations and reservoir sizes for a statistical sample of low-mass versus high-mass protostars in nearby star-forming regions; if the durations do not rise from ~0.5 Myr to several Myr with final mass, or if the gas does not obey the reported linewidth-size and mass-size relations at formation, the claim fails.
Editorial analysis
A structured set of objections, weighed in public.
Referee Report
Summary. The manuscript uses Lagrangian cell tracking in three STARFORGE GMC simulations (varying magnetic field strength) to follow gas that eventually accretes onto sink particles. It reports that post-formation accretion duration and reservoir size scale with final stellar mass (low-mass stars accrete ~0.5–0.6 Myr from local gas; high-mass stars ~3.3–4.7 Myr from larger volumes), that at protostar formation the unaccreted gas obeys turbulently regulated core scalings (σ_v ∝ R^{0.47–0.55}, M ∝ R^{1.0–1.1}), that low/intermediate-mass accretion histories are reasonably fit by isothermal-sphere, turbulent-core, or competitive-accretion models while many high-mass histories are intermittent and poorly fit by any of them, and that radii, velocity dispersions, virial parameters, and magnetic energy ratios of the accreting gas are largely insensitive to global cloud B. The authors conclude that star-forming gas is more extended than classical dense cores yet has core-like physical properties regulated by turbulence and feedback.
Significance. If the mass-dependent lifetimes, core-like scalings at formation, and model-fit dichotomy survive scrutiny, the work would clarify how much of a star’s mass is set by a local core versus larger-scale, longer-lived accretion, and would provide a concrete simulation-based challenge to applying isothermal-sphere / turbulent-core / competitive-accretion prescriptions uniformly across the IMF. The use of the STARFORGE suite (full feedback, MHD, sink particles) and explicit comparison to analytic accretion models are genuine strengths. The result that many high-mass accretion histories are intermittent and poorly fit by standard models is a falsifiable, observationally relevant claim.
major comments (3)
- [Methods / Lagrangian tracking definition] The central mass–lifetime and mass–radius trends rest on defining the reservoir as the set of Lagrangian cells that are eventually accreted by each sink. By construction, the “lifetime of the unaccreted gas” is then essentially the accretion duration, and high-mass sinks that continue accreting for several Myr automatically sample larger, later-arriving volumes. The abstract itself notes that the accreting gas is “more extended than typically-defined dense cores.” Without controls that (i) identify a coherent, bound or contiguous reservoir at the instant of sink formation independent of final membership, (ii) compare to randomly selected or non-accreting cell sets of equal mass, or (iii) show that the same scalings appear when the reservoir is defined by density/velocity thresholds at formation time alone, the reported correlations risk being tautological rather than physical. This defin
- [Results / sample of high-mass stars] Only three GMC realizations (varying B) are used. High-mass stars (M_* > 2 M_⊙) are rare; the reported 3.3–4.7 Myr range and the statement that “many” high-mass histories are intermittent and poorly fit therefore rest on a small sample. The paper needs to report the number of sinks in each mass bin per run, the distribution of accretion durations (not only the quoted ranges), and whether the high-mass conclusions survive leave-one-out or bootstrap tests across the three clouds.
- [Methods / numerical resolution and sink rules] Sink accretion rules and finite resolution couple cell membership to numerical parameters. The abstract asserts that radii, σ_v, virial parameters, and magnetic energy ratios are “largely insensitive” to global B, yet provides no resolution or accretion-threshold convergence tests for the Lagrangian-tracked quantities. Without those tests, it remains possible that the mass-dependent lifetimes and the failure of analytic models for high-mass stars are simulation-specific rather than physical.
minor comments (3)
- [Abstract / Results] The abstract quotes power-law indices (0.47–0.55, 1.0–1.1) without uncertainties or the mass/radius range over which they are measured; these should be stated with fit errors and the fitting procedure.
- [Methods] Clarify whether “unaccreted gas” at formation includes only cells that will later be accreted by that specific sink, or also cells that remain unbound / are accreted by other sinks; the distinction matters for comparison to observed cores.
- [Results / accretion history fits] The claim that no single analytic model fits all masses is useful; a quantitative goodness-of-fit metric (e.g., reduced χ² or residual time series) per mass bin would make the “well-fit” / “not well-fit” statements reproducible.
Circularity Check
No significant circularity: empirical Lagrangian tracking results are measured outputs, not forced by construction or self-citation.
full rationale
This is a simulation-analysis paper that reports measured properties of gas tracked via Lagrangian cells in STARFORGE runs, not a first-principles derivation whose conclusions reduce to its inputs. The reservoir is defined as cells that are eventually accreted; the reported lifetimes, enclosing radii, velocity dispersions, virial parameters, and power-law indices (σ_v ∝ R^{0.47–0.55}, M ∝ R^{1.0–1.1}) are then measured on that set at and after protostar formation. Those quantities are free to take any values consistent with the hydrodynamics, magnetic fields, and feedback; nothing in the abstract or method forces the mass-dependent timescales (0.5–0.6 Myr vs 3.3–4.7 Myr), the larger volumes for high-mass stars, or the specific exponents. Comparison of accretion histories to external analytic models (isothermal sphere, turbulent core, competitive accretion) yields both successes (low/intermediate-mass) and failures (many high-mass stars), which is independent grounding rather than a fitted-input-called-prediction. Use of the authors’ own STARFORGE suite is ordinary self-citation of a numerical experiment and does not invoke uniqueness theorems or smuggled ansatzes. Post-selection of eventually-accreted cells raises legitimate interpretive caveats about whether the set constitutes a coherent physical core at formation, but that is a methodological limitation, not circular reduction of a claimed derivation. Score 0 is therefore appropriate.
Axiom & Free-Parameter Ledger
free parameters (3)
- GMC magnetic field strengths (three runs)
- Stellar mass bins (M_* < 0.5 M_⊙ and M_* > 2 M_⊙)
- Definition of unaccreted / accreting gas reservoir (Lagrangian cell set)
axioms (3)
- domain assumption STARFORGE GMC simulations with sink particles and included feedback adequately represent the mass assembly of real protostars.
- domain assumption At protostar formation, unaccreted gas should be compared to turbulently regulated isothermal dense-core scalings (σ_v–R, M–R).
- domain assumption Isothermal-sphere, turbulent-core, and competitive-accretion models are the appropriate analytic baselines for continuous accretion histories.
read the original abstract
Star formation occurs within dense regions of giant molecular clouds (GMCs), however, exactly how gas collects and evolves to form individual stars and what role dense cores play remains unclear. We use the Lagrangian cell information in the STARFORGE simulation suite to track star-forming gas in three GMCs with varying magnetic field strengths. We find that, once a protostar forms, the lifetime of the unaccreted gas correlates with the final stellar mass, where low-mass stars ($M_*$ < 0.5 M$_\odot$) accrete for 0.5-0.6 Myr from a relatively local reservoir of gas, and high-mass stars ($M_*$ > 2 M$_\odot$) accrete over 3.3-4.7 Myr from a much larger volume. Although the protostellar accretion time increases weakly with magnetic field strength, the accreting gas radii, velocity dispersions, virial parameters, and magnetic energy ratios are largely insensitive to the global cloud properties. At the time of protostar formation, the unaccreted gas exhibits linewidth-size and mass-size relations characteristic of turbulently regulated, isothermal dense cores, following $\sigma_v \propto R^{0.47-0.55}$ and $M \propto R^{1.0-1.1}$, respectively. Low- and intermediate-mass stars undergo relatively continuous accretion and their accretion histories are well-fit by either isothermal sphere, turbulent core, or competitive accretion models, where no one model fits all masses. However, many high-mass stars experience intermittent accretion and their accretion histories are not well-fit by any of these models. While the distribution of accreting gas is more extended than typically-defined dense cores, the physical properties and structure of the star-forming gas resemble those of observed cores and are largely regulated by turbulence and feedback.
Figures




Forward citations
Cited by 1 Pith paper
-
Preferential alignment of Class 0, Class I protostellar disks in multiple systems across nine nearby molecular clouds
Disks around young stars in binary and higher-order multiple systems are preferentially aligned out to 6000 AU, implying turbulent fragmentation alone cannot explain how most multiples form.
Reference graph
Works this paper leans on
-
[1]
, " * write output.state after.block = add.period write newline
ENTRY address archivePrefix author booktitle chapter doi edition editor eprint howpublished institution journal key month number organization pages publisher school series title misctitle type volume year version url label extra.label sort.label short.list INTEGERS output.state before.all mid.sentence after.sentence after.block FUNCTION init.state.consts ...
-
[2]
write newline
" write newline "" before.all 'output.state := FUNCTION format.url url empty "" new.block "" url * "" * if FUNCTION format.eprint eprint empty "" archivePrefix empty "" archivePrefix "arXiv" = new.block " " eprint * " " * new.block " " eprint * " " * if if if FUNCTION format.doi doi empty "" " " doi * " " * if FUNCTION format.pid doi empty eprint empty ur...
-
[3]
Episodic Accretion in Young Stars
thebibliography [1] 20pt to REFERENCES 6pt =0pt \@twocolumntrue 12pt -12pt 10pt plus 3pt =0pt =0pt =1pt plus 1pt =0pt =0pt -12pt =13pt plus 1pt =20pt =13pt plus 1pt \@M =10000 =-1.0em =0pt =0pt 0pt =0pt =1.0em @enumiv\@empty 10000 10000 `\.\@m \@noitemerr \@latex@warning Empty `thebibliography' environment \@ifnextchar \@reference \@latexerr Missing key o...
Pith/arXiv arXiv doi:10.2458/azu_uapress_9780816531240-ch017 2017
discussion (0)
Sign in with ORCID, Apple, or X to comment. Anyone can read and Pith papers without signing in.