Kalimati Vegetable Price Index Forecasting with a Momentum Corrected Online Stacking Ensemble
Pith reviewed 2026-06-28 23:34 UTC · model grok-4.3
The pith
A momentum-corrected online stacking ensemble forecasts the Kalimati Vegetable Price Index to 0.68 percent MAPE at the 90-day horizon.
A machine-rendered reading of the paper's core claim, the machinery that carries it, and where it could break.
Core claim
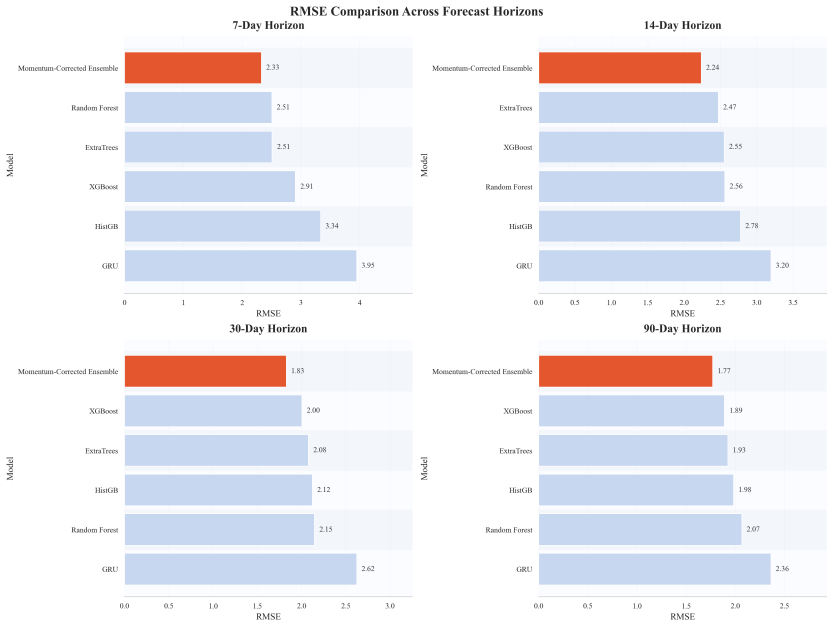
The Momentum-Corrected Online Stacking Ensemble achieved the strongest performance, yielding a Root Mean Square Error (RMSE) of 1.771, an exceptionally low Mean Absolute Percentage Error (MAPE) of 0.68%, and explaining 84.5% of the variance (R-squared = 0.845) at the 90-day horizon. Tree-based ensembles proved robust while classical statistical models and transformers struggled with the noisy series.
What carries the argument
The Momentum-Corrected Online Stacking Ensemble, which combines base-model predictions with momentum updates in an online fashion to adapt to shifting price regimes.
If this is right
- Tree-based ensembles remain stable on noisy agricultural series while transformers and statistical baselines do not.
- The KVPI supplies a macro-level signal that reduces the volatility faced by single-crop models.
- An open-source pipeline built on these features and the ensemble supplies a ready tool for food-security planning.
Where Pith is reading between the lines
- The same momentum-correction step could be inserted into other online ensembles that face non-stationary demand.
- Festival lead-lag features may transfer to price series in other regions that share similar cultural demand cycles.
- Extending the feature set with real-time weather or transport data could tighten short-horizon errors without retraining the full stack.
Load-bearing premise
The sixty-four features are causally valid and the multi-model evaluation on the 2013-2023 series identifies a genuinely superior forecaster without leakage or post-hoc selection.
What would settle it
Re-training the ensemble on price observations from 2024 onward or from a second market and verifying whether the 90-day MAPE stays below one percent.
Figures
read the original abstract
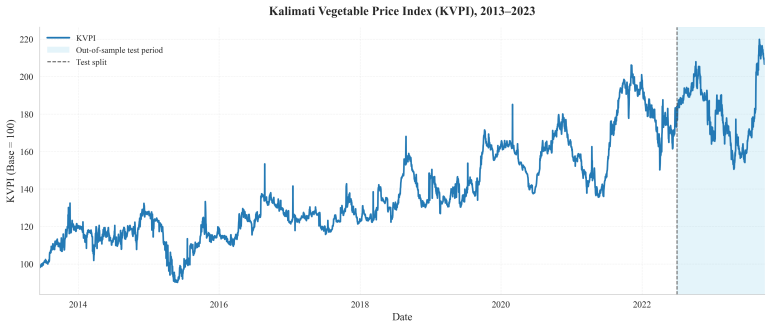
Forecasting agricultural commodity prices in emerging economies is difficult due to high volatility, frequent supply disruptions, and strong cultural influences on demand. This study introduces the Kalimati Vegetable Price Index (KVPI), a new inverse-volatility weighted composite index that aggregates 135 daily wholesale commodities from Kathmandu over ten years (2013-2023). By creating a stable macro-level signal, the KVPI reduces the noise inherent in modelling individual crops. A rich set of 64 causally valid features was developed, including festival lead-lag effects, rolling statistics, and calendar variables. Fourteen forecasting models spanning statistical, tree-based, deep learning, hybrid, and transformer architectures were rigorously evaluated across short (7-day), medium (14- and 30-day), and long-term (90-day) horizons. Tree-based ensembles proved notably robust, while classical statistical models and complex transformers struggled with the noisy dataset. The proposed Momentum-Corrected Online Stacking Ensemble achieved the strongest performance, yielding a Root Mean Square Error (RMSE) of 1.771, an exceptionally low Mean Absolute Percentage Error (MAPE) of 0.68%, and explaining 84.5% of the variance (R-squared = 0.845) at the 90-day horizon. This open-source pipeline provides policymakers and supply chain actors in Nepal and similar markets with a practical, reliable tool for anticipating price movements and strengthening food security.
Editorial analysis
A structured set of objections, weighed in public.
Referee Report
Summary. The manuscript introduces the Kalimati Vegetable Price Index (KVPI) as an inverse-volatility weighted composite index aggregating 135 daily wholesale vegetable commodities from Kathmandu over 2013-2023. It develops a set of 64 features encompassing festival lead-lag effects, rolling statistics, and calendar variables, evaluates fourteen forecasting models from statistical, tree-based, deep learning, hybrid, and transformer categories across 7-, 14-, 30-, and 90-day horizons, and proposes a Momentum-Corrected Online Stacking Ensemble that achieves the best performance with RMSE 1.771, MAPE 0.68%, and R² 0.845 at the 90-day horizon.
Significance. Should the evaluation protocol prove robust against leakage and selection bias, this work offers a practical open-source forecasting pipeline for agricultural prices in volatile emerging markets, which could support policy decisions on food security. The construction of a macro-level index to reduce noise and the broad model comparison are strengths, though the reported metrics, particularly the low MAPE, would benefit from rigorous verification to establish credibility.
major comments (2)
- [Abstract] Abstract: The claim that the 64 features are 'causally valid' and that the Momentum-Corrected Online Stacking Ensemble was 'rigorously evaluated' lacks supporting details on the out-of-sample protocol (e.g., walk-forward cross-validation, single train-test split, or adjustment for 14 models × 4 horizons), which is load-bearing for the central performance claims of RMSE=1.771, MAPE=0.68%, R²=0.845.
- [Abstract] Abstract: No information is provided on whether rolling statistics and other time-dependent features are constructed without lookahead bias (using only data ≤ t for forecasts at horizon h), which directly impacts the validity of the reported superiority and could explain the exceptionally low MAPE.
minor comments (1)
- The abstract mentions 'precise metrics' but does not report error bars, confidence intervals, or statistical significance tests against baselines, which would strengthen the presentation.
Simulated Author's Rebuttal
We thank the referee for highlighting the need for greater clarity in the abstract regarding the evaluation protocol and feature construction. We will revise the abstract and ensure the methods section explicitly details these aspects to strengthen the manuscript.
read point-by-point responses
-
Referee: [Abstract] Abstract: The claim that the 64 features are 'causally valid' and that the Momentum-Corrected Online Stacking Ensemble was 'rigorously evaluated' lacks supporting details on the out-of-sample protocol (e.g., walk-forward cross-validation, single train-test split, or adjustment for 14 models × 4 horizons), which is load-bearing for the central performance claims of RMSE=1.771, MAPE=0.68%, R²=0.845.
Authors: The full manuscript describes a walk-forward expanding-window validation protocol applied consistently across all 14 models and 4 horizons, with performance metrics reported for every combination to avoid selective reporting. The abstract's brevity omitted these specifics. We will revise the abstract to include a brief statement on the walk-forward protocol and the comprehensive model-horizon evaluation. revision: yes
-
Referee: [Abstract] Abstract: No information is provided on whether rolling statistics and other time-dependent features are constructed without lookahead bias (using only data ≤ t for forecasts at horizon h), which directly impacts the validity of the reported superiority and could explain the exceptionally low MAPE.
Authors: All time-dependent features, including rolling statistics, were constructed using only data available up to time t (i.e., strictly causal with respect to the forecast horizon h). This is stated in the methods section but not in the abstract. We will add an explicit clause in the revised abstract confirming the absence of lookahead bias in feature construction. revision: yes
Circularity Check
No circularity: purely empirical model comparison with no derivations or self-referential fits
full rationale
The manuscript reports an empirical forecasting study that constructs the KVPI index by definition (inverse-volatility weighting of 135 commodities) and then evaluates 14 models on 64 features across horizons, reporting out-of-sample metrics for the proposed ensemble. No equations, first-principles derivations, or predictions are presented that reduce to fitted inputs by construction. No self-citations are invoked as load-bearing uniqueness theorems or ansatzes. The central claims rest on comparative performance numbers rather than any algebraic or definitional equivalence, satisfying the self-contained empirical case.
Axiom & Free-Parameter Ledger
free parameters (3)
- inverse-volatility weights in KVPI
- momentum correction factor
- hyperparameters of the 14 base models
axioms (2)
- domain assumption The 2013-2023 daily series is stationary enough for multi-horizon forecasting after feature engineering.
- domain assumption Festival lead-lag effects and calendar variables are causally valid predictors rather than spurious correlates.
invented entities (2)
-
Kalimati Vegetable Price Index (KVPI)
no independent evidence
-
Momentum-Corrected Online Stacking Ensemble
no independent evidence
Reference graph
Works this paper leans on
-
[1]
Nepal development update: April 2023
World Bank. Nepal development update: April 2023. Technical report, World Bank, Washington, DC, 2023. URL https://www.worldbank.org/en/country/nepal/publication/ nepaldevelopmentupdate. Accessed: 2026-05-28
2023
-
[2]
Economic survey 2080/81
Government of Nepal, Ministry of Finance. Economic survey 2080/81. Technical report, Government of Nepal, Ministry of Finance, Kathmandu, 2023. Agriculture contributes 24.0% to GDP, 62.0% employment
2080
-
[3]
Rising food prices, food price volatility, and social unrest.American Journal of agricultural economics, 97(1):1–21, 2015
Marc F Bellemare. Rising food prices, food price volatility, and social unrest.American Journal of agricultural economics, 97(1):1–21, 2015
2015
-
[4]
Statistical and machine learning forecasting methods: Concerns and ways forward.PloS one, 13(3):e0194889, 2018
Spyros Makridakis, Evangelos Spiliotis, and Vassilios Assimakopoulos. Statistical and machine learning forecasting methods: Concerns and ways forward.PloS one, 13(3):e0194889, 2018
2018
-
[5]
Time-series forecasting with deep learning: a survey.Philosophical transactions of the royal society a: mathematical, physical and engineering sciences, 379(2194), 2021
Bryan Lim and Stefan Zohren. Time-series forecasting with deep learning: a survey.Philosophical transactions of the royal society a: mathematical, physical and engineering sciences, 379(2194), 2021
2021
-
[6]
Time series forecasting using a hybrid arima and neural network model.Neurocom- puting, 50:159–175, 2003
G Peter Zhang. Time series forecasting using a hybrid arima and neural network model.Neurocom- puting, 50:159–175, 2003
2003
-
[7]
A Time Series is Worth 64 Words: Long-term Forecasting with Transformers
Yuqi Nie, Nam H Nguyen, Phanwadee Sinthong, and Jayant Kalagnanam. A time series is worth 64 words: Long-term forecasting with transformers.arXiv preprint arXiv:2211.14730, 2022
work page internal anchor Pith review Pith/arXiv arXiv 2022
-
[8]
Neural basis expansion analysis with exogenous variables: Forecasting electricity prices with nbeatsx.International Journal of Forecasting, 39(2):884–900, 2023
Kin G Olivares, Cristian Challu, Grzegorz Marcjasz, Rafał Weron, and Artur Dubrawski. Neural basis expansion analysis with exogenous variables: Forecasting electricity prices with nbeatsx.International Journal of Forecasting, 39(2):884–900, 2023
2023
-
[9]
John Wiley & Sons, 2015
George EP Box, Gwilym M Jenkins, Gregory C Reinsel, and Greta M Ljung.Time series analysis: forecasting and control. John Wiley & Sons, 2015
2015
-
[10]
Application of arima model for forecasting agricultural prices.Journal of agricultural science and technology, 19(5):981–992, 2025
GM Gaddi, BV Chinnappa Reddy, and V Jadhav. Application of arima model for forecasting agricultural prices.Journal of agricultural science and technology, 19(5):981–992, 2025
2025
-
[11]
Enhancing agricultural commodity price forecasting with deep learning.Scientific Reports, 15(1):20903, 2025
RL Manogna, Vijay Dharmaji, and S Sarang. Enhancing agricultural commodity price forecasting with deep learning.Scientific Reports, 15(1):20903, 2025
2025
-
[12]
Nhat-Quang Tran, Anna Felipe, Thanh Nguyen Ngoc, Tom Huynh, Quang Tran, Arthur Tang, and Thuy Nguyen. Predicting agricultural commodities prices with machine learning: A review of current research.arXiv preprint arXiv:2310.18646, 2023
-
[13]
Xgboost: A scalable tree boosting system
Tianqi Chen and Carlos Guestrin. Xgboost: A scalable tree boosting system. InProceedings of the 22nd acm sigkdd international conference on knowledge discovery and data mining, pages 785–794, 2016
2016
-
[14]
Long short-term memory.Neural computation, 9(8): 1735–1780, 1997
Sepp Hochreiter and Jürgen Schmidhuber. Long short-term memory.Neural computation, 9(8): 1735–1780, 1997
1997
-
[15]
Transformers in time series: A survey.arXiv preprint arXiv:2202.07125, 2022
Qingsong Wen, Tian Zhou, Chaoli Zhang, Weiqi Chen, Ziqing Ma, Junchi Yan, and Liang Sun. Transformers in time series: A survey.arXiv preprint arXiv:2202.07125, 2022
-
[16]
doi:10.48550/ arXiv.1905.10437
Boris N Oreshkin, Dmitri Carpov, Nicolas Chapados, and Yoshua Bengio. N-beats: Neural basis expansion analysis for interpretable time series forecasting.arXiv preprint arXiv:1905.10437, 2019. 20
-
[17]
Long sequence time-series forecasting with deep learning: A survey.Information Fusion, 97:101819, 2023
Zonglei Chen, Minbo Ma, Tianrui Li, Hongjun Wang, and Chongshou Li. Long sequence time-series forecasting with deep learning: A survey.Information Fusion, 97:101819, 2023
2023
-
[18]
Predicting prices of staple crops using machine learning: A systematic review of studies on wheat, corn, and rice.Sustainability, 17(12):5456, 2025
Asterios Theofilou, Stefanos A Nastis, Anastasios Michailidis, Thomas Bournaris, and Konstadinos Mattas. Predicting prices of staple crops using machine learning: A systematic review of studies on wheat, corn, and rice.Sustainability, 17(12):5456, 2025
2025
-
[19]
An artificial neural network (p,d,q) model for timeseries forecasting
Mehdi Khashei and Mehdi Bijari. An artificial neural network (p,d,q) model for timeseries forecasting. Expert Syst. Appl., 37(1):479–489, January 2010. ISSN 0957-4174. doi: 10.1016/j.eswa.2009.05.044. URLhttps://doi.org/10.1016/j.eswa.2009.05.044
-
[20]
David H. Wolpert. Original contribution: Stacked generalization.Neural Netw., 5(2):241–259, February 1992. ISSN 0893-6080. doi: 10.1016/S0893-6080(05)80023-1. URLhttps://doi.org/10. 1016/S0893-6080(05)80023-1
-
[21]
Dynamic classifier selection: Recent advances and perspectives.Information Fusion, 41:195–216, 2018
Rafael MO Cruz, Robert Sabourin, and George DC Cavalcanti. Dynamic classifier selection: Recent advances and perspectives.Information Fusion, 41:195–216, 2018
2018
-
[22]
Utilizing ensemble learning techniques to enhance corn price prediction: A case study on south dakota.Agronomy, 15(11):2447, 2025
Jihene Kaabi, Youssef Harrath, and Ethan Price. Utilizing ensemble learning techniques to enhance corn price prediction: A case study on south dakota.Agronomy, 15(11):2447, 2025
2025
-
[23]
Le Wang and Boyuan Zhang. The promise of time-series foundation models for agricultural forecasting: Evidence from marketing year average prices.arXiv preprint arXiv:2601.06371, 2026
-
[24]
Kalimati tarkari dataset
Open Data Nepal. Kalimati tarkari dataset. https://opendatanepal.com/datasets/ kalimati-tarkari-dataset, 2024. Accessed: May 2026
2024
-
[25]
Olivares, Cristian Challú, Azul Garza, Max Mergenthaler Canseco, and Artur Dubrawski
Kin G. Olivares, Cristian Challú, Azul Garza, Max Mergenthaler Canseco, and Artur Dubrawski. NeuralForecast: User friendly state-of-the-art neural forecasting models. PyCon Salt Lake City, Utah, US 2022, 2022. URLhttps://github.com/Nixtla/neuralforecast. 21
2022
discussion (0)
Sign in with ORCID, Apple, or X to comment. Anyone can read and Pith papers without signing in.