REVIEW 3 major objections 4 minor 36 references
Electron-positron pair production in frequency modulated laser fields
T0 review · 3 major / 4 minor · reviewed 2026-08-14 · deepseek-v4-flash
Pith's one-line read Sinusoidal frequency modulation of a laser field can enhance electron-positron pair production by over two orders of magnitude, while encoding the field's frequency content in the pair momentum spectrum.
desk verdict Solid QVE study of frequency-modulated pair production with a clean spectral interpretation, but the claimed order-of-magnitude enhancement is for a transverse-momentum slice, not the total yield. read the letter →
The pith
A machine-rendered reading of the paper's core claim, the machinery that carries it, and where it could break.
The reading
What carries the argument
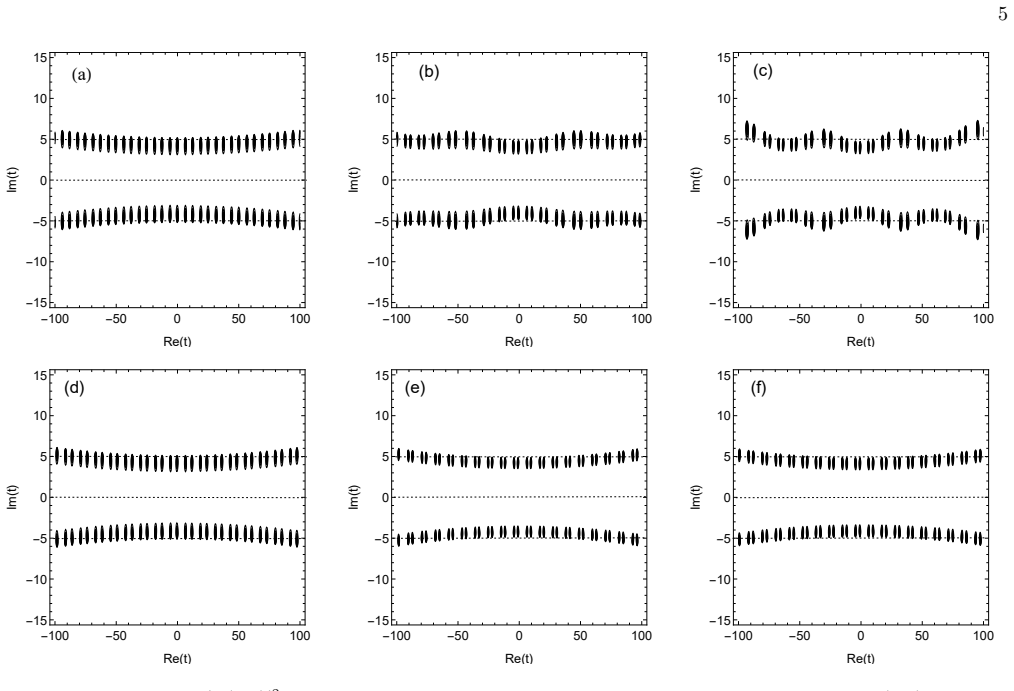
The engine of the calculation is the quantum Vlasov equation for the one-particle momentum distribution $f(p,t)$, recast as three coupled first-order equations for $f$, $u$, and $v$ and integrated from vacuum initial conditions. The interpretive load is carried by two further objects: the frequency spectrum of the modulated field, whose sidebands $\omega_0\pm n\omega_m$ supply the photon channels that produce the momentum peaks, and the turning-point phase-integral formula $f(p)\approx\sum e^{-2K}+\sum 2\cos(2\theta)e^{-K-K'}$, where the complex-time turning points of $\Omega(p,t)=\sqrt{\varepsilon_\perp^2+k_\parallel^2(t)}$ determine both the overall yield and the interference contrast. The constraint $b\omega_m\le\alpha\omega$ with $0\le\alpha<1$ bounds the effective frequency excursion and is what makes the enhancement claim physically meaningful rather than an artifact of unbounded chirp.
What would settle it
Integrate Eq. (3) over all perpendicular momenta for the parameters of point F ($E_0=0.1E_{\mathrm{cr}}$, $\omega=0.5m$, $\tau=100/m$, $\omega_m=0.022m$, $b=8.64$) and compare with the unmodulated case; if the total yield is not roughly 200 times larger, the two-orders enhancement holds only for the single momentum slice shown, not for the full pair yield.
Extended reading notes
Core claim
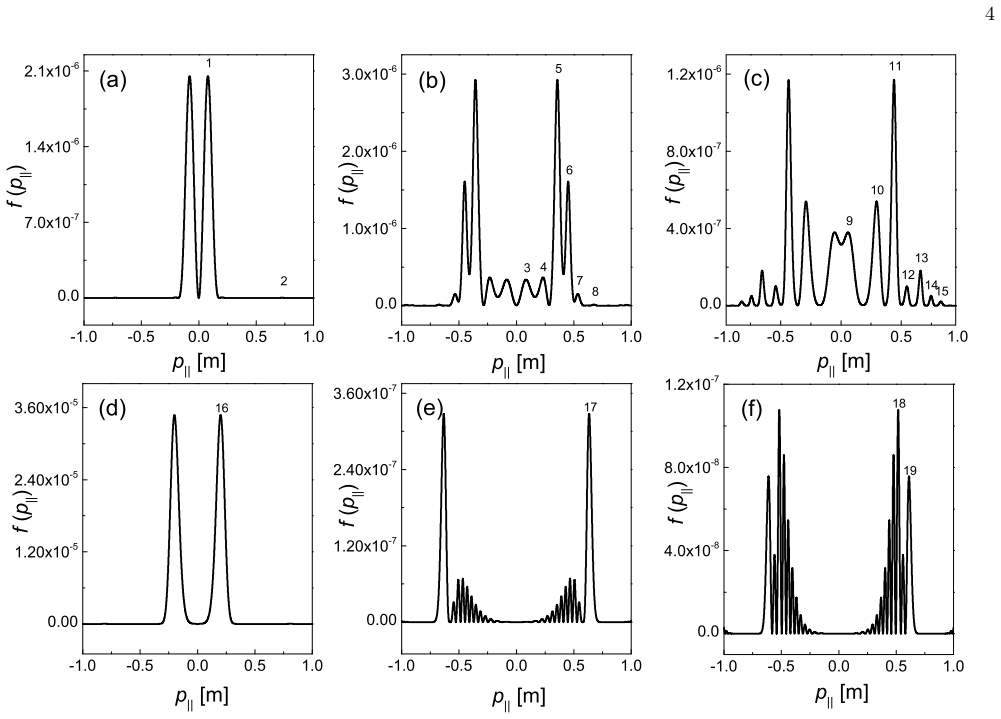
The central claim is that a frequency-modulated electric field leaves a quantifiable fingerprint on both the yield and the momentum distribution of created pairs. In the field $E(t)=E_0 e^{-t^2/2\tau^2}\cos(\omega t+b\sin(\omega_m t))$, the quantum Vlasov equation gives a final momentum distribution $f(p,\infty)$ with a series of peaks. Using the effective-mass energy $E(p)=2\sqrt{m_*^2+p^2}$ (with $m_*$ the laser-dressed mass), the authors assign every peak to a multiphoton process that absorbs a definite combination of carrier and sideband photons, such as $3\omega_0+\omega_1$ or $4\omega_0+\omega_6$; this is why they call the spectrum an imprint of the modulation. The same interference is recovered from a turning-point phase-integral formula, where the number and proximity of complex-time turning points of $\Omega(p,t)$ control the visibility of the fringes. For the pair density per transverse-momentum cell defined in Eq. (3), the computed value grows from $1.04\times 10^{-7}$ (unmodulated) to $2.03\times 10^{-5}$ for $(\omega_m,b)=(0.022m,8.64)$ at $\omega=0.5m$, and a similar factor of about 200 appears for $\omega=0.7m$.
Load-bearing premise
The paper's central enhancement claim depends on an unstated and unintegrated transverse-momentum slice: the reported density is per transverse-momentum cell, and the paper does not say which cell is used or integrate over cells, so the two-orders result may not describe the total number of pairs created.
Editorial extensions
If this is right
- Pair yields can be tuned by choosing modulation parameters without raising the peak field strength, since the dominant sideband frequency can be shifted onto a favorable multiphoton threshold.
- The spacing and positions of momentum peaks reveal the carrier and sideband frequencies of the laser pulse, so the momentum spectrum can act as a diagnostic of the field's frequency content.
- Enhancement is not automatic: modulation parameters that place the dominant sideband at a valley of the frequency-yield curve suppress pair production below the unmodulated value, so pulse design must respect the density-versus-frequency landscape.
- The turning-point analysis provides a shortcut for predicting which momentum peaks interfere strongly, based on which complex-time turning points lie closest to the real time axis.
- A similar 200-fold enhancement appears for a second carrier frequency, $\omega=0.7m$, suggesting the mechanism is not tied to one special carrier frequency.
Reading between the lines
- A check the paper leaves implicit is to integrate Eq. (3) over all perpendicular momenta; the reported 200-fold gain is for the density per transverse-momentum cell, and the total-yield enhancement could differ.
- The one-to-one map between momentum peaks and sideband combinations suggests a reverse-engineering tool: from a measured pair spectrum, one could recover the modulation depth and frequency of the pulse that produced it.
- The density-versus-frequency curve could be used as an optimizer: choose modulation parameters so that the dominant sideband lands on a maximum of that curve, and predict the best enhancement without scanning the whole parameter plane.
- If the imprint interpretation holds, a detector of pair momenta could decode information carried by the laser's modulation, turning vacuum pair creation into a communication channel—an idea the paper raises only as a closing question.
Signed reviews
Editorial analysis
A structured set of objections, weighed in public.
Referee Report
Summary. The paper studies electron-positron pair creation in a spatially homogeneous, time-dependent frequency-modulated laser field by solving the quantum Vlasov equation numerically. It reports that the longitudinal momentum spectrum develops an interference pattern whose peaks can be associated with multiphoton absorption channels involving the different Fourier components of the modulated field, and it offers a semiclassical interpretation based on turning-point structures in the complex time plane. The authors then scan the modulation parameters (ω_m, b) and report that the pair number density can be enhanced or suppressed relative to the unmodulated case, with a maximum enhancement of about two orders of magnitude claimed for certain parameter sets.
Significance. If the central claims hold, the paper would demonstrate a controllable way to enhance pair production with frequency-modulated lasers and would suggest that the momentum spectrum can be used to read out the frequency content of the driving field. The numerical method is standard, the equations are given in enough detail to reproduce the calculation, and the qualitative peak assignments are internally consistent. However, the primary quantitative claim—that the number of created pairs is enhanced by over two orders of magnitude—rests on an unstated transverse-momentum convention, and the peak assignment relies on an assumed effective-mass formula whose validity in strongly modulated fields is not established. These issues are load-bearing and need to be addressed before the main conclusions are fully supported.
major comments (3)
- [Sec. III C, Eq. (3), Table II] The quantity n(t) defined in Eq. (3) is explicitly a number density per d^2 p_perp/(2π)^2, but Fig. 4 and Table II never state the value of p_perp used to compute the reported numbers. If, as the text implies, p_perp = 0 is used, then the statement that "the number density of created electron-positron pairs" is enhanced by over two orders of magnitude refers only to the zero-transverse-momentum slice, not to the total pair yield. Since the resonance condition used for peak assignment, E = 2√(m*^2 + p∥^2 + p⊥^2), shifts the peaks in p∥ as p⊥ changes, the enhancement factor for the integrated yield n_3D = 2∫ d^2p⊥/(2π)^2 ∫ dp∥/(2π) f(p⊥,p∥;∞) may differ substantially from the value quoted at point F. Please state the p⊥ value explicitly or perform the p⊥ integration, and adjust the abstract and conclusion accordingly.
- [Sec. III A, Eq. (5)] The effective-mass formula m* = m√(1 + e^2 E0^2/(2m^2 ω^2)) is derived for a monochromatic field, but it is used here to assign peak energies for frequency-modulated fields, including cases with b = 9.52 where the original frequency is no longer dominant. The paper does not justify this application. In addition, the peak positions are matched after the fact to the known Fourier components of the same field, so the agreement in Table I and the associated text is a consistency check rather than an independent prediction. Please provide a validity criterion for the effective-mass approximation in the modulated field or an alternative derivation that fixes the expected peak positions without using the same Fourier components that are being identified.
- [Sec. III C, Eq. (7)] Equation (7) defines ω_eff = ω + b sin(ω_m t)/t, but the instantaneous frequency of the field in Eq. (4) is d/dt[ω t + b sin(ω_m t)] = ω + b ω_m cos(ω_m t). The displayed expression is not the instantaneous frequency of Eq. (4) and is not dimensionally consistent unless b carries units of time. The bound (8), b ≤ αω/ω_m, does follow from the correct instantaneous-frequency deviation bω_m, so the numerical results are not affected, but Eq. (7) should be corrected to avoid a misleading derivation of the physically reasonable parameter range.
minor comments (4)
- [Sec. III B] The text repeatedly uses "inference effect" where "interference effect" is meant; please correct this throughout the section.
- [Table I caption] The caption says the table lists p_n for n from 0 to 19, but only p_1 through p_19 are shown; p_0 is missing, so either add it or change the caption.
- [Fig. 2] The extracted version of Fig. 2 does not show axis labels or units; please ensure that all panels have clearly labeled axes with the momentum unit (m) indicated.
- [Abstract and Sec. IV] The statement that the interference effect "can also be understood qualitatively by analyzing turning point structures" is vague; specify that this is a semiclassical, phase-integral interpretation and not a quantitative predictive method.
Circularity Check
No significant circularity: the QVE results are independent numerical solutions, and the frequency-spectrum analysis is an interpretive consistency check, not a fitted input.
full rationale
The paper's derivation chain is self-contained. Equations (1)-(3) define the quantum Vlasov equation and the number density, and Eq. (4) defines the frequency-modulated field. All results are obtained by numerically solving these equations with stated initial conditions and no adjustable parameters fitted to the plotted output. The momentum-peak assignments in Sec. III A use Eq. (5) plus the Fourier frequencies of the same field, but this is an energy-conservation consistency check, not an input that forces the QVE output; the momentum spectrum itself is computed independently. The enhancement analysis in Sec. III C invokes the independently computed single-frequency curve n(ω) (Fig. 5) to explain why particular modulation parameters sit near resonance; this is a physical interpretation of the parameter scan, not a re-importation of the target quantity. The only notable concern--that Eq. (3) defines n per d^2 p_perp/(2π)^2 and Table II does not state p_perp--is a presentation and interpretation ambiguity, not a circularity, because the quoted ratio (2.03e-5 vs 1.04e-7) is still a comparison of two simulations at the same (unspecified) transverse momentum. Self-citations (Refs. 11, 17-19, 25-27) support the method and background, but no central claim is justified solely by them.
Assumptions & free parameters
free parameters (1)
- alpha (maximum relative effective-frequency deviation) =
0.38 (point F), 0.576 (point L); contour lines at 0.1, 0.32, 0.5, 1.0
assumptions (3)
- domain assumption The quantum Vlasov equation (1) correctly describes electron-positron pair creation in a spatially homogeneous, time-dependent electric field.
- ad hoc to paper The effective-mass formula m* = m sqrt(1 + e^2 E0^2/(2 m^2 omega^2)) (Eq. 5) is applicable to the frequency-modulated field when assigning peak energies.
- ad hoc to paper The restriction b <= alpha omega / omega_m (Eq. 8) with alpha < 1 defines the physically reasonable range of modulation parameters.
Cite this review
Pith. "Pith review of Electron-positron pair production in frequency modulated laser fields." pith.science (2026). https://pith.science/paper/K7AUFVIR
@misc{pith2026190808189,
  author       = {Pith},
  title        = {Pith review of: Electron-positron pair production in frequency modulated laser fields},
  year         = {2026},
  howpublished = {\url{https://pith.science/paper/K7AUFVIR}},
  note         = {Machine review of arXiv:1908.08189}
}
read the original abstract
The momentum spectrum and the number density of created electron-positron pairs in a frequency modulated laser field are investigated using quantum kinetic equation. It is found that the momentum spectrum presents obvious interference pattern. This is an imprint of the frequency modulated field on the momentum spectrum, because the momentum peaks correspond to the pair production process by absorbing different frequency component photons. Moreover, the interference effect can also be understood qualitatively by analyzing turning point structures. The study of the pair number density shows that the number density is very sensitive to modulation parameters and can be enhanced by over two orders of magnitude for certain modulation parameters, which may provide a new way to increase the number of created electron-positron pairs in future experiments.
Figures

Figures from the paper (2 more)


Reference graph
Works this paper leans on
-
[1]
P. A. M. Dirac, Proc. Roy. Soc. Lond. A 117, 610 (1928)
1928
-
[2]
07, 2 . 14, 2 . 21 and 2 . 28, respectively. Based on energy conservation, these momentum peaks are still caused by four-photon absorption process, because E4 ≈ 3ω 0 + ω 1, E5 ≈ 3ω 0 + ω 2, E6 ≈ 3ω 0 + ω 3 and E7 ≈ 3ω 0 + ω 4. By the way, since the original frequency dominates the frequency components of the modulated electric field, a large number of phot...
-
[3]
080 0 . 728 0 . 083 0 . 232 0 . 356 0 . 451 0 . 535 0 . 731 0 . 059 0 . 294 0 . 440 0 . 547 0 . 658 0 . 746 0 . 828 0 . 196 0 . 633 0 . 517 0 . 611 the reflection coefficient. f (p) ≈ ∑ tp e−2K p p + ∑ tp⁄=tp′ 2 cos(2θ(p,p ′) p )(−1)p−p′ e−K p p−K p′ p , (6) with K p p = ⏐ ⏐ ⏐ ⏐ ⏐ ∫ tp t∗ p Ω( p, t ) dt ⏐ ⏐ ⏐ ⏐ ⏐, θ (p,p ′) p = ⏐ ⏐ ⏐ ⏐ ⏐ ∫ Re(tp′ ) Re(tp) Ω(...
-
[4]
578m, which correspond to a peak and a valley of the particle number density shown in Fig. 5, respectively. Therefore, the pair number density at point B is larger than the one without frequency modulation ( ω = 0. 5m), while the number density at point C is smaller than the latter one. A similar result can also be found by com- paring the values of momen...
-
[5]
009m, one can see that the number density is also in- creased, see Fig. 4 (a), because the dominant frequency moves from 0 . 578m to 0 . 585m see Fig. 1 (b). In the range of 0 . 32 ≤ α ≤ 1. 0, the minimum and maximum values of the number density of created pairs are E : 9 . 89 × 10−9 and F : 2. 03 × 10−5, respectively. It can be seen that the number densi...
-
[6]
Sauter, Z
F. Sauter, Z. Phys. 69, 742 (1931)
1931
-
[7]
J. S. Schwinger, Phys. Rev. 82, 664 (1951)
1951
-
[8]
For a comprehensive review, see A. Di Piazza, C. M¨ uller, K. Z. Hatsagortsyan, and C. H. Keitel, Rev. Mod. Phys. 84, 1177 (2012)
work page 2012
Show all 36 references
-
[9]
B. S. Xie, Z. L. Li, and S. Tang, Matter and Radiation at Extremes 2, 225 (2017)
2017
-
[10]
G. V. Dunne, and C. Schubert, Phys. Rev. D 72, 105004 (2005)
2005
-
[11]
G. V. Dunne, Q. H. Wang, H. Gies, and C. Schubert, Phys. Rev. D 73, 065028 (2006)
2006
-
[12]
Q. Z. Lv, A. C. Su, M. Jing, Y. J. Li, R. Grobe and Q. Su, Phys. Rev. A 87, 023416 (2013)
2013
-
[13]
Jiang, Q
M. Jiang, Q. Z. Lv, Z. M. Sheng, R. Grobe, and Q. Su, Phys. Rev. A 87, 042503 (2013)
2013
-
[14]
Q. Su, W. Su, Z. Q. Lv, M. Jing, X. Lu, Z. M. Sheng and R.Grobe, Phys. Rev. Lett. 109, 253202 (2012)
2012
-
[15]
C. Gong, Z. L. Li, and Y. J. Li, Phys. Rev. A 98, 043424 (2018)
2018
-
[16]
S. P. Kim, and D. N. Page, Phys. Rev. D 65, 105002 (2002)
2002
-
[17]
S. P. Kim, and D. N. Page, Phys. Rev. D 75, 045013 (2007)
2007
-
[18]
Alkofer, M
R. Alkofer, M. B. Hecht, C. D. Roberts, S. M. Schmidt, and D. V. Vinnik, Phys. Rev. Lett. 87, 193902 (2001)
2001
-
[19]
Akkermans and G
E. Akkermans and G. V. Dunne, Phys. Rev. Lett. 108, 030401 (2012)
2012
-
[20]
Hebenstreit, R
F. Hebenstreit, R. Alkofer, and H. Gies, Phys. Rev. D 82, 105026 (2010)
2010
-
[21]
Z. L. Li, D. Lu, B. S. Xie, L. B. Fu, J. Liu, and B. F. Shen, Phys. Rev. D 89, 093011 (2014)
2014
-
[22]
Z. L. Li, D. Lu, B. S. Xie, B. F. Shen, L. B. Fu, and J. Liu, Europhys. Lett. 110, 51001 (2015)
2015
-
[23]
Z. L. Li, Y. J. Li, and B. S. Xie, Phys. Rev. D 96, 076010 (2017)
2017
-
[24]
G. R. Mocken, M. Ruf, C. M¨ uller, and C. H. Keitel, Phys. Rev. A 81, 022122 (2010)
2010
-
[25]
I. Akal, S. Villalba-Ch´ avez, and C. M¨ uller, Phys. Rev. D 90, 113004 (2014)
2014
-
[26]
Schutzhold, H
R. Schutzhold, H. Gies, and G. V. Dunne, Phys. Rev. Lett. 101, 130404 (2008)
2008
-
[27]
Nuriman, B
A. Nuriman, B. S. Xie, Z. L. Li, and D. Sayipjamal, Phys. Lett. B 717, 465 (2012)
2012
-
[28]
C. K. Dumlu, Phys. Rev. D 82, 045007 (2010)
2010
-
[29]
Jiang, B
M. Jiang, B. S. Xie, H. B. Sang, and Z. L. Li, Chin. Phys. B 22, 100307 (2013)
2013
-
[30]
Abdukerim, Z
N. Abdukerim, Z. L. Li, and B. S. Xie, Chin. Phys. B 26, 020301 (2017)
2017
-
[31]
Olugh, Z
O. Olugh, Z. L. Li, B. S. Xie, and R. Alkofer, Phys. Rev. D 99, 036003 (2019)
2019
-
[32]
Su and R
Q. Su and R. Grobe, Phys. Rev. Lett. 122, 023603 (2019)
2019
-
[33]
Brezin, and C
E. Brezin, and C. Itzykson, Phys. Rev. D 2, 1191 (1970)
1970
-
[34]
Kohlf¨ urst, H
C. Kohlf¨ urst, H. Gies, and R. Alkofer, Phys. Rev. Lett. 112, 050402 (2014)
2014
-
[35]
C. K. Dumlu, and G. V. Dunne, Phys. Rev. Lett. 104, 250402 (2010)
2010
-
[36]
C. K. Dumlu, and G. V. Dunne, Phys. Rev. D 83, 065028 (2011)
2011
Reviewed August 14, 2026 · model on record in the stance chip above.
Discussion (0). Continue with ORCID to comment.