REVIEW 4 major objections 5 minor 29 references
CBOWRA: A Representation Learning Approach for Medication Anomaly Detection
T0 review · 4 major / 5 minor · reviewed 2026-08-14 · deepseek-v4-flash
Pith's one-line read A word-embedding model flags wrong prescriptions by finding the drug least likely to fit the diagnosis list.
desk verdict The CBOWRA paper is a reasonable idea undermined by an in-sample evaluation and a gold standard that the authors themselves show flags correct prescriptions as errors. read the letter →
The pith
A machine-rendered reading of the paper's core claim, the machinery that carries it, and where it could break.
The reading
What carries the argument
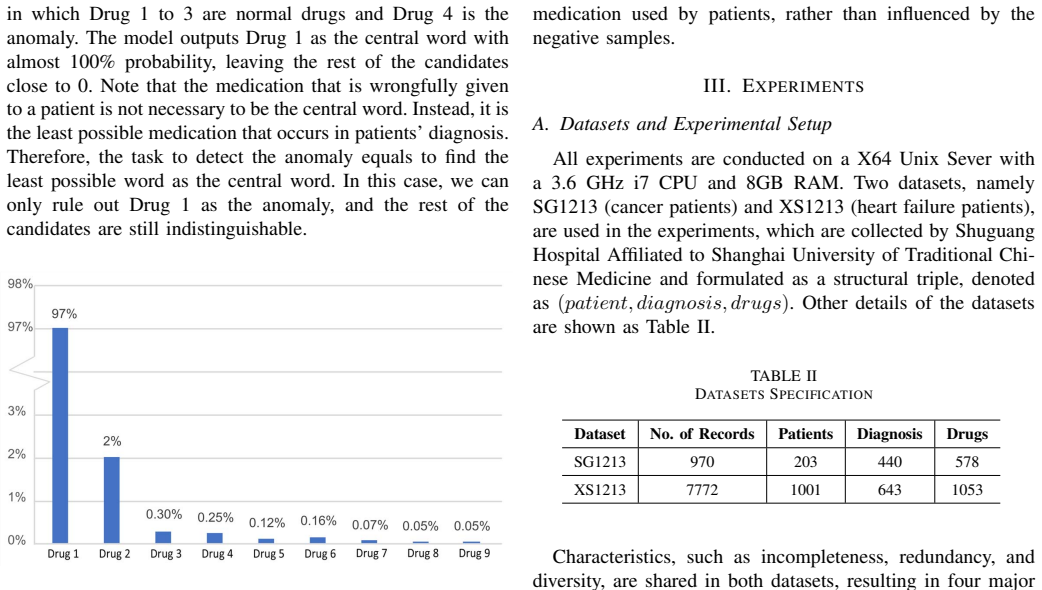
The central object is the CBOWRA model: a continuous bag-of-words network whose input layer receives diagnosis vectors and prescription vectors, projects them into embeddings, sums the projections, then performs a dot product with disease vectors before a softmax outputs the probability of each drug being the central word. The ranking accumulation step converts single-sample probabilities into robust anomaly scores by summing central-word probabilities over all combinations of diagnosis context, so that the drug with the lowest accumulated score is the predicted anomaly. The load-bearing assumption is that wrong drugs are less probable as central words in the patient's diagnosis context than correct drugs.
What would settle it
Take a dataset of EHR records with clinician-confirmed medication error labels. Compute CBOWRA's predicted anomaly ranking, then check whether clinically justified off-diagnosis prescriptions, such as laxatives after chemotherapy, are systematically ranked as top anomalies. If a large fraction of clinically appropriate drugs are flagged as anomalies, the core assumption fails.
Extended reading notes
Core claim
The paper claims that a medication anomaly can be detected as the semantic inconsistency between a patient's diagnoses and prescriptions, and that this reduces to finding the least probable central word under a modified continuous bag-of-words model. Training is expert-free: diagnoses are treated as surrounding context and prescribed drugs as central words, with negative sampling restricted to drugs not prescribed to the patient. At detection time, a ranking accumulation strategy sums each candidate drug's central-word probability across all diagnosis combinations, and the drug with the smallest accumulated rank is the anomaly. On the two hospital datasets the method reaches top-N accuracy of over 0.84 in all settings, with gains of 3.91 to 10.91 percentage points on SG1213 and 0.68 to 2.13 percentage points on XS1213 over the strongest comparison methods.
Load-bearing premise
The method assumes that an anomalous medication is the one least likely to be predicted as the central word given the patient's diagnoses, which breaks for clinically appropriate prescriptions that are unrelated to the listed diagnoses.
Editorial extensions
If this is right
- If CBOWRA works as claimed, an expert-free screening tool can rank likely medication errors at the top of a candidate list, letting clinicians focus review effort on fewer records.
- The same diagnosis-as-context, drug-as-central-word framing could be applied to other EHR inconsistency checks, such as mismatched lab orders or procedure codes.
- Because the model learns semantic consistency from the data itself, it can be retrained on new hospital data without rebuilding feature sets by hand.
- The ranking accumulation strategy may transfer to any setting where a model outputs per-candidate scores and the anomaly is the lowest-scoring candidate rather than an outlier in feature space.
Reading between the lines
- An implicit consequence is that the method's usefulness depends on how often clinically justified off-diagnosis prescriptions occur; the paper's own example of Kaiseru for chemotherapy-induced constipation shows such cases are real, and if they are frequent the model would systematically flag appropriate care as an error.
- The method could be tested on a third dataset with known medication error labels from chart review, rather than the pharmacopeia-derived standard answers, to see whether its top-N ranking matches clinician judgments on more nuanced cases.
- The dot-product layer between diagnosis vectors and projected prescription embeddings suggests that adding structured clinical knowledge, such as drug indications or side-effect relations, could sharpen the probability contrast without changing the architecture.
Signed reviews
Editorial analysis
A structured set of objections, weighed in public.
Referee Report
Summary. The paper proposes CBOWRA, a representation-learning method to detect medication-diagnosis mismatches in electronic health records. It adapts CBOW so that prescribed drugs are predicted as 'central words' from multi-hot diagnosis contexts; at detection time, each candidate drug receives a probability, scores are ranked ascending, and a ranking-accumulation procedure combines scores over diagnosis subsets, with the lowest accumulated score declared anomalous. The method is evaluated on two Chinese hospital datasets (SG1213, cancer patients; XS1213, heart failure patients) and compared against LOF, Naive Bayes variants, and TransE/H/D/R. The paper reports that CBOWRA achieves the highest TopN accuracy on both datasets, with gains of 3.91-10.91% and 0.68-2.13% over the baselines. The discussion and future-work sections acknowledge limitations of the artificial standard answer set and of modeling only diagnosis and medication concepts.
Significance. If the evaluation were sound, CBOWRA would be a useful, simple, expert-free baseline for flagging candidate medication errors, and the ranking-accumulation idea is a reasonable way to convert softmax probabilities into a detection score. The baseline set is broad, and the paper deserves credit for attempting a comparison across distance-based, probabilistic, and embedding-based methods. However, the central performance claim is not interpretable as stated: the reference standard is the same semantic-mismatch heuristic the model learns, the experimental protocol has no out-of-sample split, and the paper itself supplies examples where the gold standard labels appropriate drugs as anomalies. The reported accuracy margins therefore do not support the claimed superiority, and no code or data is provided to allow independent checking. The novelty of the method itself is modest, but the core idea may merit future work with a valid benchmark.
major comments (4)
- [Section III.A.4; Section IV] The reference standard is built by comparing each drug's pharmacopeia indications with the patient's diagnoses and flagging non-matching drugs as abnormal, which encodes the same semantic-mismatch assumption that CBOWRA learns. High agreement with this standard is therefore partly by construction. More seriously, the manuscript itself gives concrete cases where the standard is wrong: Section IV, point 1 states that hemostasis, analgesia, and side-effect-suppression injections are classified as anomalies despite being appropriate, and point 2 states that suppository glycerol is labeled an anomaly although it treats chemotherapy-induced constipation; the introduction's Kaiseru example is the same phenomenon. The reported TopN accuracies thus measure agreement with a naive indication-matching rule rather than detection of true medication errors. The statement that experienced doctors helped ensure accuracy is not supported by any protocol or inter-rater information, and the future-work paragraph concedes that the standard suffers from low accuracy, incomplete information, and poor timeliness.
- [Section II.C-D; Section III.A] No train/validation/test split is described anywhere in the experimental setup. The CBOWRA model is trained on the diagnosis-prescription co-occurrences of all patients in each dataset and then used to score those same patients' medications during the ranking-accumulation detection phase. The top-1 values in Table V (0.879) and Table VI (0.639) are therefore in-sample fits, which are likely inflated. An out-of-sample patient-level split, with hyperparameter selection on a validation set and ideally a temporal split, is required before any claim about detection accuracy can be interpreted.
- [Section II.B; Section I; Section IV] The detection rule assumes that the probability of a wrong drug appearing in the diagnoses is lower than that of normal drugs and that the medication with the lowest central-word probability is the anomaly. The introduction gives the counterexample of Kaiseru, a laxative appropriate for chemotherapy-induced constipation despite not matching the cancer diagnoses, and Section IV, point 2 reports that the model identifies suppository glycerol as normal while the gold standard labels it anomalous. The paper should quantify how often such clinically appropriate off-diagnosis medications occur in SG1213 and XS1213 and evaluate on clinician-adjudicated labels; otherwise the method will systematically flag correct prescriptions, and its TopN behavior on the current gold standard cannot be interpreted as detection performance.
- [Section III.B; Tables V, VI] The sentence claiming that CBOWRA 'possesses the highest accuracy (over 0.84) in all settings' is contradicted by Table VI, where CBOWRA's TopN values range from 0.639 down to 0.622 on XS1213; the 0.84 figure applies only to SG1213. In addition, the paper reports no variance, confidence intervals, or significance tests for any of the comparisons, so the claimed margins over traditional methods are not established.
minor comments (5)
- [Table III; Section II.D] The notation is inconsistent: Table III fixes 'No. of Central Words' to 1, while Section II.D instructs selecting k medications as central words and defines s = n - k negative candidates; please clarify k, m, n, and s and how they relate to the Table III parameters.
- [Equation (2)] Equation (2) is typeset ambiguously: the division by 2m and the sum over the vocabulary are not clearly structured, so the reader cannot tell whether the denominator is (1/2m) times the sum or the sum of exponentials each scaled by 1/(2m).
- [Section II.C] The sentence 'there will be cmk surrounding words' uses undefined symbols c and k; later the text refers to C^m_M without defining whether this is a combination count, and the relationship to the window size m is unclear.
- [Section IV] The future-work paragraph says a string similarity matching method was used to construct the standard answers, but Section III.A.4 only describes pharmacopeia indication comparison; please describe the matching procedure or remove the inconsistent reference.
- [General] The paper does not state data availability, code availability, or ethics/IRB approval for using real patient EHR data; these details are needed for reproducibility and for assessing compliance in a clinical-data study.
Circularity Check
The reported TopN accuracy is an in-sample fit: the CBOW model is trained and evaluated on the same patient records, with detection performed on 'each training sample,' so the claimed 'predictions' are partly forced by the training data rather than demonstrated out-of-sample.
-
fitted input called prediction
[Section II.C (training-set construction), Section II.D (anomaly detection on training samples), and Section III.A.5 (evaluation with no held-out split)]
"From all the diagnoses of a patient, select m different diagnoses to combine with the medication. In total, there will be cm k surrounding words; 2) Choose one drug from the prescription given to one patient as the central word... For each training sample, we can generate the probability of different medications in the output layer."
The training set is built from every patient's own diagnoses and prescriptions, and the ranking-accumulation step that produces each anomaly score is described as operating on 'each training sample.' No train/test split is reported in Section III, so the TopN accuracies in Tables V and VI measure the model's reconstruction of the same diagnosis-medication pairs it was optimized on. The probabilities that decide whether a drug is the 'least possible central word' come from embeddings trained on those very patients, so each evaluated patient's ranking is an in-sample output rather than a prediction. The reported superiority (e.g., Top-1 0.879 on SG1213, 0.639 on XS1213) is therefore partly forced by construction and does not establish generalization to unseen records.
full rationale
The only concrete reduction I can exhibit from the paper's own text is the absence of any train/test separation. CBOWRA is an unsupervised representation learner and is not fitted to the anomaly labels, so the gold-standard construction is not a fitted-parameter circularity. The gold standard is independently problematic on correctness grounds: Section IV itself states that appropriate medications such as glycerol suppositories 'are labeled as an anomaly,' and the paper admits the standard answer construction has 'low accuracy, incomplete information, and poor timeliness of medical knowledge.' That is a benchmark-validity concern rather than a derivation-chain circularity. There is no load-bearing self-citation: the word2vec citations [24] and [29] are standard external sources, and the method's design is not justified by a same-author uniqueness theorem. The central circularity is that detection is performed on the same 'training samples' from which the CBOW distribution was learned, so the reported TopN numbers are in-sample fits. Had a held-out split been used, the in-sample issue would disappear, leaving only the separate benchmark-validity problem; as written, the main empirical claim is evaluated on the training data, making the 'prediction' partly a fitted score.
Assumptions & free parameters
free parameters (5)
- Number of surrounding words (window size m) =
2
- Number of negative samples =
5
- Number of central words =
1
- Number of diseases =
64
- Embedding dimension =
not specified
assumptions (3)
- domain assumption Anomalous medications are rare and have lower conditional probability than correct medications given the patient's diagnoses.
- domain assumption The semantic relation between diagnoses and prescriptions is learnable by a CBOW-style model with a dot-product modification.
- domain assumption The standard answer set built from pharmacopeia indications and string matching is accurate enough to evaluate detection.
Cite this review
Pith. "Pith review of CBOWRA: A Representation Learning Approach for Medication Anomaly Detection." pith.science (2026). https://pith.science/paper/KIAYSIMV
@misc{pith2026190807147,
  author       = {Pith},
  title        = {Pith review of: CBOWRA: A Representation Learning Approach for Medication Anomaly Detection},
  year         = {2026},
  howpublished = {\url{https://pith.science/paper/KIAYSIMV}},
  note         = {Machine review of arXiv:1908.07147}
}
read the original abstract
Electronic health record is an important source for clinical researches and applications, and errors inevitably occur in the data, which could lead to severe damages to both patients and hospital services. One of such error is the mismatches between diagnoses and prescriptions, which we address as 'medication anomaly' in the paper, and clinicians used to manually identify and correct them. With the development of machine learning techniques, researchers are able to train specific model for the task, but the process still requires expert knowledge to construct proper features, and few semantic relations are considered. In this paper, we propose a simple, yet effective detection method that tackles the problem by detecting the semantic inconsistency between diagnoses and prescriptions. Unlike traditional outlier or anomaly detection, the scheme uses continuous bag of words to construct the semantic connection between specific central words and their surrounding context. The detection of medication anomaly is transformed into identifying the least possible central word based on given context. To help distinguish the anomaly from normal context, we also incorporate a ranking accumulation strategy. The experiments were conducted on two real hospital electronic medical records, and the topN accuracy of the proposed method increased by 3.91 to 10.91% and 0.68 to 2.13% on the datasets, respectively, which is highly competitive to other traditional machine learning-based approaches.
Figures


Figures from the paper (2 more)

Reference graph
Works this paper leans on
-
[1]
Mining electronic health records (EHRs): a survey,
P. Yadav, M. Steinbach, V . Kumar, and G. Simon, “Mining electronic health records (EHRs): a survey,” ACM Computing Surveys (CSUR) , vol. 50, no. 6, p. 85, 2018
work page 2018
-
[2]
PatientEG Dataset: Bringing Event Graph Model with Temporal Relations to Electronic Medical Records
X. Liu, J. Jin, Q. Wang, T. Ruan, Y . Zhou, D. Gao, and Y . Yin, “Patienteg dataset: Bringing event graph model with temporal relations to electronic medical records,” arXiv preprint arXiv:1812.09905 , 2018
work page Pith review arXiv 2018
-
[3]
The challenges in defining and measuring diagnostic error,
L. Zwaan and H. Singh, “The challenges in defining and measuring diagnostic error,” Diagnosis, vol. 2, no. 2, pp. 97–103, 2015
work page 2015
-
[4]
C. Galper, “Medication errors,” The Lancet , vol. 349, no. 9056, pp. 959–960, 1997
work page 1997
-
[5]
Diagnostic error in medicine: analysis of 583 physician-reported errors,
G. D. Schiff, O. Hasan, S. Kim, R. Abrams, K. Cosby, B. L. Lambert, A. S. Elstein, S. Hasler, M. L. Kabongo, N. Krosnjar et al., “Diagnostic error in medicine: analysis of 583 physician-reported errors,” Archives of internal medicine , vol. 169, no. 20, pp. 1881–1887, 2009
work page 2009
-
[6]
C. C. Aggarwal, “Outlier analysis,” in Data mining . Springer, 2015, pp. 237–263
work page 2015
-
[7]
Distance-based outlier detection in data streams,
L. Tran, L. Fan, and C. Shahabi, “Distance-based outlier detection in data streams,” Proceedings of the VLDB Endowment , vol. 9, no. 12, pp. 1089–1100, 2016
work page 2016
-
[8]
Privacy-preserving lof outlier detection,
L. Li, L. Huang, W. Yang, X. Yao, and A. Liu, “Privacy-preserving lof outlier detection,” Knowledge and Information Systems , vol. 42, no. 3, pp. 579–597, 2015
work page 2015
Show all 29 references
-
[9]
On the evaluation of outlier detection and one-class classification methods,
L. Swersky, H. O. Marques, J. Sander, R. J. Campello, and A. Zimek, “On the evaluation of outlier detection and one-class classification methods,” in IEEE International Conference on Data Science and Advanced Analytics (DSAA) . IEEE, 2016, pp. 1–10
2016
-
[10]
On the evaluation of unsu- pervised outlier detection: measures, datasets, and an empirical study,
G. O. Campos, A. Zimek, J. Sander, R. J. Campello, B. Micenkov ´a, E. Schubert, I. Assent, and M. E. Houle, “On the evaluation of unsu- pervised outlier detection: measures, datasets, and an empirical study,” Data Mining and Knowledge Discovery , vol. 30, no. 4, pp. 891–927, 2016
2016
-
[11]
A com- parative evaluation of outlier detection algorithms: Experiments and analyses,
R. Domingues, M. Filippone, P. Michiardi, and J. Zouaoui, “A com- parative evaluation of outlier detection algorithms: Experiments and analyses,” Pattern Recognition, vol. 74, pp. 406–421, 2017
2017
-
[12]
Outlier detection in healthcare fraud: A case study in the medicaid dental domain,
G. V . Capelleveen, M. Poel, R. M. Mueller, D. Thornton, and J. V . Hillegersberg, “Outlier detection in healthcare fraud: A case study in the medicaid dental domain,” International Journal of Accounting Information Systems, vol. 21, pp. 18–31, 2016
2016
-
[13]
Medication errors: new eu good practice guide on risk minimisation and error prevention,
T. Goedecke, K. Ord, V . Newbould, S. Brosch, and P. Arlett, “Medication errors: new eu good practice guide on risk minimisation and error prevention,” Drug safety, vol. 39, no. 6, pp. 491–500, 2016
2016
-
[14]
Screening for medication errors using an outlier detection system,
G. D. Schiff, L. A. V olk, M. V olodarskaya, D. H. Williams, L. Walsh, S. G. Myers, D. W. Bates, and R. Rozenblum, “Screening for medication errors using an outlier detection system,” Journal of the American Medical Informatics Association , vol. 24, no. 2, pp. 281–287, 2017
2017
-
[15]
Probabilistic-mismatch anomaly detection: Do one’s med- ications match with the diagnoses,
L. Zhang, X. Li, H. Liu, J. Mei, G. Hu, J. Zhao, Y . Zou, B. Xie, and G. Xie, “Probabilistic-mismatch anomaly detection: Do one’s med- ications match with the diagnoses,” in 2016 IEEE 16th International Conference on Data Mining (ICDM) . IEEE, 2016, pp. 659–668
2016
-
[16]
Predicting urinary tract infections in the emergency department with machine learning,
R. A. Taylor, C. L. Moore, K.-H. Cheung, and C. Brandt, “Predicting urinary tract infections in the emergency department with machine learning,” PloS one, vol. 13, no. 3, p. e0194085, 2018
2018
-
[17]
Drug prescription support in dental clinics through drug corpus mining,
W. P. Goh, X. Tao, J. Zhang, J. Yong, W. Zhang, and H. Xie, “Drug prescription support in dental clinics through drug corpus mining,” International Journal of Data Science and Analytics , vol. 6, no. 4, pp. 341–349, 2018
2018
-
[18]
Natural language processing tech- nologies in radiology research and clinical applications,
T. Cai, A. A. Giannopoulos, S. Yu, T. Kelil, B. Ripley, K. K. Kumamaru, F. J. Rybicki, and D. Mitsouras, “Natural language processing tech- nologies in radiology research and clinical applications,” Radiographics, vol. 36, no. 1, pp. 176–191, 2016
2016
-
[19]
Natural language processing in radiology: a systematic review,
E. Pons, L. M. Braun, M. M. Hunink, and J. A. Kors, “Natural language processing in radiology: a systematic review,”Radiology, vol. 279, no. 2, pp. 329–343, 2016
2016
-
[20]
Learning semantic textual similarity from conversations,
Y . Yang, S. Yuan, D. Cer, S.-y. Kong, N. Constant, P. Pilar, H. Ge, Y .-H. Sung, B. Strope, and R. Kurzweil, “Learning semantic textual similarity from conversations,” arXiv preprint arXiv:1804.07754 , 2018
2018 arXiv
-
[21]
Video captioning with attention-based lstm and semantic consistency,
L. Gao, Z. Guo, H. Zhang, X. Xu, and H. T. Shen, “Video captioning with attention-based lstm and semantic consistency,” IEEE Transactions on Multimedia, vol. 19, no. 9, pp. 2045–2055, 2017
2017
-
[22]
Learning semantic representa- tions for unsupervised domain adaptation,
S. Xie, Z. Zheng, L. Chen, and C. Chen, “Learning semantic representa- tions for unsupervised domain adaptation,” in International Conference on Machine Learning , 2018, pp. 5419–5428
2018
-
[23]
Fast and accurate recognition of chinese clinical named entities with residual dilated convolutions,
J. Qiu, Q. Wang, Y . Zhou, T. Ruan, and J. Gao, “Fast and accurate recognition of chinese clinical named entities with residual dilated convolutions,” in2018 IEEE International Conference on Bioinformatics and Biomedicine (BIBM) . IEEE, 2018, pp. 935–942
2018
-
[24]
Efficient estimation of word representations in vector space,
T. Mikolov, K. Chen, G. Corrado, and J. Dean, “Efficient estimation of word representations in vector space,” arXiv preprint arXiv:1301.3781 , 2013
2013 arXiv
-
[25]
Translating embeddings for modeling multi-relational data,
A. Bordes, N. Usunier, A. Garcia-Duran, J. Weston, and O. Yakhnenko, “Translating embeddings for modeling multi-relational data,” in Ad- vances in neural information processing systems , 2013, pp. 2787–2795
2013
-
[26]
Knowledge graph embedding by translating on hyperplanes,
Z. Wang, J. Zhang, J. Feng, and Z. Chen, “Knowledge graph embedding by translating on hyperplanes,” in Twenty-Eighth AAAI conference on artificial intelligence, 2014
2014
-
[27]
Knowledge graph embedding via dynamic mapping matrix,
G. Ji, S. He, L. Xu, K. Liu, and J. Zhao, “Knowledge graph embedding via dynamic mapping matrix,” in Proceedings of the 53rd Annual Meeting of the Association for Computational Linguistics and the 7th International Joint Conference on Natural Language Processing (Volume 1: Lon...
2015
-
[28]
Learning entity and relation embeddings for knowledge graph completion,
Y . Lin, Z. Liu, M. Sun, Y . Liu, and X. Zhu, “Learning entity and relation embeddings for knowledge graph completion,” in Twenty-ninth AAAI conference on artificial intelligence , 2015
2015
-
[29]
Distributed representations of words and phrases and their composi- tionality,
T. Mikolov, I. Sutskever, K. Chen, G. S. Corrado, and J. Dean, “Distributed representations of words and phrases and their composi- tionality,” in Advances in neural information processing systems , 2013, pp. 3111–3119
2013
Reviewed August 14, 2026 · model on record in the stance chip above.
Discussion (0). Continue with ORCID to comment.