REVIEW 3 major objections 5 minor 6 references
IndiaWeatherBench: A Dataset and Benchmark for Data-Driven Regional Weather Forecasting over India
T0 review · 3 major / 5 minor · reviewed 2026-08-05 · deepseek-v4-flash
Pith's one-line read IndiaWeatherBench gives the ML community a standardized 12-km benchmark for forecasting weather over India.
desk verdict A genuinely useful benchmark for regional ML forecasting over India, with an honest but load-bearing limitation: all headline numbers assume perfect boundary/global forcing. read the letter →
The pith
A machine-rendered reading of the paper's core claim, the machinery that carries it, and where it could break.
The reading
What carries the argument
The load-bearing object is the curated IMDAA-derived dataset itself: 43 channels at 0.12° resolution over 6°N–36.72°N, 66.6°E–97.25°E, subsampled to 6-hourly steps from 2000–2019 with fixed splits, shipped in Zarr and HDF5. Around it, the benchmark standardizes the experimental protocol: prediction of state increments, latitude-weighted losses, two boundary conditioning strategies (a 10-pixel ground-truth boundary ring versus bilinearly upsampled 124×124 ERA5), matched model sizes, and four metrics. The combination is what makes results from different architectures and conditioning choices directly comparable.
What would settle it
Run the same baselines with auxiliary inputs taken from a real operational global forecast instead of ground-truth reanalysis; if rankings reorder or Stormer's coarse-conditioning gap disappears, the evaluation protocol does not reflect operational skill.
Extended reading notes
Core claim
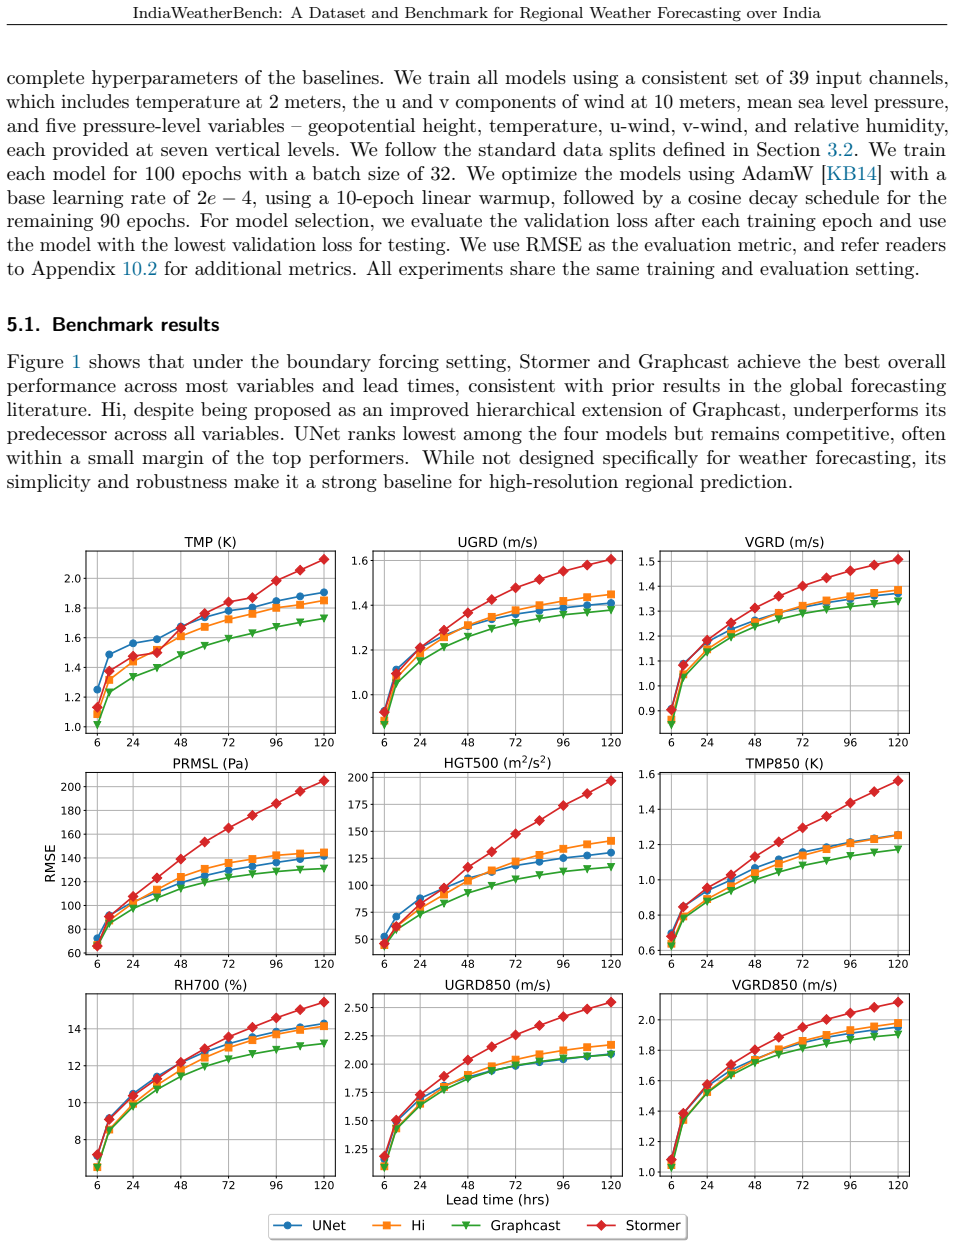
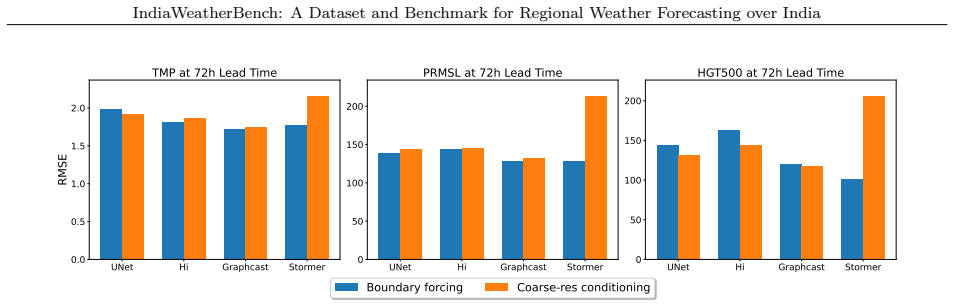
The paper establishes that regional machine-learning weather forecasting over India can be reduced to a standardized, reproducible task: given a 6-hourly history of 39 channels on a 12-km, 256×256 grid over the subcontinent, predict the next state, optionally conditioned on boundary or coarse-global context. Its benchmark results show that with boundary forcing, the transformer Stormer and graph model GraphCast lead across most variables and lead times, while the hierarchical graph model Hi underperforms GraphCast and UNet lags slightly; with coarse ERA5 conditioning, Stormer collapses to the worst model because its patch tokenization mixes incompatible spatial scales. Under a 2019 heatwave
Load-bearing premise
The rankings are computed with perfect auxiliary inputs—true boundary pixels or the true ERA5 global state—so they may not carry over to operational forecasts where those inputs contain real errors.
Editorial extensions
If this is right
- Future regional forecasting papers on India can report numbers on the same splits and metrics, making leaderboard-style comparison possible.
- The strong interaction between architecture and conditioning implies that a model's ranking without specifying boundary strategy is meaningless; future claims should state both.
- Extreme-event scrutiny is built in: the heatwave case shows that aggregate RMSE rankings do not predict which model behaves best under rare extremes.
- The probabilistic baseline gives a concrete starting point for uncertainty-aware regional forecasting; its underdispersion identifies a target for improvement.
- Because the pipeline is modular, the same dataset construction and evaluation code can be transplanted to other regional reanalyses.
Reading between the lines
- If the benchmark is used with real-time operational global forecasts instead of ground-truth ERA5, the reported rankings may shift; the paper does not yet test this, but it is the natural next experiment.
- Stormer's failure under coarse conditioning could be tested directly: separating the upsampled global input into its own token stream or using a larger patch size should either recover its skill or confirm the scale-mixing hypothesis.
- The omission of precipitation metrics means the benchmark may miss the variable most critical to Indian agriculture; adding categorical or threshold-weighted precipitation scores could change which architecture is favored.
- Fine resolution appears to matter: prior India benchmark data exist at about 1°, and models that look weak globally (e.g., UNet) stay competitive here, suggesting regional-scale data may alter architectural preferences.
Editorial analysis
A structured set of objections, weighed in public.
Referee Report
Summary. The paper introduces IndiaWeatherBench, a dataset and benchmark for data-driven regional weather forecasting over India. It curates 20 years (2000-2019) of IMDAA reanalysis at 0.12° (~12 km) resolution over a 256x256 grid, with 43 variables including single-level, pressure-level, and static fields, and provides standardized train/validation/test splits (2000-2017/2018/2019). The benchmark defines a regional forecasting task with two auxiliary-input strategies: boundary forcing (10-pixel true boundary) and coarse-resolution conditioning (ERA5, interpolated). Four architectures (UNet, Stormer, GraphCast, Hi) are trained with deterministic MSE on increments and one UNet diffusion model for probabilistic forecasting; metrics are RMSE, ACC, CRPS, SSR. Results show ranking changes across conditioning strategies (Stormer best under boundary forcing, worst under coarse conditioning) and a heatwave case study. Data, code, and evaluation pipelines are open-sourced.
Significance. If the protocol is accepted, IndiaWeatherBench fills an evident gap by providing a common, high-resolution regional benchmark for India, analogous to WeatherBench. The dataset construction, splits, and metric definitions are careful, and the open release of raw/preprocessed data and model code is a concrete contribution. However, because auxiliary inputs (boundary and coarse-resolution context) are ground-truth in all experiments (Sections 4.1 and 5), the reported numbers quantify performance under perfect external forcing rather than operational forecasting. This limits the benchmark's value as a direct yardstick for real forecasting skill and may bias model rankings; the paper needs to address this gap before the central claim is fully supported. With that addressed, the benchmark would be a valuable resource.
major comments (3)
- [Sections 4.1, 5] The evaluation protocol uses ground-truth S_t throughout autoregressive rollout. Section 4.1 states "we use the ground-truth weather state for S_t during training and evaluation," and Section 5 says boundary values are "extracted from the ground truth" while the coarse input is ERA5. For lead times beyond 6h, this supplies perfect lateral boundary/global forcing at every intermediate valid time, i.e., an oracle not available in operational forecasting. Absolute skill and model rankings in Figs. 1-3 and 4 are therefore conditional on perfect external information; a model that aggressively uses boundary corrections may look strong here yet degrade with realistic boundary errors. This is load-bearing for the "common yardstick" claim. Please add at least one sensitivity analysis with perturbed/persistent/forecast-derived boundary inputs (or a global-model forecast as S_t) to show rankings ar
- [Sections 5 and 9.1] There is an inconsistency in the claimed parameter constraint: Section 5 (Training and evaluation details) says "constrain the total parameter count of each baseline model to lie between 25M and 30M," while Appendix 9.1 says "kept the parameter count of each architecture from 30 to 35 million." Since the paper claims fair comparison across architectures, the actual constraint must be stated unambiguously and verified in the released configurations. Please reconcile and report the actual parameter counts for each model.
- [Section 10.3 and Abstract/Introduction] The paper claims to provide a benchmark with "diverse baselines" across architectures and training objectives, including probabilistic forecasting. However, Section 10.3 states "we only benchmark UNet with boundary forcing for probabilistic forecasting." Thus CRPS/SSR results are available for only one baseline, and no probabilistic comparison across architectures or conditioning strategies is provided. This undercuts the breadth of the benchmark as presented. Please add probabilistic results for at least one additional architecture, or explicitly scope the central claims to deterministic baselines while presenting the probabilistic component as a protocol definition and worked example.
minor comments (5)
- [Section 2] Diffusion-LAM is cited as [OLL23], but that reference is the Hi-LAM paper. The separate citation [Lar+25] appears later; please fix the citation for Diffusion-LAM.
- [Figure 4b] The x-axis is labeled 05-26 to 05-31, while the text says the period is May 25 to June 1. Please align the figure and text.
- [Throughout] The model name is spelled inconsistently as "Graphcast" and "GraphCast"; please standardize.
- [Section 5] Results are based on a single training run per configuration, with no error bars or seed variability. Given that some ranking differences appear small, a comment on this limitation or a multi-seed check for at least the central comparisons would strengthen the conclusions.
- [Section 3.2 / data availability] Data is hosted on Google Drive; consider providing a persistent DOI or an institutional archive to ensure long-term access and reproducibility.
Circularity Check
No significant circularity found; the benchmark is self-contained against external anchors, with the ground-truth auxiliary-input limitation assessed as a validity concern rather than a circular derivation.
full rationale
The paper's central contribution is a curated dataset and benchmark, not a derivation of forecast skill from fitted constants. The forecasting protocol in Section 4.1 uses ground-truth auxiliary inputs (true boundary pixels or true ERA5) during training and evaluation, which is explicitly disclosed and repeated as a limitation in Section 6. This affects whether reported numbers transfer to operational forcing, but it is not circular: the benchmark is defined as conditional forecasting under perfect auxiliary information, and no fitted parameter is subsequently relabeled as a prediction. Models are trained on 2000-2017 and evaluated on 2019 with standard RMSE/ACC/CRPS/SSR metrics, and results are anchored against climatology and persistence in Appendix 10.1. The authors' own prior models (Stormer, ClimateLearn, ChaosBench) appear as baselines or related work, but they are not used to justify the benchmark's validity, no uniqueness theorem is imported, and no ansatz is smuggled in via self-citation. The ground-truth auxiliary input limitation is a substantive operational-validity caveat, but it does not make the benchmark's measurements equivalent to their inputs by construction. Therefore no circular step meets the evidentiary standard required to flag it, and the circularity score is 0.
Assumptions & free parameters
assumptions (4)
- domain assumption IMDAA reanalysis values are treated as ground truth for training and evaluation.
- domain assumption Ground-truth auxiliary inputs at evaluation time are a valid proxy for operational boundary/global forcing.
- domain assumption The selected 39 input channels and 7 pressure levels are sufficient for skillful regional forecasting.
- domain assumption Matching parameter counts between 25-35M ensures architecture comparisons are fair.
Cite this review
Pith. "Pith review of IndiaWeatherBench: A Dataset and Benchmark for Data-Driven Regional Weather Forecasting over India." pith.science (2026). https://pith.science/paper/KJJ4JRKC
@misc{pith2026250900653,
  author       = {Pith},
  title        = {Pith review of: IndiaWeatherBench: A Dataset and Benchmark for Data-Driven Regional Weather Forecasting over India},
  year         = {2026},
  howpublished = {\url{https://pith.science/paper/KJJ4JRKC}},
  note         = {Machine review of arXiv:2509.00653}
}
read the original abstract
Regional weather forecasting is a critical problem for localized climate adaptation, disaster mitigation, and sustainable development. While machine learning has shown impressive progress in global weather forecasting, regional forecasting remains comparatively underexplored. Existing efforts often use different datasets and experimental setups, limiting fair comparison and reproducibility. We introduce IndiaWeatherBench, a comprehensive benchmark for data-driven regional weather forecasting focused on the Indian subcontinent. IndiaWeatherBench provides a curated dataset built from high-resolution regional reanalysis products, along with a suite of deterministic and probabilistic metrics to facilitate consistent training and evaluation. To establish strong baselines, we implement and evaluate a range of models across diverse architectures, including UNets, Transformers, and Graph-based networks, as well as different boundary conditioning strategies and training objectives. While focused on India, IndiaWeatherBench is easily extensible to other geographic regions. We open-source all raw and preprocessed datasets, model implementations, and evaluation pipelines to promote accessibility and future development. We hope IndiaWeatherBench will serve as a foundation for advancing regional weather forecasting research. Code is available at https://github.com/tung-nd/IndiaWeatherBench.
Figures

Figures from the paper (7 more)


Reference graph
Works this paper leans on
-
[2]
Met- mamba: Regional weather forecasting with spatial-temporal mamba model
arXiv: 2312.15796 [cs.LG]. [Qin+24] Haoyu Qin, Yungang Chen, Qianchuan Jiang, Pengchao Sun, Xiancai Ye, and Chao Lin. “Met- mamba: Regional weather forecasting with spatial-temporal mamba model.” In:arXiv preprint arXiv:2408.06400 (2024). [Ras+20] Stephan Rasp, Peter D Dueben, Sebastian Scher, Jonathan A Weyn, Soukayna Mouatadid, and Nils Thuerey. “Weathe...
arXiv 2024
-
[7]
IMDAA is available under the CC BY-NC-SA 4.0 license (https: //rds.ncmrwf.gov.in/privacy)
Licenses and Terms of Use We developed IndiaWeatherBench using the data from IMDAA, which belongs to the NCMRWF, Ministry of Earth Science, Government of India. IMDAA is available under the CC BY-NC-SA 4.0 license (https: //rds.ncmrwf.gov.in/privacy)
-
[8]
Broader impacts IndiaWeatherBench aims to advance the scientific and practical capabilities of regional weather forecasting, with a specific focus on high-impact and climate-sensitive regions such as India. Accurate regional forecasts are crucial for agriculture, disaster preparedness, water resource management, and public health, especially in countries ...
-
[9]
Benchmark details 9.1. Baseline architecture details For reproducibility and fair comparisons across architectures, we kept the parameter count of each architecture from 30 to 35 million. Table 2, 3, 4, 5 show the exact hyperparameters we used for each architecture. Table 2: Default hyperparameters of UNet Hyperparameter Meaning Value Hidden channels Base...
-
[10]
Additional results 10.1. Main results with climatology and persistence We compare the deep learning methods with climatology and persistence, two simple baselines commonly used in weather forecasting, to better evaluate their forecast skills. We calculate climatology by taking the mean value of each time across the training set and predicting that to be t...
work page 2017
-
[2024]
AROME- MetCoOp: A Nordic convective-scale operational weather prediction model
arXiv: 2109.10399 [physics.ao-ph]. [Mül+17] Malte Müller, Mariken Homleid, Karl-Ivar Ivarsson, Morten AØ Køltzow, Magnus Lindskog, Knut Helge Midtbø, Ulf Andrae, Trygve Aspelien, Lars Berggren, Dag Bjørge, et al. “AROME- MetCoOp: A Nordic convective-scale operational weather prediction model.” In:Weather and Forecasting32.2 (2017), pp. 609–627. [Nag+21] T...
arXiv 2017
Reviewed August 5, 2026 · model on record in the stance chip above.
Discussion (0). Continue with ORCID to comment.