REVIEW 4 major objections 6 minor 5 references
When Your Friends Become Sellers: An Empirical Study of Social Commerce Site Beidian
T0 review · 4 major / 6 minor · reviewed 2026-08-14 · deepseek-v4-flash
Pith's one-line read A full-scale measurement of the WeChat-based commerce platform Beidian shows that strong-tie social commerce creates a decentralized network, invitation cascades far deeper and larger than previously observed, and conversion rates well…
desk verdict Valuable first measurement of a strong-tie social commerce platform, but the headline comparative claims rest on unmatched baselines and need a matched re-analysis. read the letter →
The pith
A machine-rendered reading of the paper's core claim, the machinery that carries it, and where it could break.
The reading
What carries the argument
The argument is carried by three constructed objects. The first is the invitation cascade tree, whose nodes are users and whose edges are inviter-invitee relationships; it makes growth visible as depth, size, and structural virality measured by the Wiener index. The second is the purchase graph, in which seller-buyer edges define 'communities' whose internal similarity in city, province, and economic status is compared against randomly paired communities. The third is conversion rate, defined as the share of product-link visits that end in purchase, tracked at site, seller, buyer, and item level. Together these objects connect the platform's growth and transaction outcomes back to the presence of real-life strong ties.
What would settle it
Recompute the cascade statistics on Beidian's invitation tree using the exact definitions of the cited studies: if the fraction of users at depth 5 or beyond falls clearly below the reported 71.0% once the same root, pruning, and tree-construction rules are applied, the 'much deeper and larger' claim fails; the paper does not supply that cross-check.
Extended reading notes
Core claim
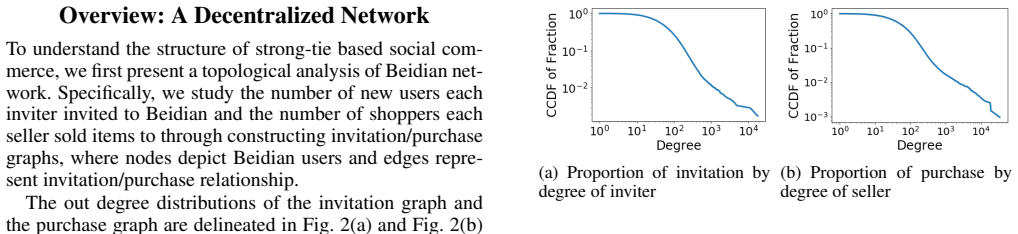
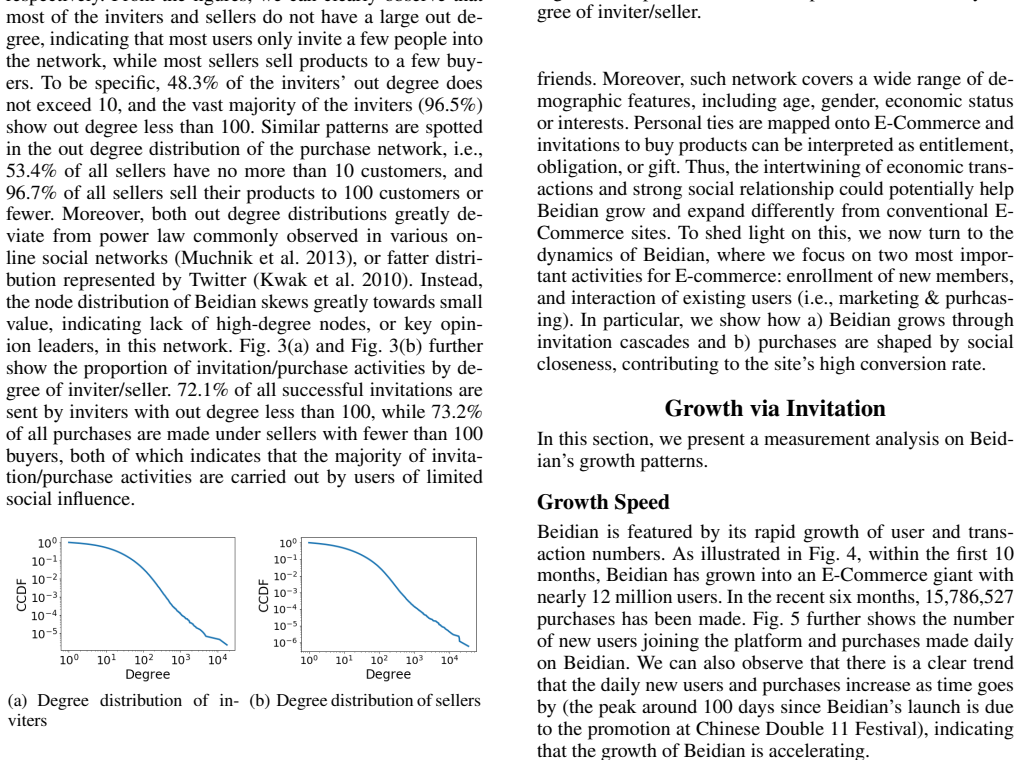
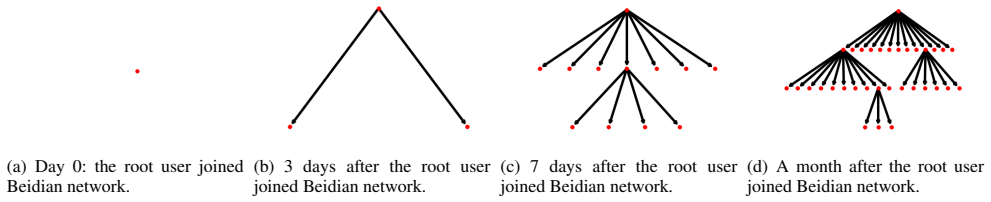
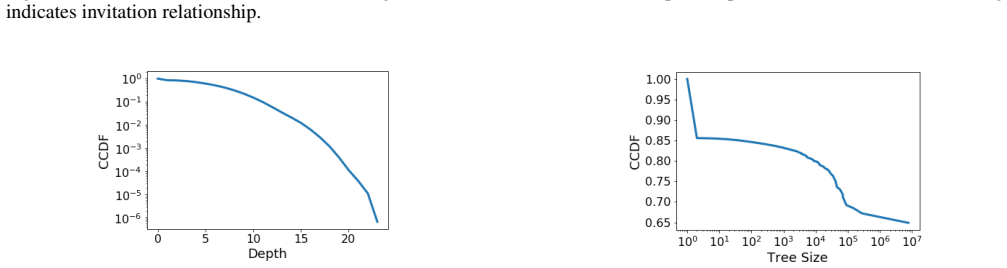
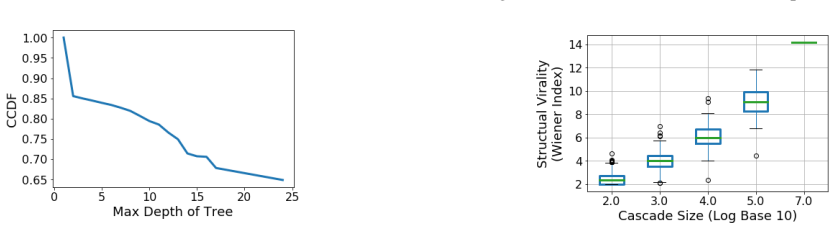
On Beidian's own terms, the paper's discovery is that the platform's network is decentralized, its growth is cascade-driven, and its purchasing is loyalty- and proximity-driven. Invitation out-degrees are small: 48.3% of inviters invite ten or fewer users, 96.5% invite fewer than 100, and the degree distribution deviates from the power-law shape seen in many online social networks, so there are no 'super nodes' or key opinion leaders. Growth arrived through invitation cascades that are unusually deep and large: 71.0% of users sit at adoption depth 5 or beyond, 22.6% beyond depth 10, cascades reach depth 24, and 64.9% of users belong to one cascade tree of more than 7.5 million members, whereas cited prior studies report fewer than 30% of invitations reaching depth 5. On the transaction side, Beidian's overall conversion rate is 7.33% against a traditional-e-commerce baseline below 5%, 92.4% of buyers purchase from a single seller, 89.7% of buyers return to the same seller for repeat purchases, and community-level conversion rates rise with geographic and economic proximity between buyers and sellers.
Load-bearing premise
The headline contrasts rely on Beidian's cascade depth, size, and Wiener index being computed under the same tree definitions and baseline conventions as the cited LinkedIn and Twitter studies; if the definitions differ, the conclusion that Beidian's cascades are much deeper and larger than all known networks loses its support.
Editorial extensions
If this is right
- Strong-tie platforms can reach tens of millions of users without any celebrity or brand anchors: invitation-only recruitment through existing WeChat connections is sufficient, so growth models should not assume key opinion leaders are necessary.
- Any model of cascade dynamics calibrated on Twitter or LinkedIn will under-predict Beidian-style growth; the 'point to group' sharing pattern plus financial rewards for invitation needs its own parameterization.
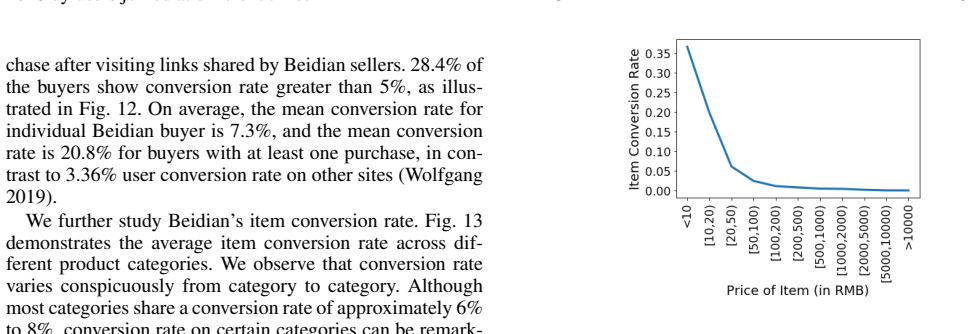
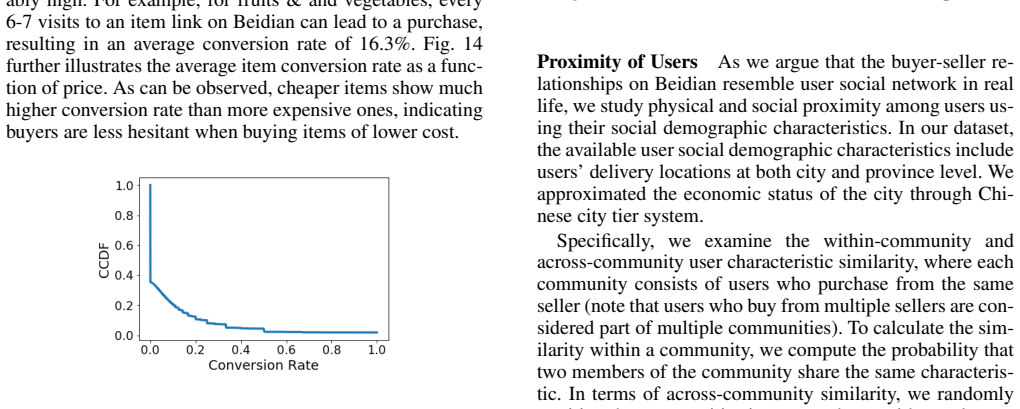
- The e-commerce conversion baseline should be reconsidered in intimate settings: site-level 7.33%, 35.3% of visiting buyers purchasing at least once, and category rates as high as 16.3% for fruits and vegetables all exceed the classic 5% benchmark.
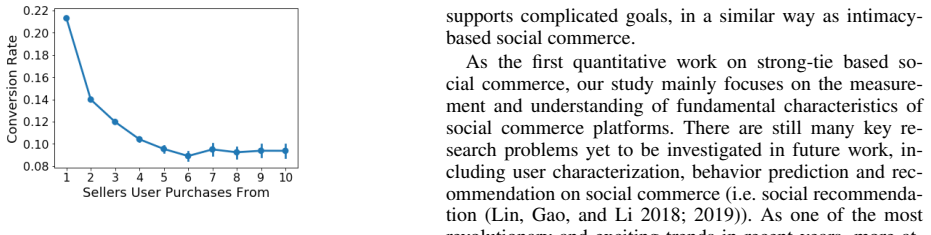
- Buyer loyalty is a structural feature, not a marketing accident: 92.4% of buyers use one seller and 89.7% make repeat purchases, so relationship-based repurchase can dominate price- or reputation-based choice.
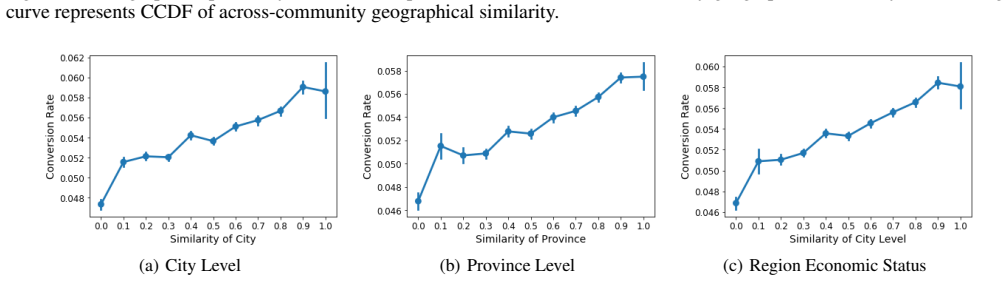
- Within-community proximity is a measurable predictor of conversion, meaning a seller community's homogeneity in location and economic status can serve as a practical signal for which products will sell.
Reading between the lines
- The paper's proximity-conversion correlation suggests a design extension it does not test: a recommendation system for strong-tie commerce might rank product shares by similarity between a seller's community and the product's typical buyers, rather than by item-to-item similarity alone.
- The observed decay in invitation success, from 7.36 successful invitations for May 2018 joiners to 0.78 for August 2017 joiners, points to an individual saturation effect consistent with a finite close-tie circle; modeling that capacity explicitly could predict when a strong-tie platform's organic growth levels off.
- Whether these patterns are generic to strong-tie commerce or specific to Beidian's commission-and-invitation design is left open; a replication on another platform, such as a group-buying site, would settle whether the depth, decentralization, and loyalty findings transfer.
Signed reviews
Editorial analysis
A structured set of objections, weighed in public.
Referee Report
Summary. The paper presents a measurement study of Beidian, a WeChat-based social commerce platform, using invitation records for 11.8 million users and purchase/behavior logs for 2.96 million buyers. It reports three sets of findings: (1) the invitation and purchase graphs are decentralized, with most users having small out-degrees and few key opinion leaders; (2) Beidian grows through invitation cascades that are deeper and larger than cascades in prior networks, with 71.0% of users at depth greater than or equal to 5 and 64.9% in a single tree with more than 7.5 million members; and (3) conversion rates are high (7.33% site-level) and positively associated with geographic and social proximity and buyer loyalty. The paper concludes that strong-tie social commerce deviates significantly from known social networks and e-commerce in structure, dynamics, and behavior.
Significance. The dataset is unusually large and complete for a social commerce platform, and the descriptive statistics (degree distributions, growth curves, repeat-purchase rates) provide a valuable first quantitative baseline for strong-tie social commerce. The paper does not fit any predictive models, so the descriptive claims are not subject to overfitting concerns, and the specific quantitative figures (e.g., 71.0%, 64.9%, 7.33%) are concrete enough to be checked against other platforms. However, the headline contributions are comparative, and those comparisons currently rest on unmatched definitions and missing statistical tests. The descriptive baseline is solid, but the stronger 'deviation from all known networks' claims require a matched re-analysis before they can be taken as established.
major comments (4)
- [Growth via Invitation (Invitation Cascade)] The comparison between Beidian's invitation cascades and those of Anderson et al. (2015), Goel et al. (2015), and Leskovec et al. (2007) is not defined on the same measurement object. Beidian's 'invitation cascade' is the cumulative referral forest from platform launch to June 4, 2018, rooted at seed users; under this construction, the 71.0% of users at depth greater than or equal to 5 and the 64.9% of users in a single tree of more than 7.5 million members are properties of the entire growing forest, not of a time-bounded diffusion cascade. The paper does not report how the cited studies define cascades, what observation windows they use, or whether they also analyze cumulative forests. Please provide a table comparing cascade definitions and re-analyze the baselines under the same definition, or at minimum restate the claim as 'the largest connected component of the referral forest is deep and large' rather than as a deviation from all prior cascade studies.
- [Economic Transactions over Strong Tie (High Conversion Rate)] The conversion-rate benchmark is not apples-to-apples. Beidian's 7.33% rate is the fraction of clicks on WeChat-shared product links that result in purchases, while the cited benchmarks (Moe and Fader 2004; Wolfgang 2019) are for all site visits, including non-social traffic. The two denominators cannot be compared without adjusting for traffic source because users who click a friend's shared link are already a warm, self-selected population. Please compute a conversion rate for all sessions or visits to Beidian, or explicitly limit the claim to social-referral traffic and acknowledge the selection bias. In addition, the 20.8% mean for buyers with at least one purchase is a conditional estimand and should not be presented in the same comparison as the 3.36% benchmark.
- [Economic Transactions over Strong Tie (Conversion Rate vs. Proximity)] The observed positive relationship between within-community geographic and social similarity and conversion rate may be driven by community size: smaller communities are mechanically more likely to show high similarity, and community size is likely correlated with conversion rate for reasons unrelated to proximity (e.g., number of products, seller activity). The paper does not report regressions that control for community size, item category, or price. To support the claim that proximity contributes to the high conversion rate, please provide size-stratified analyses or a multivariate model with confidence intervals.
- [Overview: A Decentralized Network] The statement that the out-degree distributions 'greatly deviate from power law' is not backed by any statistical test. The paper shows heavy-tailed empirical distributions but does not fit a power-law model, perform goodness-of-fit tests, or compare alternative distributions. Without such tests, the claim of deviation is only visual. Please add quantitative distributional analysis (e.g., power-law fitting with bootstrapped p-values) and report the fitted parameters if a power-law is plausible.
minor comments (6)
- [Overview: A Decentralized Network (Fig. 6 caption and text)] The sentence 'we selected a root user with relatively small out degrees and shallow depths' should state the selection criterion so that the reader can judge whether the example is representative.
- [Economic Transactions over Strong Tie (User Proximity)] The random-partition method for computing across-community similarity is ambiguous; please specify how many random partitions were used and whether the reported probability is an average over repeated partitions with error bars.
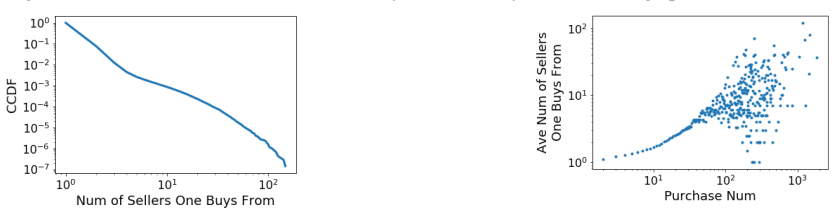
- [Economic Transactions over Strong Tie (Loyalty)] When reporting that '78.2% buyers choose to buy from one seller,' the paper should state in the same sentence that this is computed only among the 23.09% of buyers who visited links from at least two sellers; the current phrasing appears in a separate sentence and is easy to misread as a population-level figure.
- [Growth via Invitation (Invitation Temporal Patterns)] The comparison of 7.36 vs. 0.78 average successful invitations between new and old users is reported without standard errors or significance tests; please add them or describe the variability across users.
- [References] The reference 'Wolfgang 2019' has a malformed URL ('http://https://...'), and the text uses both 'Flicker' and 'Flickr' for the same site; please correct these inconsistencies.
- [Growth via Invitation (Cascade Structural Patterns)] The sentence 'In comparison, in prior studies, fewer than 30% of the invitations can reach depth 5' cites no specific source or metric; please provide a concrete reference and the exact measure being compared.
Circularity Check
No significant circularity: descriptive measurement study with no fitted parameters or self-citation-dependent claims.
full rationale
This paper is a descriptive measurement study of the Beidian platform. It fits no parameters and makes no predictive claims; the headline findings (decentralized degree distributions, deep invitation cascades, high conversion rate) are computed directly from invitation and purchase records. The comparative claims against prior networks rest on baseline-definition choices, such as using the cumulative invitation forest for Beidian versus previously published cascade definitions, and using WeChat-link clicks as the conversion denominator versus site-visit benchmarks in prior work. Those are validity and comparability concerns, not circularity: the Beidian quantities are not derived from the cited baselines, and the cited baselines are not derived from Beidian. The self-citations (e.g., Zeng et al. 2019; Lin et al. 2018; 2019) appear in related-work and future-work contexts and are not load-bearing for the central measurements. No equation defines its output in terms of its input, and no fitted value is relabeled as a prediction. Therefore the circularity score is 0.
Assumptions & free parameters
assumptions (3)
- domain assumption The Beidian dataset is complete and accurately records invitations and purchases.
- domain assumption Metrics are comparable across studies.
- domain assumption The Chinese city tier system approximates economic status.
Cite this review
Pith. "Pith review of When Your Friends Become Sellers: An Empirical Study of Social Commerce Site Beidian." pith.science (2026). https://pith.science/paper/KRKWUMOL
@misc{pith2026190805409,
  author       = {Pith},
  title        = {Pith review of: When Your Friends Become Sellers: An Empirical Study of Social Commerce Site Beidian},
  year         = {2026},
  howpublished = {\url{https://pith.science/paper/KRKWUMOL}},
  note         = {Machine review of arXiv:1908.05409}
}
read the original abstract
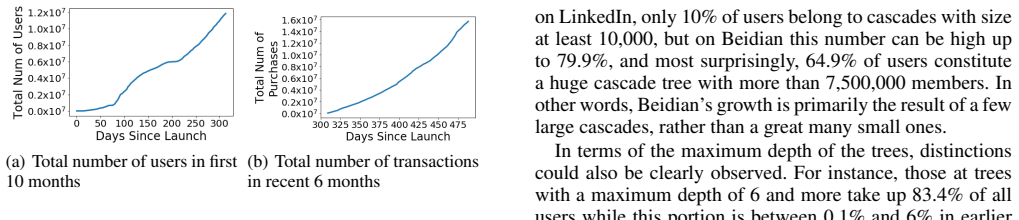
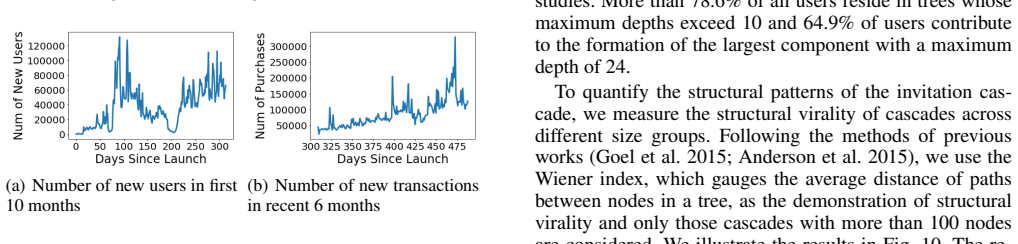
Past few years have witnessed the emergence and phenomenal success of strong-tie based social commerce. Embedded in social networking sites, these E-Commerce platforms transform ordinary people into sellers, where they advertise and sell products to their friends and family in online social networks. These sites can acquire millions of users within a short time, and are growing fast at an accelerated rate. However, little is known about how these social commerce develop as a blend of social relationship and economic transactions. In this paper we present the first measurement study on the full-scale data of Beidian, one of the fastest growing social commerce sites in China, which involves 11.8 million users. We first analyzed the topological structure of the Beidian platform and highlighted its decentralized nature. We then studied the site's rapid growth and its growth mechanism via invitation cascade. Finally, we investigated purchasing behavior on Beidian, where we focused on user proximity and loyalty, which contributes to the site's high conversion rate. As the consequences of interactions between strong ties and economic logics, emerging social commerce demonstrates significant property deviations from all known social networks and E-Commerce in terms of network structure, dynamics and user behavior. To the best of our knowledge, this work is the first quantitative study on the network characteristics and dynamics of emerging social commerce platforms.
Figures

Figures from the paper (12 more)


Reference graph
Works this paper leans on
-
[540]
ACM. Lu, B.; Fan, W.; and Zhou, M. 2016. Social presence, trust, and social commerce purchase intention: An empirical re- search. Computers in Human Behavior 56:225–237. Matsuo, Y ., and Yamamoto, H. 2007. Diffusion of recom- mendation through a trust network. In ICWSM. McCormick, K. 2016. Celebrity endorsements: Influence of a product-endorser match on mi...
work page 2016
-
[600]
AcM. Leskovec, J.; Adamic, L. A.; and Huberman, B. A. 2007. The dynamics of viral marketing. ACM Transactions on the Web (TWEB) 1(1):5. Leskovec, J., and Horvitz, E. 2008. Planetary-scale views on a large instant-messaging network. In Proceedings of the 17th international conference on World Wide Web, 915–924. ACM. Leskovec, J.; McGlohon, M.; Faloutsos, C...
work page 2007
- [1997]
-
[2009]
European Journal of Operational Research 195(2):442– 448
A game theory approach in seller–buyer supply chain. European Journal of Operational Research 195(2):442– 448. Geertz, C. 1978. The bazaar economy: Information and search in peasant marketing. The American Economic Re- view 68(2):28–32. Goel, S.; Anderson, A.; Hofman, J.; and Watts, D. J. 2015. The structural virality of online diffusion. Management Sci- ...
work page 1978
-
[2019]
http://https://www.wolfgangdigital. com/kpi-2019/. Yadav, M. S.; De Valck, K.; Hennig-Thurau, T.; Hoffman, D. L.; and Spann, M. 2013. Social commerce: a contin- gency framework for assessing marketing potential. Journal of interactive marketing 27(4):311–323. Ye, M.; Sandholm, T.; Wang, C.; Aperjis, C.; and Huberman, B. A. 2012. Collective attention and t...
work page 2019
Reviewed August 14, 2026 · model on record in the stance chip above.
Discussion (0). Continue with ORCID to comment.