Accounting for AI Inference in Corporate GHG Inventories: A Four-Tier Methodology for Scope 3 Category 1 Reporting
Pith reviewed 2026-06-27 11:55 UTC · model grok-4.3
The pith
A four-tier framework lets companies report AI inference emissions in Scope 3 Category 1 by matching method precision to the usage data they hold.
A machine-rendered reading of the paper's core claim, the machinery that carries it, and where it could break.
Core claim
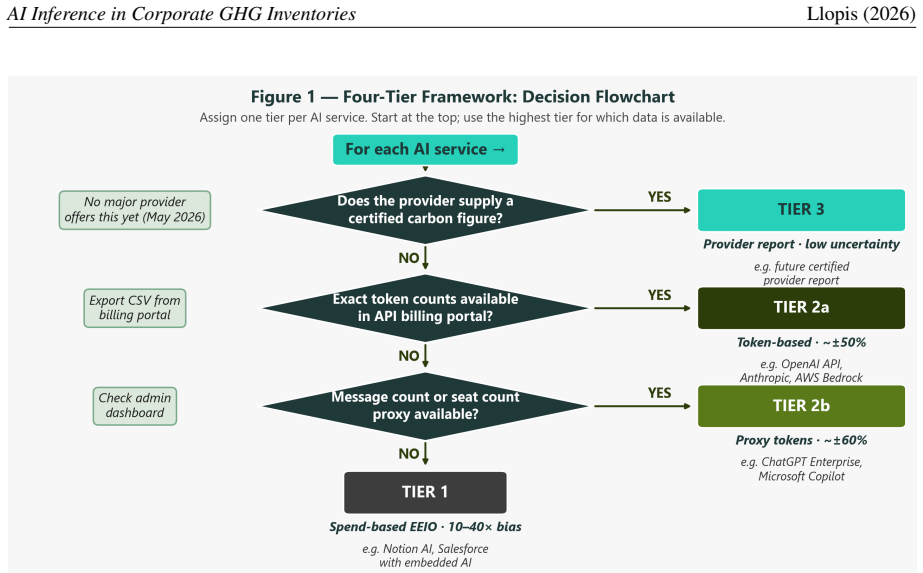
We propose a four-tier framework that matches estimation precision to the data organisations can realistically obtain, progressing from direct token-based physical estimation using GPU energy benchmarks and regional grid carbon intensities down to a spend-based EEIO fallback for services where no usage data exists. Applied to a 200-person European firm, the framework yields a total below 1 tCO2e, illustrating that the compliance challenge is methodological rather than magnitude-driven. We further document a water-carbon trade-off that current ESG tools do not surface.
What carries the argument
The four-tier estimation framework that scales from token-based physical calculations using GPU benchmarks and grid intensities to spend-based EEIO fallbacks.
If this is right
- AI inference can be included in Scope 3 Category 1 inventories without omitting the category or applying sector-wide overestimates.
- Firms that hold token or usage data obtain estimates far lower than those produced by generic economic input-output factors.
- Data-centre location decisions must weigh both carbon intensity and water use, since hydro-heavy grids can increase water footprints.
- The overall contribution of AI services to corporate totals remains small once appropriate methods replace broad proxies.
Where Pith is reading between the lines
- Companies may begin logging token volumes or API calls to move their estimates into higher-precision tiers.
- The tiered structure could be adapted to other digital services whose emissions currently rely on the same broad economic factors.
- Regulators writing future disclosure rules might treat tiered physical-to-economic methods as an acceptable standard for AI-related Scope 3 items.
Load-bearing premise
Peer-reviewed GPU energy benchmarks and published grid carbon intensities give accurate values for real-world AI inference workloads across services and regions.
What would settle it
Direct meter readings of energy draw for a commercial AI inference endpoint that fall outside the range reported by the GPU energy benchmarks would show the physical tier is not representative.
Figures
read the original abstract
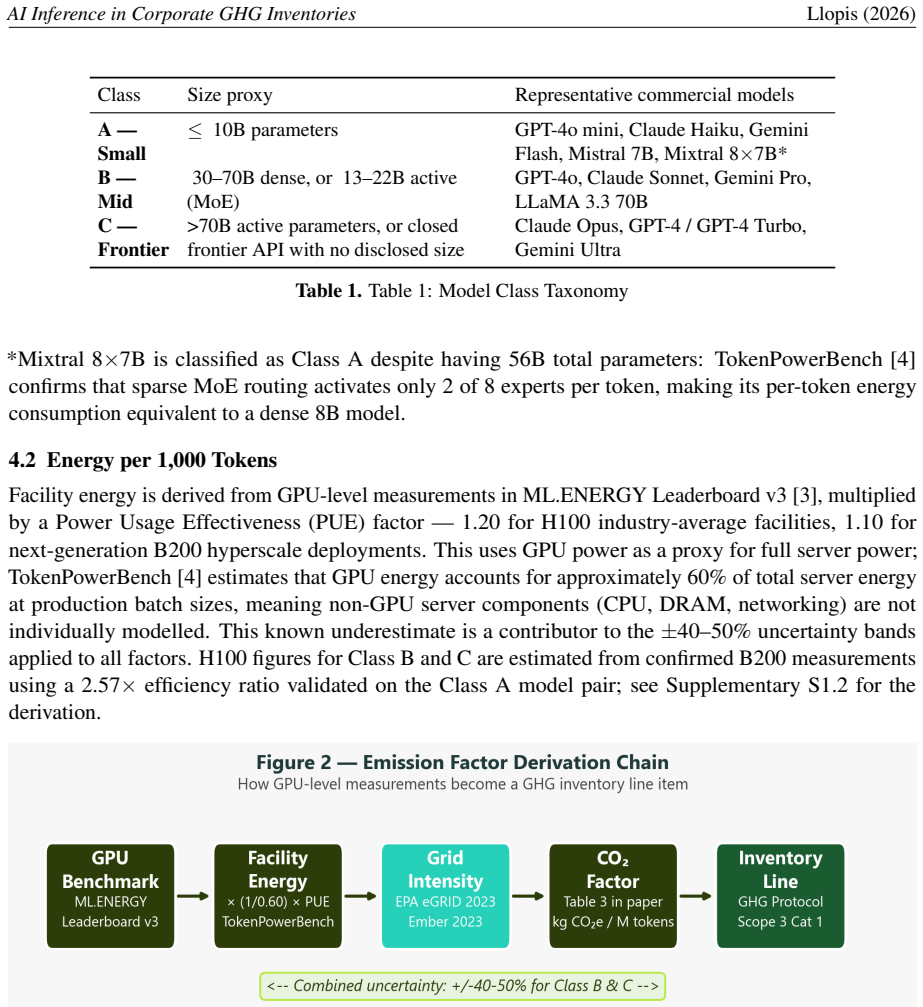
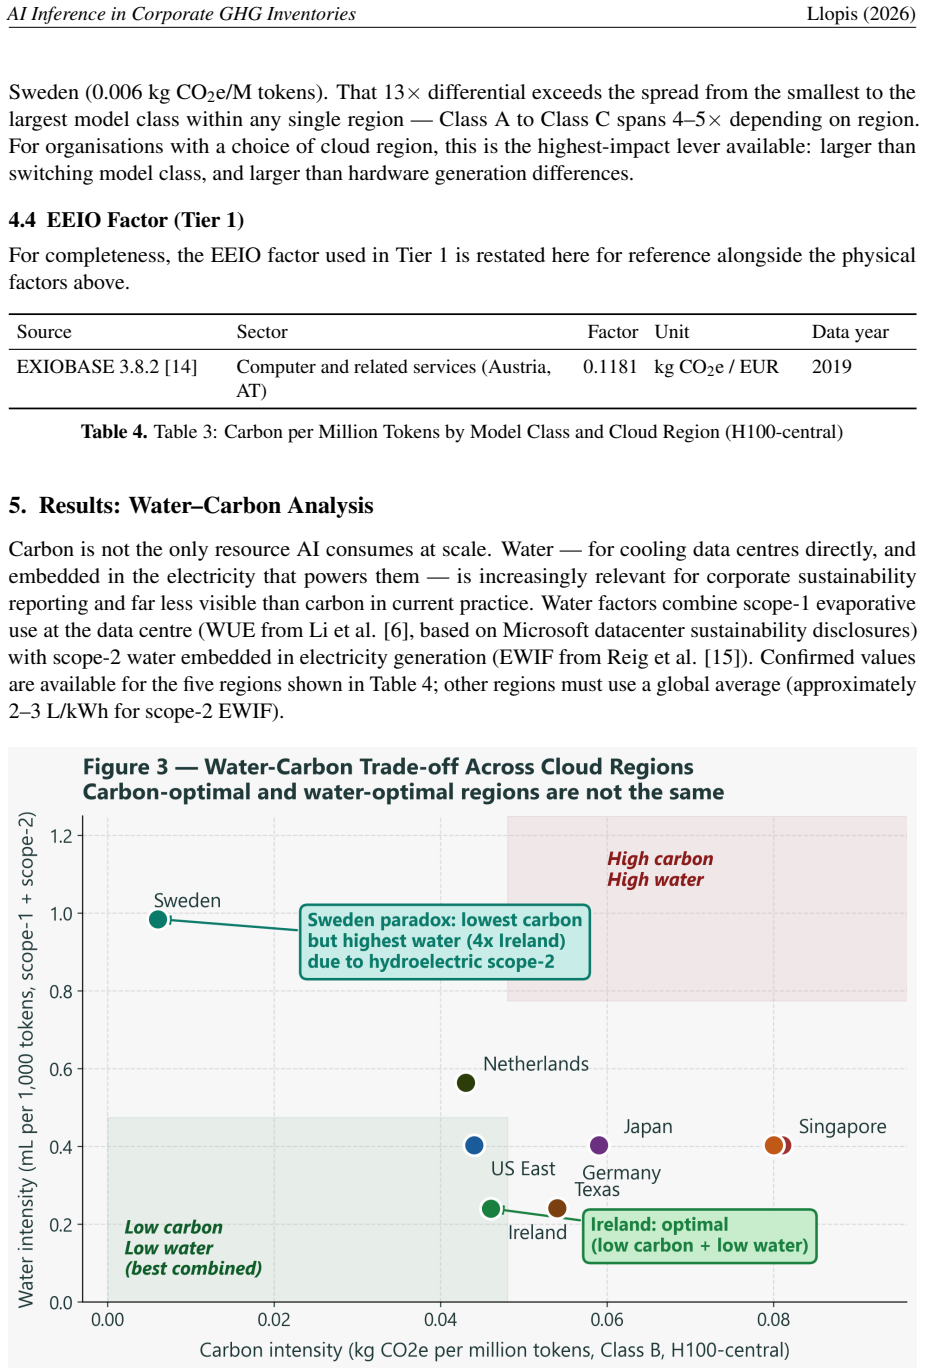
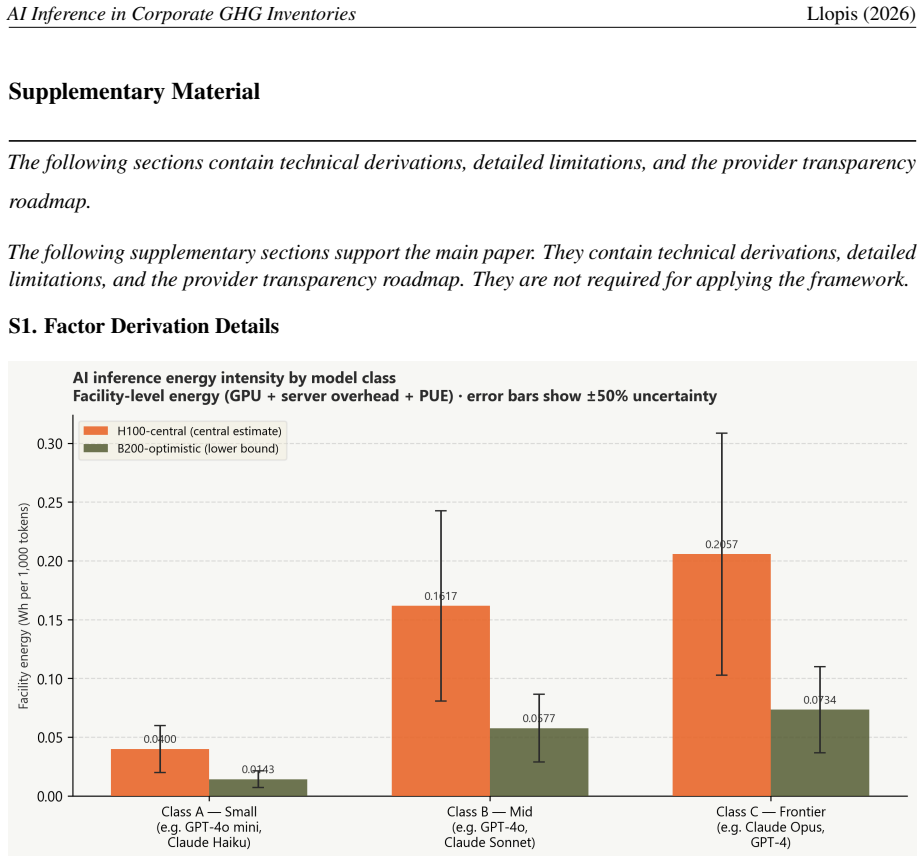
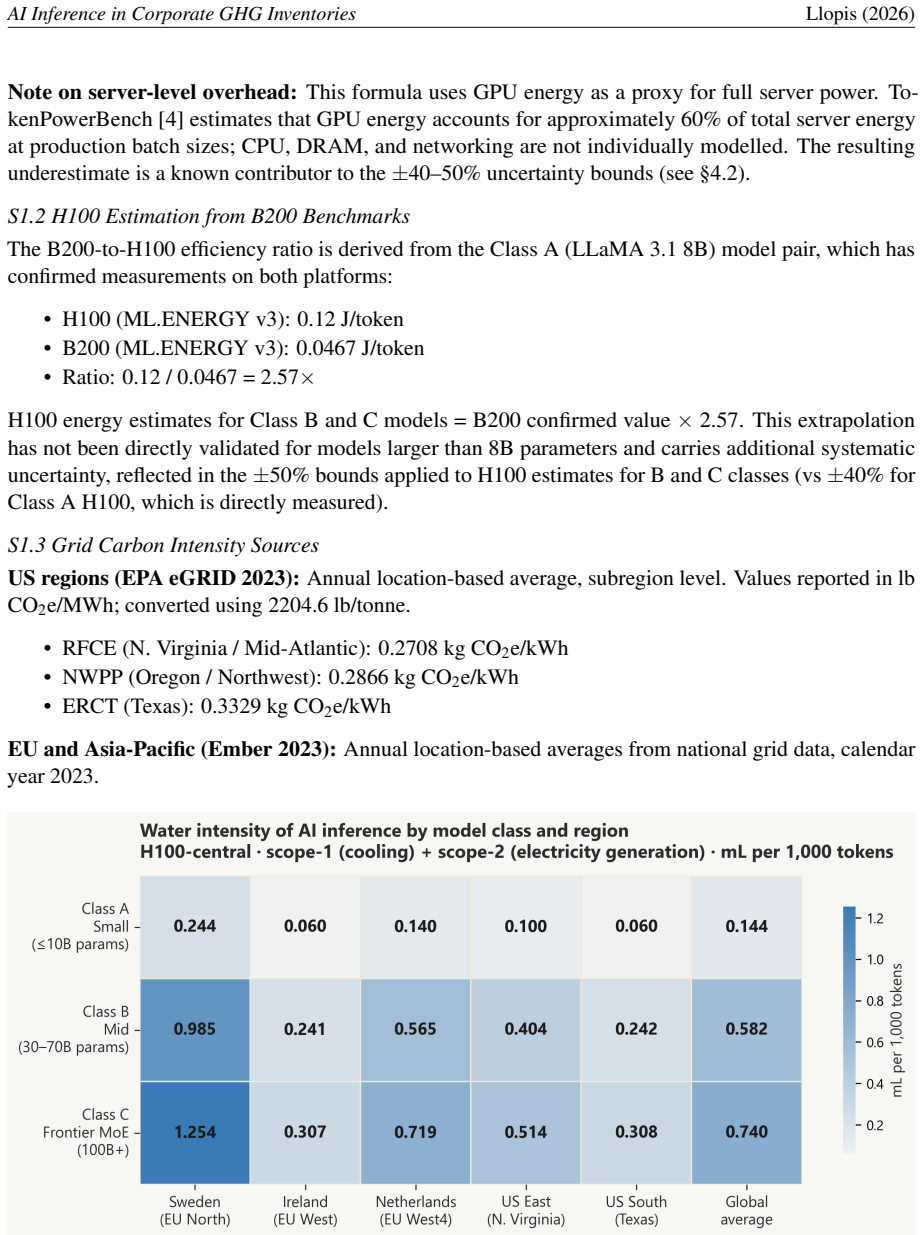
AI inference services -- API subscriptions, enterprise chat tools, and SaaS products with embedded AI features -- fall unambiguously within Scope 3 Category 1 under the Corporate Sustainability Reporting Directive (CSRD), which requires disclosure for fiscal years starting January 2024. Yet no standardised methodology exists for including them in corporate GHG inventories. Current practice either omits the category entirely or applies a generic economic input-output (EEIO) factor calibrated to the ICT sector as a whole, overestimating AI inference emissions by 10-40x relative to physically derived alternatives. We propose a four-tier framework that matches estimation precision to the data organisations can realistically obtain, progressing from direct token-based physical estimation -- using GPU energy benchmarks and regional grid carbon intensities -- down to a spend-based EEIO fallback for services where no usage data exists. Emission factors are derived from peer-reviewed GPU energy benchmarks (ML.ENERGY Leaderboard v3), confirmed grid carbon intensities (EPA eGRID 2023; Ember 2023), and published water use effectiveness data (Li et al., 2025). Applied to a 200-person European firm, the framework yields a total below 1 tCO2e, illustrating that the compliance challenge is methodological rather than magnitude-driven. We further document a water-carbon trade-off that current ESG tools do not surface: Sweden's hydro-dominated grid delivers the lowest carbon intensity in our dataset but the highest water footprint, with direct implications for data centre location strategy.
Editorial analysis
A structured set of objections, weighed in public.
Referee Report
Summary. The manuscript proposes a four-tier methodology for reporting greenhouse gas emissions from AI inference services (API subscriptions, enterprise chat tools, SaaS with embedded AI) under Scope 3 Category 1, as required by the Corporate Sustainability Reporting Directive. Tiers progress from direct token-based physical estimation (using GPU energy benchmarks and regional grid carbon intensities) to a spend-based EEIO fallback. The authors claim generic EEIO methods overestimate emissions by 10-40x and apply the framework to a 200-person European firm to obtain a total below 1 tCO2e. They also document a water-carbon trade-off in grid choices using water use effectiveness data.
Significance. If the framework and case study hold, the work provides a practical, data-matched approach to a timely compliance gap in corporate ESG reporting for AI services. It demonstrates that properly estimated emissions can be small, reframing the issue as methodological. Reliance on peer-reviewed public benchmarks (ML.ENERGY Leaderboard v3) and grid data (EPA eGRID 2023, Ember 2023) supports reproducibility. The water footprint discussion adds a dimension often missing from carbon-only tools and has implications for data center strategy.
major comments (2)
- [§4 (Case Study)] §4 (Case Study): The central claim that the framework yields a total below 1 tCO2e (and that the compliance challenge is methodological rather than magnitude-driven) rests on ML.ENERGY Leaderboard v3 benchmarks and EPA eGRID 2023/Ember 2023 intensities accurately representing the firm's actual AI services, including model sizes, hardware utilization, batching, and provider data-center locations. The manuscript provides no validation, sensitivity analysis, or comparison to provider-reported values, which directly affects the <1 tCO2e result and the 10-40x overestimation comparison.
- [Methodology (four-tier description)] Methodology (four-tier description): The 10-40x overestimation range is asserted relative to generic EEIO factors calibrated to the ICT sector, but the manuscript does not detail the exact EEIO factor applied to the case-study services or provide a side-by-side physical vs. EEIO calculation for the same services, leaving the quantitative claim difficult to verify independently.
minor comments (2)
- Ensure the full reference list includes complete citations for all sources mentioned in the abstract (e.g., Li et al., 2025) with consistent formatting and DOIs where available.
- Figure or table presenting the case-study breakdown (if present) should explicitly list which services fell into which tier and the token or spend volumes used.
Simulated Author's Rebuttal
We thank the referee for their constructive feedback on our manuscript. We address each major comment below and indicate where revisions will be made to strengthen the work.
read point-by-point responses
-
Referee: [§4 (Case Study)] The central claim that the framework yields a total below 1 tCO2e (and that the compliance challenge is methodological rather than magnitude-driven) rests on ML.ENERGY Leaderboard v3 benchmarks and EPA eGRID 2023/Ember 2023 intensities accurately representing the firm's actual AI services, including model sizes, hardware utilization, batching, and provider data-center locations. The manuscript provides no validation, sensitivity analysis, or comparison to provider-reported values, which directly affects the <1 tCO2e result and the 10-40x overestimation comparison.
Authors: The case study applies the framework to estimated usage for a representative 200-person European firm using the best publicly available benchmarks and grid data; it is illustrative rather than based on proprietary firm-specific telemetry. We agree a sensitivity analysis on parameters such as utilization and model size would improve the presentation and will add this in revision. Direct validation against provider-reported values is not feasible without access to confidential data, which is a limitation of any methodology relying on open benchmarks, but the sources remain reproducible and peer-reviewed. revision: partial
-
Referee: [Methodology (four-tier description)] The 10-40x overestimation range is asserted relative to generic EEIO factors calibrated to the ICT sector, but the manuscript does not detail the exact EEIO factor applied to the case-study services or provide a side-by-side physical vs. EEIO calculation for the same services, leaving the quantitative claim difficult to verify independently.
Authors: The 10-40x range reflects literature comparisons between AI-specific physical factors (from ML.ENERGY benchmarks) and generic ICT-sector EEIO factors. For the case study we prioritized physical tiers. We will revise to include an explicit side-by-side table for the case-study services, stating the precise EEIO factor (source and value) and the resulting emissions under a pure spend-based approach. revision: yes
Circularity Check
No significant circularity; derivation relies on external benchmarks.
full rationale
The paper's four-tier framework derives emission estimates by applying independent external inputs—ML.ENERGY Leaderboard v3 GPU benchmarks, EPA eGRID 2023 and Ember 2023 grid intensities, and Li et al. 2025 water data—to usage data or spend-based fallbacks. The <1 tCO2e case-study result for the 200-person firm is produced by direct substitution of these public sources into the tiered methodology, with no parameter fitting to the paper's own outputs, no self-definitional equations, and no load-bearing self-citations. The derivation chain remains self-contained against verifiable external data and does not reduce to any of the enumerated circular patterns.
Axiom & Free-Parameter Ledger
axioms (2)
- domain assumption AI inference services fall unambiguously within Scope 3 Category 1 under CSRD
- domain assumption GPU energy benchmarks and regional grid intensities accurately represent inference workloads
Reference graph
Works this paper leans on
-
[1]
IEA, Paris, April 2025.https://www.iea.org/reports/ energy-and-ai
International Energy Agency.Energy and AI. IEA, Paris, April 2025.https://www.iea.org/reports/ energy-and-ai
2025
-
[2]
Official Journal of the European 12 AI Inference in Corporate GHG InventoriesLlopis (2026) Union, 2022
European Commission.Corporate Sustainability Reporting Directive (CSRD), Directive 2022/2464/EU, andEuropean Sustainability Reporting Standard E1 (Climate Change). Official Journal of the European 12 AI Inference in Corporate GHG InventoriesLlopis (2026) Union, 2022
2022
-
[3]
University of Michigan, May 2026.https://ml.energy/leaderboard
ML.ENERGY Leaderboard.ML.ENERGY Leaderboard v3: GPU-level inference energy benchmarks. University of Michigan, May 2026.https://ml.energy/leaderboard
2026
-
[4]
Niu, C., et al.TokenPowerBench: A Benchmark for Measuring Per-Token Energy Consumption of Large Language Model Inference. AAAI 2026. arXiv:2512.03024. https://ojs.aaai.org/index.php/ AAAI/article/view/40535 [5a] U.S. Environmental Protection Agency.Emissions & Generation Resource Integrated Database (eGRID) 2023. EPA, Washington, DC, 2024. [5b] Ember.Elec...
arXiv 2026
-
[5]
Li, P., Yang, J., Islam, M. A., & Ren, S.Making AI Less "Thirsty": Uncovering and Addressing the Secret Water Footprint of AI Models.Communications of the ACM, 2025. https://doi.org/10.1145/3724499
-
[6]
Energy and Policy Considerations for Deep Learning in NLP
Strubell, E., Ganesh, A., & McCallum, A.Energy and Policy Considerations for Deep Learning in NLP. ACL 2019.https://doi.org/10.18653/v1/P19-1355
work page internal anchor Pith review doi:10.18653/v1/p19-1355 2019
-
[7]
Patterson, D., et al.Carbon Emissions and Large Neural Network Training.Communications of the ACM, 65(6), 52–57, 2022.https://doi.org/10.1145/3520312
-
[8]
Lannelongue, L., Grealey, J., & Inouye, M.Green Algorithms: Quantifying the Carbon Footprint of Computation.Advanced Science, 8(12), 2021.https://doi.org/10.1002/advs.202100707
-
[9]
& Banse, A.EcoLogits: Evaluating the Environmental Impacts of Generative AI
Rincé, S. & Banse, A.EcoLogits: Evaluating the Environmental Impacts of Generative AI. Journal of Open Source Software, 10(111), 7471, 2025.https://doi.org/10.21105/joss.07471
-
[10]
NeurIPS 2019 Workshop on Tackling Climate Change with ML
Lottick, K., Susai, S., Friedler, S.A., & Wilson, J.P.Energy Usage Reports: Environmental awareness as part of algorithmic accountability. NeurIPS 2019 Workshop on Tackling Climate Change with ML
2019
-
[11]
Official Journal of the European Union, 2024
European Parliament and Council.EU Artificial Intelligence Act, Regulation 2024/1689/EU, Article 53 (Obligations for providers of general-purpose AI models). Official Journal of the European Union, 2024
2024
-
[12]
WRI/WBCSD, 2011
World Resources Institute & World Business Council for Sustainable Development.GHG Protocol Corporate Value Chain (Scope 3) Accounting and Reporting Standard. WRI/WBCSD, 2011
2011
-
[13]
https://doi.org/ 10.1111/jiec.12715
Stadler, K., et al.EXIOBASE 3: Developing a Time Series of Detailed Environmentally Extended Multi- Regional Input-Output Tables.Journal of Industrial Ecology, 22(3), 502–515, 2018. https://doi.org/ 10.1111/jiec.12715
-
[14]
World Resources Institute, 2020.https://doi.org/10.46830/wrirpt.20.00003
Reig, P., Luo, T., Christensen, E., & Sinistore, J.Guidance for Calculating Water Use Embedded in Purchased Electricity. World Resources Institute, 2020.https://doi.org/10.46830/wrirpt.20.00003
-
[15]
GSF, 2023
Green Software Foundation.Software Carbon Intensity (SCI) Specification, v1.1. GSF, 2023. Standardised as ISO/IEC 21031:2024.https://sci.greensoftware.foundation
2023
-
[16]
Singapore: EMA, 2025
Energy Market Authority (EMA).Singapore Energy Statistics 2025, Chapter 2: Energy Transformation. Singapore: EMA, 2025. https://www.ema.gov.sg/resources/singapore-energy-statistics/ chapter2 13 AI Inference in Corporate GHG InventoriesLlopis (2026) Supplementary Material The following sections contain technical derivations, detailed limitations, and the p...
2025
discussion (0)
Sign in with ORCID, Apple, or X to comment. Anyone can read and Pith papers without signing in.