Harnessing natural and mechanical airflows for surface-based atmospheric pollutant removal
Pith reviewed 2026-05-22 23:50 UTC · model grok-4.3
The pith
HVAC filters could remove CO2 at costs as low as $600 per tonne if sorption materials are added to their surfaces.
A machine-rendered reading of the paper's core claim, the machinery that carries it, and where it could break.
Core claim
Atmospheric flow rates to urban surfaces, solar farms, and HVAC systems are large enough that surface-based CO2-sorption and CH4-catalyst technologies, if applied at literature efficiencies across total surface area and maintained by replacement, could remove more than 1 GtCO2 per year, with HVAC filters achieving the lowest costs of $600 per tCO2 ($2000 per tCO2e) compared with $3000 per tCO2 for city surfaces.
What carries the argument
Transport-limited removal potential calculated from measured or modeled annual atmospheric flow rates to total surface area of each configuration, multiplied by literature removal efficiencies per unit area.
If this is right
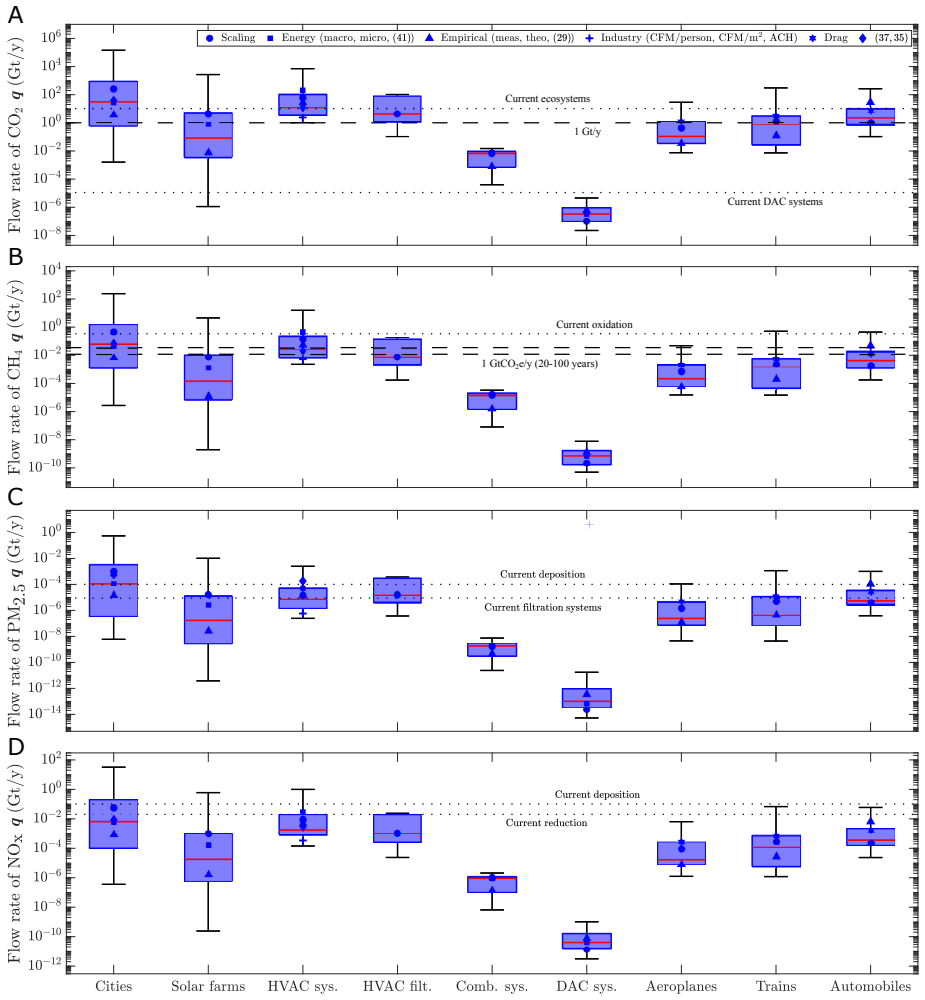
- Cities move a median 30 GtCO2, 0.06 GtCH4, 0.007 GtNOx and 0.0001 GtPM2.5 per year across their surfaces.
- HVAC systems, cities and solar farms each have flow rates sufficient for >1 GtCO2/y removal if lab efficiencies hold.
- Incorporating CO2-sorption or CH4-catalyst materials into HVAC filters yields the lowest cost per tonne among the configurations examined.
- Routine filter replacement is required to keep removal performance at the levels used for the cost estimates.
Where Pith is reading between the lines
- If real-world scaling works, the approach could be integrated into existing building codes and solar-farm maintenance schedules without new land use.
- The cost advantage of HVAC would widen further if filter replacement cycles can be aligned with normal building servicing rather than added as a separate expense.
- A next step would be to measure actual capture rates on operating HVAC units to test whether the transport-limited bound is reachable.
Load-bearing premise
Laboratory removal efficiencies can be applied to the full surface area of cities, solar farms, and HVAC systems without major loss while performance is kept up by routine replacement.
What would settle it
A large-scale field measurement on an actual building HVAC system or city block showing sustained removal rates per square meter fall more than 50 percent below the lab values used in the cost model.
Figures
read the original abstract
Removal strategies for atmospheric pollutants are increasingly being considered to mitigate global warming and improve public health. However, the global potential of surface-based removal techniques has not yet been quantified based on limits of pollutant transport and removal rates. We evaluate the atmospheric pollutant transport to surfaces and assess the potential of surface-based removal technologies for global-scale deployment across a variety of configurations, including air interaction with the built environment, mechanical ventilation and convection systems, and over the global transportation fleet. Cities provide the highest transport-limited removal potential, with median annual atmospheric flow rates of 30 GtCO$_2$, 0.06 GtCH$_4$, 0.007 GtNO$_\text{x}$ and 0.0001 GtPM$_{2.5}$ to their total surface area. Cities, solar farms and HVAC systems have flow rates large enough to potentially remove more than 1 GtCO$_2$/y (1 GtCO$_2$e/y for CH$_4$, 20-year GWP), if laboratory-scale removal efficiencies from the literature are applied to their total surface area, however, achieving this would require technological advances. Based on their transport-limited upper bounds, HVAC filters have the potential to achieve costs as low as \$600 per tCO$_2$ removed (\$2000 per tCO$_2$e) if CO$_2$-sorption (CH$_4$-catalyst) technologies are incorporated into their surfaces and performance is maintained through routine replacement, compared with \$3000 per tCO$_2$ (\$10000 per tCO$_2$e) for city surfaces, using literature values for these technologies' material and application costs. These findings demonstrate that integrating surface-based pollutant removal technologies into infrastructure may offer a pathway to advance climate objectives, though further studies are needed to assess their feasibility in application, and application-implementation rates and cost.
Editorial analysis
A structured set of objections, weighed in public.
Referee Report
Summary. The manuscript calculates transport-limited flow rates of CO2, CH4, NOx and PM2.5 to surfaces including cities (median 30 GtCO2/y), solar farms, HVAC systems and the global transportation fleet. Applying literature lab-scale removal efficiencies to these full surface areas yields potentials exceeding 1 GtCO2/y (or 1 GtCO2e/y for CH4) for several configurations, with derived costs of $600/tCO2 ($2000/tCO2e) for HVAC filters incorporating sorption/catalyst technologies versus $3000/tCO2 ($10000/tCO2e) for city surfaces, assuming routine replacement maintains performance.
Significance. The transport-limited upper-bound framework is a clear strength and could usefully bound the scale of surface-based removal if the scaling assumptions are later validated. The cost comparison between HVAC and city surfaces, if substantiated, would highlight infrastructure integration as a potentially lower-cost route than diffuse urban surfaces. However, the quantitative claims rest entirely on untested extrapolation of lab efficiencies, limiting immediate policy or engineering relevance.
major comments (2)
- [Abstract] Abstract: the HVAC cost claim of $600 per tCO2 removed is obtained by multiplying transport-limited flow rates by literature lab-scale removal efficiencies and dividing by material/application costs. No section quantifies or bounds the reduction in effective efficiency that would arise from boundary-layer resistance, flow maldistribution across heterogeneous km-scale surfaces, or long-term sorbent deactivation; this direct extrapolation is load-bearing for the reported cost advantage over city surfaces.
- [Abstract] Abstract and results discussion: the removal potentials (>1 GtCO2/y) and all cost figures are presented without error bars, sensitivity analysis on the lab efficiencies, or discussion of scaling losses, despite the text acknowledging that technological advances are required. The absence of these elements makes the central numerical claims unverifiable from the given information.
minor comments (1)
- [Abstract] Abstract: subscript notation for NOx (NO$ _text{x} $) and PM2.5 is inconsistent with standard inline math; a uniform typesetting convention would improve readability.
Simulated Author's Rebuttal
We thank the referee for their review. Our manuscript provides transport-limited upper bounds on removal potentials by applying literature lab efficiencies to calculated surface flows, with explicit caveats that technological advances are needed. We respond to the major comments below.
read point-by-point responses
-
Referee: [Abstract] Abstract: the HVAC cost claim of $600 per tCO2 removed is obtained by multiplying transport-limited flow rates by literature lab-scale removal efficiencies and dividing by material/application costs. No section quantifies or bounds the reduction in effective efficiency that would arise from boundary-layer resistance, flow maldistribution across heterogeneous km-scale surfaces, or long-term sorbent deactivation; this direct extrapolation is load-bearing for the reported cost advantage over city surfaces.
Authors: We agree the cost figures assume lab efficiencies can be maintained at full scale without the cited losses. The analysis is presented as an optimistic upper bound conditional on achieving those efficiencies, as noted in the text. We will revise the abstract and add a discussion paragraph explicitly addressing how boundary-layer resistance, maldistribution, and deactivation could reduce effective rates and alter the HVAC-city cost comparison, while preserving the transport-limited framework. Precise quantification of these reductions requires additional modeling beyond the current scope. revision: partial
-
Referee: [Abstract] Abstract and results discussion: the removal potentials (>1 GtCO2/y) and all cost figures are presented without error bars, sensitivity analysis on the lab efficiencies, or discussion of scaling losses, despite the text acknowledging that technological advances are required. The absence of these elements makes the central numerical claims unverifiable from the given information.
Authors: The numerical values use point estimates from the cited literature applied to the transport flows. To enhance verifiability we will add a sensitivity analysis in the results section, showing how potentials and costs change under reduced effective efficiencies (e.g., 10-100% of lab values) to illustrate scaling losses and the impact of required technological advances. This will be referenced in the abstract and discussion. Error bars are omitted because the source studies report point values without uncertainties. revision: yes
Circularity Check
No circularity: cost and removal potentials derived from external literature values applied to independently calculated transport flows.
full rationale
The paper calculates transport-limited flow rates to surfaces using atmospheric data and surface areas, then multiplies by removal efficiencies and divides by material costs taken directly from external literature. No internal equations fit parameters to subsets of the paper's own results and rename them as predictions, no self-citations supply load-bearing uniqueness theorems or ansatzes, and no derivation reduces by construction to its inputs. The scalability assumption (lab efficiencies to city/HVAC scales) is an external modeling choice, not a circular reduction.
Axiom & Free-Parameter Ledger
free parameters (2)
- lab-scale removal efficiencies
- material and application costs
axioms (2)
- domain assumption Atmospheric flow rates to surfaces can be represented by the stated median annual values for each configuration
- domain assumption Performance of incorporated technologies can be maintained through routine replacement
Lean theorems connected to this paper
-
IndisputableMonolith/Foundation/AbsoluteFloorClosure.leanreality_from_one_distinction unclear?
unclearRelation between the paper passage and the cited Recognition theorem.
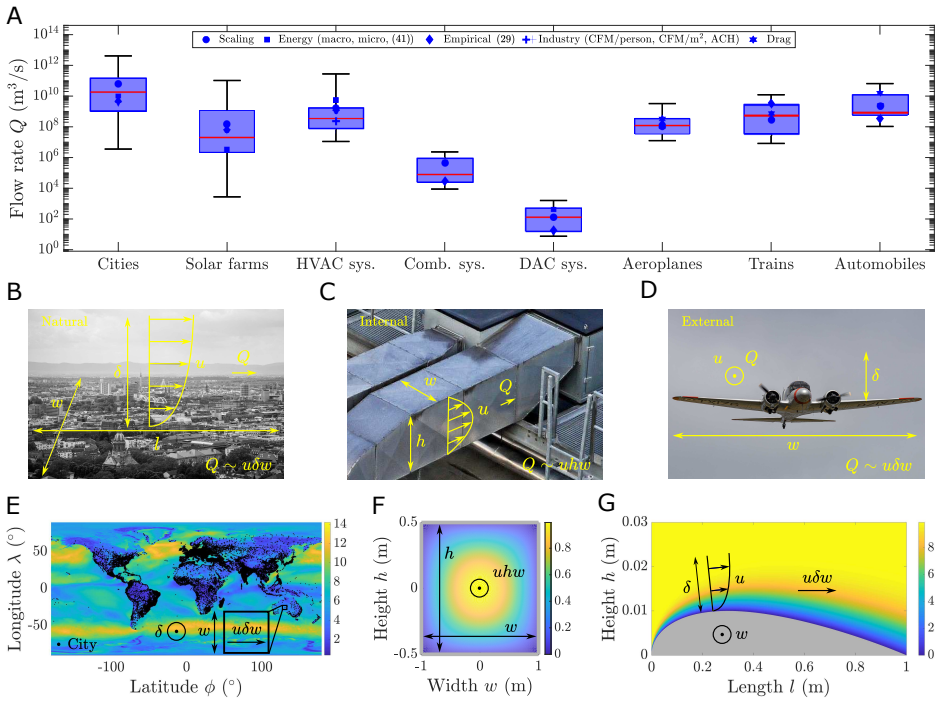
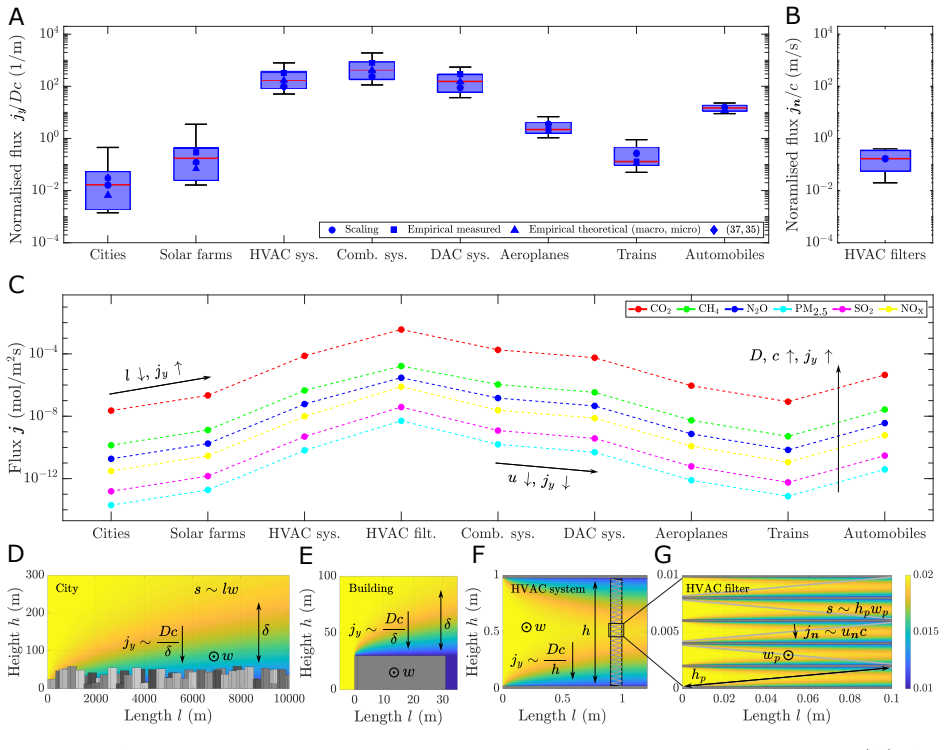
The normal pollutant flux jy (mol/m2/s) at the surface is determined by the diffusive flux, −Dcy... Q ≈ nuδl. (1) qy ≈ ns(D + De)c / (δ/Sc1/3). (2)
-
IndisputableMonolith/Foundation/AlexanderDuality.leanalexander_duality_circle_linking unclear?
unclearRelation between the paper passage and the cited Recognition theorem.
We utilise M-O similarity theory... qy ≈ ns(D + De)c / (h̄ ln(h̄/y0)). (11)
What do these tags mean?
- matches
- The paper's claim is directly supported by a theorem in the formal canon.
- supports
- The theorem supports part of the paper's argument, but the paper may add assumptions or extra steps.
- extends
- The paper goes beyond the formal theorem; the theorem is a base layer rather than the whole result.
- uses
- The paper appears to rely on the theorem as machinery.
- contradicts
- The paper's claim conflicts with a theorem or certificate in the canon.
- unclear
- Pith found a possible connection, but the passage is too broad, indirect, or ambiguous to say the theorem truly supports the claim.
Forward citations
Cited by 1 Pith paper
-
Modelling the photocatalytic oxidation of methane and other air pollutants for applications in ventilation systems
TiO2 PCO achieves 24.4% CH4 conversion at 2 ppm in lab tests but model predicts ~0.017% in ventilation scale, with potential net-negative CO2e if removal exceeds production and operation emissions.
Reference graph
Works this paper leans on
-
[1]
(1) Britter, R. E.; Hanna, S. R. Flow and dispersion in urban areas. Annu. Rev. Fluid Mech. 2003, 35, 469–496. (2) Bettencourt, L. M. A.; Lobo, J. Urban scaling in Europe. J. R. Soc. Interface 2016, 13, 20160005. (3) Holzworth, G. C. Mixing heights, wind speeds, and potential for urban air pol lution throughout the contiguous United States ; US Government...
work page 2003
-
[2]
(4) Angel, S.; Parent, J.; Civco, D. L.; Blei, A.; Potere, D. The dimensio ns of global urban expansion: Estimates and projections for all countries, 2000–20
work page 2000
-
[3]
Prog. Plann. 2011, 75, 53–107. (5) Allen, L.; Lindberg, F.; Grimmond, C. S. B. Global to city scale urba n anthropogenic heat flux: model and variability. Int. J. Climatol. 2011, 31,
work page 2011
-
[4]
Intra-urban differences in canopy layer air temperature at a mid-latitude city
(6) Erell, E.; Williamson, T. Intra-urban differences in canopy layer air temperature at a mid-latitude city. Int. J. Climatol. 2007, 27, 1243–1255. (7) Giardina, M.; Donateo, A.; Buffa, P.; Contini, D.; Cervone, A.; Lomb ardo, C.; Roc- chi, F. Atmospheric dry deposition processes of particles on urban and suburban sur- faces: Modelling and validation works...
work page 2007
-
[5]
Earth Syst. Sci. Data 2022, 14, 4811–4900. (9) Dlugokencky, E. J.; Nisbet, E. G.; Fisher, R.; Lowry, D. Global at mospheric methane: budget, changes and dangers. Philos. Trans. R. Soc. A 2011, 369, 2058–2072. 21 (10) Tian, H.; Pan, N.; Thompson, R. L.; Canadell, J. G.; Suntharalinga m, P.; Regnier, P.; Davidson, E. A.; Prather, M.; Ciais, P.; Muntean, M.;...
work page 2022
-
[6]
Environmental and health impacts of air pollution: a review
(12) Manisalidis, I.; Stavropoulou, E.; Stavropoulos, A.; Bezirtzoglo u, E. Environmental and health impacts of air pollution: a review. Front. Public Health 2020, 8,
work page 2020
-
[7]
(13) Boningari, T.; Smirniotis, P. G. Impact of nitrogen oxides on the environment and human health: Mn-based materials for the NO x abatement. Curr. Opin. Chem. Eng. 2016, 13, 133–141. (14) Steadman, P.; Evans, S.; Batty, M. Wall area, volume and plan d epth in the building stock. Build. Res. Inf. 2009, 37, 455–467. (15) Davies, R. G.; Barbosa, O.; Fulle...
work page 2016
-
[8]
(22) Fisk, W. J.; Delp, W. W.; Diamond, R.; Dickerhoff, D.; Levinson, R.; M odera, M.; Nematollahi, M.; Wang, D. Duct systems in large commercial buildings: p hysical char- acterization, air leakage, and heat conduction gains. Energy Build. 2000, 32, 109–119. (23) Fisk, W. J.; Faulkner, D.; Sullivan, D. P. An evaluation of technologies for real-time measur...
work page 2000
-
[9]
(24) Knight, I. P. Assessing electrical energy use in HV AC systems . REHV A J. 2012, 49, 6–11. (25) Merzkirch, A.; Maas, S.; Scholzen, F.; Waldmann, D. Field tests o f centralized and decentralized ventilation units in residential buildings: Specific fan po wer, heat recovery efficiency, shortcuts and volume flow unbalances. Energy Build. 2016, 116, 376–383....
work page 2012
-
[10]
The global population will soon reach 8 billion—then what
(27) Herrmann, M. The global population will soon reach 8 billion—then what. UN Chronicle 2022, 59, Available online: https://www.un.org/en/un-chronicle/ global-population-will-soon-reach-8-billion-then-wh at. (28) Persily, A. K.; Gorfain, J. Analysis of ventilation data from the US Environmental Protection Agency building assessment survey and evaluati o...
work page 2022
-
[11]
Role of air changes per hour (ACH) in po ssible transmission of airborne infections
(29) Memarzadeh, F.; Xu, W. Role of air changes per hour (ACH) in po ssible transmission of airborne infections. Building Simulation. 2012; pp 15–28. (30) Hale, M. E.; Brittain, F. Effect of alternative combinations of so urce type, sizes, and complexity on accuracy of modeling a power plant. INTER-NOISE and NOISE-CON Congress and Conference Proceedings. 2...
work page 2012
-
[12]
2020; https:// www.carbonbrief.org/mapped-worlds-coal-power-plants /, Accessed: October 18,
work page 2020
-
[13]
M.; Colbert, T.; Hensel, J.; Balako- taiah, V
(33) Tegeler, E.; Cui, Y.; Masoudi, M.; Bahmanpour, A. M.; Colbert, T.; Hensel, J.; Balako- taiah, V. A novel contactor for reducing the cost of direct air cap ture of CO2. Chem. Eng. Sci. 2023, 281, 119107. (34) International Energy Agency Direct Air Capture. 2023; https://www. iea.org/energy-system/carbon-capture-utilisation-an d-storage/ direct-air-cap...
work page 2023
-
[14]
(40) McMasters, J. H.; Kroo, I. M. Advanced configurations for v ery large transport air- planes. Aircraft Des. 1998, 1, 217–242. 24 (41) Filippone, A. Data and performances of selected aircraft and rotorcraft. Prog. Aerosp. Sci. 2000, 36, 629–654. (42) Kl¨ ower, M.; Allen, M. R.; Lee, D. S.; Proud, S. R.; Gallagher, L.; Sk owron, A. Quanti- fying aviation...
work page 1998
-
[15]
(44) Schafer, D. H.; Barkan, C. P. L. Relationship between train len gth and accident causes and rates. Transp. Res. Rec. 2008, 2043, 73–82. (45) Allotta, B.; Colla, V.; Malvezzi, M. Train position and speed estimat ion using wheel velocity measurements. Proc. Inst. Mech. Eng. F 2002, 216, 207–225. (46) Singh, S. New Mega Trends: Implications for Our Futu...
work page 2008
-
[16]
(54) Turpin, B. J.; Saxena, P.; Andrews, E. Measuring and simulating particulate organics in the atmosphere: problems and prospects. Atmos. Environ. 2000, 34, 2983–3013. 25 (55) Schlichting, H.; Gersten, K. Boundary-layer theory ; Springer,
work page 2000
-
[17]
2017; Copernicus Climate Change Service (C3 S) Data Store (CDS), accessed
(57) Hersbach, H.; Bell, B.; Berrisford, P.; Hirahara, S.; Hor´ anyi, A .; Mu˜ noz- Sabater, J.; Nicolas, J.; Peubey, C.; Radu, R.; Schepers, D.; others ERA5 re- analysis (single levels). 2017; Copernicus Climate Change Service (C3 S) Data Store (CDS), accessed
work page 2017
-
[18]
(58) SimpleMaps World Cities Database
https://cds.climate.copernicus.eu/datasets/ reanalysis-era5-single-levels. (58) SimpleMaps World Cities Database. 2024; https://simplemaps.com/data/ world-cities, Accessed: 2024-10-17. (59) Dunnett, S.; Sorichetta, A.; Taylor, G.; Eigenbrod, F. Harmon ised global datasets of wind and solar farm locations and power. Sci. Data 2020, 7,
work page 2024
-
[19]
(61) Schild, P. G.; Mysen, M. Recommendations on specific fan power and fan system effi- ciency. Tech. Note AIVC 2009, 65 . (62) White, F. M.; Xue, H. Fluid mechanics ; McGraw-Hill, 2003; Vol
work page 2009
-
[20]
(64) Council, I. C. International Building Code. 2021; https://codes.iccsafe.org/ content/IBC2021P1, Accessed: 2024-11-26. (65) American Society of Heating, Refrigerating and Air-Conditionin g Engineers ASHRAE Handbook: Fundamentals, 2024th ed.; ASHRAE: Atlanta, GA,
work page 2021
-
[21]
(66) International, S. SAE Aerospace Standards. 2024; https://www.sae.org/standards, Accessed: 2024-11-26. 26
work page 2024
discussion (0)
Sign in with ORCID, Apple, or X to comment. Anyone can read and Pith papers without signing in.