REVIEW 3 major objections 7 minor 10 references
Direct Estimation of Pediatric Heart Rate Variability from BOLD-fMRI: A Machine Learning Approach Using Dynamic Connectivity
T0 review · 3 major / 7 minor · reviewed 2026-08-08 · deepseek-v4-flash
Pith's one-line read This paper claims that pediatric heart rate variability can be estimated directly from resting-state BOLD-fMRI, without a peripheral pulse sensor, using a hybrid 1D-CNN and GRU on dynamic functional connectivity plus white-matter ROIs…
desk verdict A plausible extension of the group's RV work, but the headline 8% is not yet credible because the cross-validation may not be subject-disjoint. read the letter →
The pith
A machine-rendered reading of the paper's core claim, the machinery that carries it, and where it could break.
The reading
What carries the argument
The load-bearing machinery is a one-dimensional convolutional neural network stacked with gated recurrent units, a recurrent architecture that learns temporal patterns. A 65-TR sliding window slides over each subject's BOLD time series across 628 ROI-mean signals, and the target is the HRV value at the 10th point of the window, so the network can use both past and future BOLD context. The input representation combines a dynamic resting-state functional-connectivity parcellation with 48 white-matter ROIs from a diffusion-tensor atlas, and the model is trained with ten-fold cross-validation and evaluated with MAE, MSE, Pearson correlation, and dynamic time warping.
What would settle it
Re-test the trained model with the HRV label placed at different positions inside the 65-TR window; if reconstruction accuracy peaks at a different lag for younger than for older children, the fixed 10th-point timing assumption is false.
Extended reading notes
Core claim
The central discovery claimed is that BOLD-fMRI contains a recoverable HRV signal in children, and that the signal is best captured by time-varying dynamic functional connectivity plus white-matter ROIs rather than static cortical parcellations or anatomical ROIs. The authors report that their hybrid 1D-CNN+GRU model, using input matrices of $65 \times 628$ and a sliding window with HRV labeled at the 10th time point, reconstructs HRV waveforms with high precision, particularly during large HRV fluctuations, and improves accuracy by over 8% relative to static and structural baselines. They interpret this as evidence that dynamic functional atlases encode the complex temporal dynamics of cardiac-driven BOLD fluctuations across both gray and white matter.
Load-bearing premise
The method assumes that a fixed 65-TR sliding window with the HRV label at the 10th point captures the true timing between BOLD fluctuations and heart-rate variation in every pediatric subject, even though cardiac and hemodynamic timing changes during development.
Editorial extensions
If this is right
- Pediatric fMRI studies that discarded cardiac recordings could estimate HRV retrospectively from stored BOLD time series, avoiding the need for peripheral devices.
- Removing the need for PPG hardware would simplify pediatric scan setup and reduce costs.
- Estimated HRV waveforms could be used as regressors to clean cardiac-related BOLD variance, potentially improving downstream functional-connectivity analyses.
- The same dynamic-connectivity-plus-white-matter input representation may extend to estimating other physiological waveforms, building on the prior respiratory-variation result.
Reading between the lines
- The 65-TR window with the 10th-point target implies the model uses roughly 40 seconds of BOLD context; if HRV contains slower fluctuations, the fixed window may limit capture of very slow cardiac rhythms even when the reported metrics look good.
- The success with white-matter ROIs hints that the model learns global physiological artifacts rather than region-specific cardiac coupling, so testing on datasets with head motion or different TRs would help separate true signal from motion-driven confounds.
- Because the atlases used here were designed for adults and applied to children, an age-specific atlas might further improve accuracy, though the paper does not test this.
- A direct comparison against a cardiac-response-function regression baseline would clarify how much of the gain comes from the deep network versus from the dynamic connectivity features themselves.
Editorial analysis
A structured set of objections, weighed in public.
Referee Report
Summary. The paper proposes a machine learning framework to reconstruct heart rate variability (HRV) waveforms directly from resting-state BOLD fMRI in pediatric participants, using data from the Human Connectome Project in Development (HCP-D). A hybrid 1D-CNN+GRU model processes BOLD signals from 628 ROIs (gray matter, subcortical, and white matter), with a 65-TR sliding window that estimates HRV at the 10th point. From 2451 scans, 352 with high-quality PPG signals are selected. Ten-fold cross-validation is applied, and the authors report an 8% improvement in HRV accuracy for the dynamic functional plus white matter configuration over static/structural configurations. The paper claims this is the first study to estimate HRV from BOLD-fMRI in pediatric subjects and argues that the method could remove the need for peripheral photoplethysmography devices.
Significance. If the result holds, the approach could be practically valuable for pediatric fMRI studies where cardiac recordings are often missing or noisy. The paper has noteworthy strengths: the target HRV is independently measured via PPG, the model is evaluated across multiple ROI configurations, and the pediatric focus fills a genuine gap. However, the evidence as presented is thin: no numeric performance values, confidence intervals, or test statistics are reported, and the cross-validation scheme is not shown to be subject-disjoint. The central claim is plausible and falsifiable, but rigorous validation is needed before the 8% improvement can be accepted.
major comments (3)
- [Method] The cross-validation protocol is described only as 'dividing the dataset into ten subsets' without stating that the folds are subject-disjoint. HCP-D contains multiple imaging runs per participant (2451 scans from roughly 650 participants), so a scan-level split can place runs from the same child in both training and test sets. Because BOLD-HRV coupling, vascular response, head motion, and session effects are highly similar within a participant, this can artificially inflate the reported 8% improvement. Please clarify whether the 352 selected scans were split by participant; if not, re-run the evaluation with subject-level folds and report subject-aggregated metrics. This issue is load-bearing for the central claim.
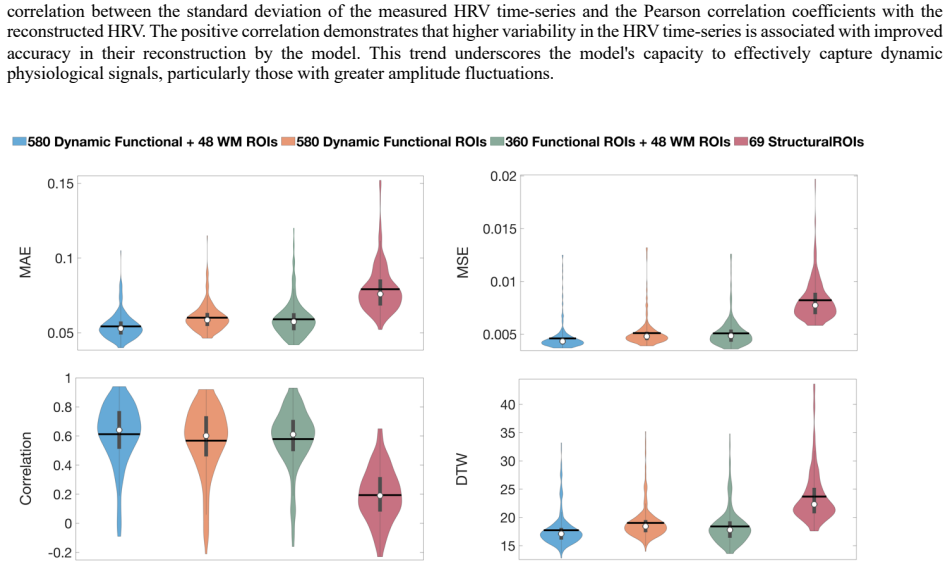
- [Results] No numeric performance values are reported in the text. The 8% improvement and the statement that 'statistical tests confirmed significant differences between configurations' cannot be verified from the violin plots in Figure 5 alone. Report exact MAE, MSE, Pearson r, and DTW (mean ± SD or 95% CI) for each of the four configurations, and provide the specific test name, test statistic, and p-value (or effect size).
- [Method] The fixed 65-TR sliding window with HRV estimated at the 10th point assumes a constant temporal offset between BOLD fluctuations and HRV across all participants. The Discussion acknowledges limitations of the sliding-window technique, but the main result depends on this choice. Provide a sensitivity analysis over window length and offset, or at least present evidence (e.g., from the training set or from cardiac response function literature) that the 10th-point offset is appropriate for the pediatric age range.
minor comments (7)
- [Abstract] The phrase '8% improvement in HRV accuracy' is ambiguous; specify whether the improvement is in Pearson correlation, MAE, MSE, or DTW.
- [Method] Dynamic Time Warping (DTW) is introduced without a definition; also state whether lower DTW indicates better reconstruction.
- [Method] The input matrix format [65 × 628] should be clarified: specify whether the first dimension is time points and the second is ROIs, and state the ordering of gray matter, subcortical, and white matter ROIs.
- [Method] Provide the network hyperparameters (number of convolutional layers, kernel sizes, GRU units, dropout, epochs, optimizer) to allow reproducibility.
- [Method / Figure 2] The selection criteria for classifying PPG signals as 'correctable' versus 'uncorrectable' are subjective; describe the quality-control procedure quantitatively.
- [Results] Figure 4 is described as showing a correlation between HRV time-series standard deviation and reconstruction correlation, but the correlation coefficient and p-value are not reported; please add them.
- [Discussion] The statement that 'statistical tests confirmed significant differences' lacks the test name and any correction for multiple comparisons; this information should appear in the Results section.
Circularity Check
No significant circularity: HRV is measured externally by PPG, the model is trained against that external signal, and the reported 8% improvement is an empirical comparison among ROI configurations.
full rationale
The claimed derivation is a supervised mapping: HCP-D BOLD time series from 628 ROIs serve as inputs, and quality-screened PPG-derived HRV serves as the independent target; test-time MAE, MSE, Pearson r, and DTW compare the model output to that external signal. The 8% improvement is not a fitted parameter renamed as a prediction; it is a reported test-set difference between dynamic-plus-white-matter ROIs and static/structural configurations, and it does not enter the model construction. The only self-citation, reference [1], motivates the approach through the authors' prior respiratory-variation work and sets a comparison baseline, but the HRV result is new, uses HCP-D PPG as ground truth, and is not forced by that citation. The fixed 65-TR/10th-point lag is an empirical modeling assumption, and the lack of explicit subject-disjoint folds is a generalization/validity risk, but neither makes the target equal to an input by construction. No equation, parameter, or uniqueness theorem in the text reduces the reported HRV accuracy to its own assumptions, so no circular step is exhibited.
Assumptions & free parameters
free parameters (4)
- Sliding window length =
65 TR
- Prediction offset within window =
10th TR
- ROI configuration =
628 ROIs (518 cortical, 62 subcortical, 48 white matter)
- Network hyperparameters (layers, units, epochs, etc.) =
not disclosed
assumptions (3)
- domain assumption BOLD-fMRI fluctuations carry sufficient cardiac-related information to reconstruct HRV waveforms.
- domain assumption PPG-derived HRV is a valid ground truth for training and evaluation.
- standard math Supervised deep learning can approximate the BOLD-to-HRV mapping from the provided dataset.
Cite this review
Pith. "Pith review of Direct Estimation of Pediatric Heart Rate Variability from BOLD-fMRI: A Machine Learning Approach Using Dynamic Connectivity." pith.science (2026). https://pith.science/paper/LF74R3JV
@misc{pith2026250206920,
  author       = {Pith},
  title        = {Pith review of: Direct Estimation of Pediatric Heart Rate Variability from BOLD-fMRI: A Machine Learning Approach Using Dynamic Connectivity},
  year         = {2026},
  howpublished = {\url{https://pith.science/paper/LF74R3JV}},
  note         = {Machine review of arXiv:2502.06920}
}
read the original abstract
In many pediatric fMRI studies, cardiac signals are often missing or of poor quality. A tool to extract Heart Rate Variation (HRV) waveforms directly from fMRI data, without the need for peripheral recording devices, would be highly beneficial. We developed a machine learning framework to accurately reconstruct HRV for pediatric applications. A hybrid model combining one-dimensional Convolutional Neural Networks (1D-CNN) and Gated Recurrent Units (GRU) analyzed BOLD signals from 628 ROIs, integrating past and future data. The model achieved an 8% improvement in HRV accuracy, as evidenced by enhanced performance metrics. This approach eliminates the need for peripheral photoplethysmography devices, reduces costs, and simplifies procedures in pediatric fMRI. Additionally, it improves the robustness of pediatric fMRI studies, which are more sensitive to physiological and developmental variations than those in adults.
Figures


Figures from the paper (2 more)

Reference graph
Works this paper leans on
-
[1]
* 2025 International Society of Magnetic Resonance in Medicine, Hawaii, USA, May 10-15. Abstract Number 8872 Direct Estimation of Pediatric Heart Rate Variability from BOLD-fMRI: A Machine Learning Approach Using Dynamic Connectivity* Abdoljalil Addeh 1-3,5, Karen Ardila 1-3,5, Rebecca J Williams6 G. Bruce Pike,3-5 M. Ethan MacDonald 1-3,5 1 Department of...
work page 2025
-
[2]
M. P. Harms et al., "Extending the Human Connectome Project across ages: Imaging protocols for the Lifespan Development and Aging projects," (in eng), Neuroimage, vol. 183, pp. 972-984, Dec 2018, doi: 10.1016/j.neuroimage.2018.09.060
-
[3]
HRV Reconstruction Method from BOLD Signals: This schematic demonstrates our approach using averaged BOLD time series from 628 ROIs. HRV is estimated from a 65 TR sliding window at the 10th point, utilizing past and future data to capture the inherent dynamic fluctuations, typically around 40 seconds. The input matrix is formatted as [65 Î 628], represent...
work page 2025
-
[4]
Evaluation of HRV reconstruction accuracy: This figure demonstrates the accuracy of HRV reconstruction using a hybrid 1D-CNN and GRU model across 628 ROIs. It compares measured and model-reconstructed HRV waveforms in three test cases (a, b, c), with corresponding MAE, MSE, Pearson correlation (r), and DTW values highlighted. These graphs highlight the mo...
work page 2025
-
[5]
Comparative Performance of Different HRV Input Configurations. This figure presents violin plots depicting the performance of the machine learning model in reconstructing HRV across various input configurations. The configuration combining Dynamic Functional ROIs with White Matter demonstrates the highest effectiveness, underscoring the importance of inte...
work page 2025
-
[6]
designed to enhance the model's ability to capture the intricate temporal dynamics of HRV by integrating data from both gray and white matter. This approach is expected to refine the accuracy of HRV estimation, with an anticipated improvement in performance metrics by at least 5%, compared to static functional connectivity-based brain atlases used in the ...
work page 2025
-
[7]
A. Addeh, F. Vega, P. R. Medi, R. J. Williams, G. B. Pike, and M. E. MacDonald, "Direct machine learning reconstruction of respiratory variation waveforms from resting state fMRI data in a pediatric population," NeuroImage, vol. 269, p. 119904, 2023/04/01/ 2023, doi: https://doi.org/10.1016/j.neuroimage.2023.119904
arXiv 2023
-
[8]
K. Shmueli et al., "Low-frequency fluctuations in the cardiac rate as a source of variance in the resting-state fMRI BOLD signal," (in eng), Neuroimage, vol. 38, no. 2, pp. 306-20, Nov 1 2007, doi: 10.1016/j.neuroimage.2007.07.037
Show all 10 references
-
[9]
Mapping the end-tidal CO2 response function in the resting-state BOLD fMRI signal: Spatial specificity, test–retest reliability and effect of fMRI sampling rate,
A. M. Golestani, C. Chang, J. B. Kwinta, Y . B. Khatamian, and J. Jean Chen, "Mapping the end-tidal CO2 response function in the resting-state BOLD fMRI signal: Spatial specificity, test–retest reliability and effect of fMRI sampling rate," NeuroImage, vol. 104, pp. 266-277, 2...
2015 doi
-
[10]
A c o m p o n e n t b a s e d n o i s e c o r r e c t i o n m e t h o d ( C o m p C o r ) f o r BOLD and perfusion based fMRI,
Y. B e h z a d i , K . R e s t o m , J . L i a u , a n d T. T. L i u , " A c o m p o n e n t b a s e d n o i s e c o r r e c t i o n m e t h o d ( C o m p C o r ) f o r BOLD and perfusion based fMRI," (in eng), Neuroimage, vol. 37, no. 1, pp. 90-101, Aug 1 2007, doi: 10.1016/j...
2007 doi
Reviewed August 8, 2026 · model on record in the stance chip above.
Discussion (0). Continue with ORCID to comment.