REVIEW 3 major objections 7 minor 14 references
ForeCite: Adapting Pre-Trained Language Models to Predict Future Citation Rates of Academic Papers
T0 review · 3 major / 7 minor · reviewed 2026-08-15 · deepseek-v4-flash
Pith's one-line read ForeCite claims that appending a linear regression head to a pre-trained causal language model and fine-tuning with QLoRA predicts average monthly citation rates from manuscript text alone, reaching Spearman $\rho = 0.826$ on a 900K-paper…
desk verdict Solid empirical study with a straightforward recipe and honest reporting, but the headline forecast claim rests on a random split while the paper's own temporal holdout shows decay. read the letter →
The pith
A machine-rendered reading of the paper's core claim, the machinery that carries it, and where it could break.
The reading
What carries the argument
The machinery is a linear regression head attached to the final hidden state of a pre-trained causal language model, trained in two phases: first with the base model frozen to train only the head, then jointly with the whole model via QLoRA (quantized low-rank adaptation of a 4-bit base model). The target is the average monthly citation rate, log-transformed and standardized with training-split statistics, which maps the skewed count distribution to a near-Gaussian regression target. A bounded least-squares scaling law, $f(p,d) = \tanh(\beta_0 + \beta_1 \log_2 p + \beta_2 \log_2 d)$, with $p$ the parameter count and $d$ the percentage of the corpus, is used to extrapolate performance across model sizes and data volumes.
What would settle it
Train ForeCite on papers published up to 2020 and evaluate on papers published in 2024--2025, with no overlap in publication month; if the Spearman correlation on that chronological holdout falls below the previous best $\rho = 0.556$, then the reported $\rho = 0.826$ overstates the model's ability to predict future citation rates. The paper already contains a partial version of this test: the Bloom-560m temporal holdout decays from $r = 0.713$ to $r = 0.511$ by mid-2025.
Extended reading notes
Core claim
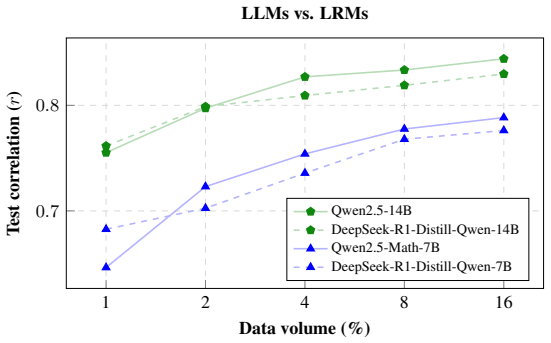
ForeCite's central claim is that end-to-end regression with a causal transformer—not classification, not embeddings feeding a separate regressor—is sufficient to forecast citation impact from text. The claim is quantified: with the Qwen2.5-14B base model fine-tuned on 16% of the corpus via QLoRA, the model attains $\rho = 0.826$ and $R^2 = 0.706$ on a random test split, beating the cited previous state of the art ($\rho = 0.556$ with peer-review text, $R^2 = 0.454$ with figures) by a wide margin. The paper's scaling-law analysis indicates that the result is not a plateau: extrapolating a bounded least-squares fit to a 288B-parameter model trained on the full corpus yields $r \approx 0.94$ and $\rho \approx 0.93$. The temporal holdout, in contrast, shows a model released in 2022 decaying from $r = 0.713$ to $r = 0.511$ within roughly two years of out-of-distribution papers.
Load-bearing premise
The reported $\rho = 0.826$ depends on treating a random 90/10 split of the 2000--2024 corpus as a stand-in for future papers; if test papers share publication windows with training papers, the model can learn era-specific style and field trends, and the paper's own temporal holdout (decay from $r = 0.713$ to $r = 0.511$) shows that this premise only partially holds.
Editorial extensions
If this is right
- Citation ranking becomes a text-only operation: no citation graph, author profile, or peer-review text is needed to exceed previously reported predictive correlations.
- Performance appears to follow a predictable scaling law, so the authors extrapolate that a 288B-parameter model trained on the full corpus would reach $r \approx 0.94$ and $\rho \approx 0.93$.
- Titles and abstracts carry most of the attribution, yet removing them costs less than $0.02$ in Pearson $r$, suggesting that abstract-only inputs could rank papers cheaply without catastrophic loss.
- The temporal holdout profile—strong for about one month, then steadily decaying—implies that practical deployments would need periodic retraining or online adaptation to stay accurate.
- Reasoning-specialized fine-tuning does not help and slightly hurts citation prediction, suggesting that general semantic knowledge, not logical specialization, drives the signal.
Reading between the lines
- The headline $\rho = 0.826$ rests on a random 90/10 split of papers published 2000--2024; because training and test papers can share publication windows, part of the measured signal may be era-specific style and field trends rather than intrinsic citable quality, so a strict chronological split is the deployment test.
- The observed decay from $r = 0.713$ to $r = 0.511$ within about two years suggests the useful forecasting horizon of such models is short; practical systems would need confidence intervals that widen with time since training.
- If titles and abstracts dominate the attribution, authors could plausibly game the predictor by rewriting abstracts in the rewarded style; a testable defense is section-level dropout during training, then measuring whether attribution spreads to the body text.
- The same linear-head-on-causal-LM recipe should transfer to other text-to-outcome regression problems, such as predicting replication, clinical uptake, or peer-review scores, whenever a large labeled text corpus exists.
Signed reviews
Editorial analysis
A structured set of objections, weighed in public.
Referee Report
Summary. ForeCite appends a linear regression head to pre-trained causal language models and fine-tunes via QLoRA to predict log-transformed average monthly citation rates from full-text Markdown of biomedical papers. The authors build a 900K+ corpus from Elsevier API, train five LMs (0.5B–14B) on 1%–16% of the data under a 90/10 random split, and report the headline result rho=0.826 (Pearson r=0.844) for Qwen2.5-14B, which they describe as a 27-point improvement over prior SOTA. They also present scaling-law fits, a temporal holdout study on Bloom-560m, gradient saliency, ablations, and pre-training comparisons. The paper claims state-of-the-art forecasting of future citation rates with 'practical robustness' confirmed by temporal holdout.
Significance. If the results held under temporal evaluation, ForeCite would be a substantial advance: it is a simple, end-to-end regression adapter for LLMs, applied to a large curated corpus, with a systematic scaling-law grid, honest reporting of temporal decay, and useful ablations and saliency analysis. The authors are transparent about the limitations of single-run experiments and compute constraints. However, the headline result is currently based on a random split and on cross-dataset comparisons, so the significance hinges on the requested revisions. The temporal holdout with Bloom-560m is a good-faith experiment and suggests the framework works out-of-distribution for a few months, but it does not cover the model used for the headline claim.
major comments (3)
- [§3.3, §4.3, §6] The abstract and §6 claim that ForeCite predicts 'future citation rates' and that 'temporal holdout experiments confirm practical robustness', but the headline rho=0.826 is measured on a 90/10 random split defined in §3.3 over papers published 2000–2024. A random split interleaves training and test papers from the same years and topic cohorts, so the model can exploit year-specific citation patterns rather than forecast unseen future work. The paper's own temporal holdout (§4.3, Figure 5) shows Bloom-560m's Pearson r decaying from 0.713 at January 2023 to 0.631 one month later and 0.511 by mid-2025, while the random-split test r for the same model is 0.721 (Table 8). Since the temporal experiment was run only on the smallest model, there is currently no evidence that the 14B configuration's rho=0.826 survives temporal separation. A temporal evaluation of the headline configuration (or a clear reframing of the claims to 'within-corpus ranking' rather than 'forecasting') is necessary to support the central claim.
- [§5.1, Table 8] The claimed 27-point improvement over prior state-of-the-art is computed by comparing rho=0.826 on ForeCite's biomedical corpus with rho=0.556 from Li et al. (which uses peer-review text) and rho=0.436 from CiMaTe (computational linguistics and biological domains), while R²=0.706 is compared with R²=0.4/0.454 from SChuBERT/MultiSChuBERT. These are cross-dataset comparisons: none of the baselines was re-implemented or evaluated on the ForeCite corpus. A state-of-the-art claim requires either re-running the baselines under the same train/test protocol or restricting the comparison to numbers obtained on the same benchmark. The raw improvement in Table 8 is a within-ForeCite result; the '27-point' wording is only valid if the baseline numbers are directly comparable.
- [§4.1, Eq. (1), Appendix E] The scaling-law extrapolation to Llama 4 Behemoth (r(288, 100)=0.9413, rho=0.9325) is used in §4.1 and §6 to argue that larger models would push performance 'significantly farther'. However, the tanh model of Eq. (1) is fitted to 25 points with p in [0.5, 14.8]B and d in [1, 16]%, then evaluated at p=288B and d=100%, far outside the fitted range. No confidence intervals, residual diagnostics, or held-out validation of the functional form are provided, and each grid point is a single run. The extrapolation should be explicitly labeled as speculative, with uncertainty quantification or a validation experiment on at least one larger model or data volume, before it is cited as evidence in the conclusion.
minor comments (7)
- [§3.1] 'medical articles publish between 2000 and 2024' should be 'medical articles published between 2000 and 2024'.
- [§5.1] 'This is support by our findings' should be 'This is supported by our findings'.
- [Appendix I] 'Figure I demonstrates' should refer to Figure 13, not the paper's section letter.
- [Abstract] The abstract states 'comprehensive scaling-law analysis ... data volumes' but data volumes never exceed 16% of the corpus; suggest saying 'fractions of the corpus up to 16%'.
- [§1] The 'Open science commitment' says code will be released upon publication, but no repository or data-access link is provided; please add the URL or state availability more concretely.
- [§4.1] The extrapolated MAE of approximately 0.03 is reported without explanation of how it is derived from the tanh fit; clarify the calculation.
- [Figure 4b] The '100% data∗' point is a theoretical estimate; the asterisk is explained only in the caption, and the fitted point could be more clearly distinguished from measured points.
Circularity Check
No circularity: the headline result is a measured held-out correlation and the scaling-law extrapolation is an explicit fit, so the derivation chain does not reduce to its own inputs.
full rationale
The paper's central claim is empirical rather than derived: Qwen2.5-14B is trained on a 90/10 random split and evaluated on held-out test documents, giving rho=0.826 on the log-transformed average monthly citation target (Section 4.1, Appendix D Table 8). The target is computed from citation counts and publication dates and is never fed into the model, so the test correlation is not an input to training. The scaling-law extrapolation is openly a least-squares fit to the measured grid: Equation (1) defines f(p,d)=tanh(beta0+beta1 log2 p+beta2 log2 d), and Appendix E lists the fitted betas; calling r(288,100)=0.9413 a 'theoretical estimate' is an extrapolation from that fit, not a renamed refit of the predicted quantity. The temporal-holdout experiment is an independent robustness check using Bloom-560m, a model released before the 2023 test window; the decay from r=0.713 to r=0.511 is a validity concern for the random-split headline, but it is an evaluation limitation, not circular reasoning. The paper contains no load-bearing self-citations, does not import a uniqueness theorem from the authors' prior work, and does not adopt an ansatz solely by citation. The acknowledged limitations in Section 5.3 (single-run experiments, manual hyperparameter tuning, suboptimal minima) bear on reproducibility and optimization quality, not on circularity. Therefore no circular step is exhibited by the paper's own equations or argumentation.
Assumptions & free parameters
free parameters (8)
- Beta_0 (Pearson scaling law) =
0.6771
- Beta_1 (Pearson scaling law) =
0.0689
- Beta_2 (Pearson scaling law) =
0.0767
- Beta_0 (Spearman scaling law) =
0.6260
- Beta_1 (Spearman scaling law) =
0.0698
- Beta_2 (Spearman scaling law) =
0.0724
- QLoRA rank =
4
- QLoRA alpha =
8
assumptions (5)
- domain assumption Cumulative citation counts as of December 2024, divided by paper age, are a sufficient target variable for measuring future citation impact.
- domain assumption A random 90/10 split of papers published 2000-2024 approximates the distribution of future papers.
- ad hoc to paper The tanh scaling-law form f(p,d) = tanh(beta0 + beta1 log2 p + beta2 log2 d) remains valid outside the fitted range.
- domain assumption The Elsevier API keyword search with a maximum of 6K results per query yields a representative biomedical corpus.
- domain assumption QLoRA fine-tuning retains the base model's semantic knowledge sufficiently for regression.
Cite this review
Pith. "Pith review of ForeCite: Adapting Pre-Trained Language Models to Predict Future Citation Rates of Academic Papers." pith.science (2026). https://pith.science/paper/LNPSKJJN
@misc{pith2026250508941,
  author       = {Pith},
  title        = {Pith review of: ForeCite: Adapting Pre-Trained Language Models to Predict Future Citation Rates of Academic Papers},
  year         = {2026},
  howpublished = {\url{https://pith.science/paper/LNPSKJJN}},
  note         = {Machine review of arXiv:2505.08941}
}
abstract
Predicting the future citation rates of academic papers is an important step toward the automation of research evaluation and the acceleration of scientific progress. We present $\textbf{ForeCite}$, a simple but powerful framework to append pre-trained causal language models with a linear head for average monthly citation rate prediction. Adapting transformers for regression tasks, ForeCite achieves a test correlation of $\rho = 0.826$ on a curated dataset of 900K+ biomedical papers published between 2000 and 2024, a 27-point improvement over the previous state-of-the-art. Comprehensive scaling-law analysis reveals consistent gains across model sizes and data volumes, while temporal holdout experiments confirm practical robustness. Gradient-based saliency heatmaps suggest a potentially undue reliance on titles and abstract texts. These results establish a new state-of-the-art in forecasting the long-term influence of academic research and lay the groundwork for the automated, high-fidelity evaluation of scientific contributions.
Figures


Figures from the paper (9 more)




Reference graph
Works this paper leans on
-
[1]
W. S. N. Aiza, L. Shuib, N. Idris, and N. B. A. Normadhi. Features, techniques and evaluation in predicting articles’ citations: A review from years 2010–2023. Scientometrics, 129(1):1–29,
work page 2010
-
[5]
URL https://aclanthology.org/2023.findings-eacl.84/
doi: 10.18653/v1/ 2023.findings-eacl.84. URL https://aclanthology.org/2023.findings-eacl.84/. J. Hirako, R. Sasano, and K. Takeda. Cimate: Citation count prediction effectively leveraging the main text,
doi:10.18653/v1/ 2023
-
[8]
URL https://arxiv. org/abs/2001.08361. J. Li, X. Chen, E. Hovy, and D. Jurafsky. Visualizing and understanding neural models in nlp,
arXiv 2001
-
[11]
URL http://dx.doi.org/10.18653/v1/2020
doi: 10.18653/v1/2020.sdp-1.17. URL http://dx.doi.org/10.18653/v1/2020. sdp-1.17. A. Vaswani, N. Shazeer, N. Parmar, J. Uszkoreit, L. Jones, A. N. Gomez, L. Kaiser, and I. Polo- sukhin. Attention is all you need,
-
[12]
URL https://arxiv.org/abs/1706.03762. D. Wang, C. Song, and A.-L. Barab ´asi. Quantifying long-term scientific impact. Science, 342 (6154):127–132, Oct
-
[14]
10 A Hyperparameters Hyperparameters Group / Parameter Value Training Optimizer AdamW Learning Rate 1.0e-4 Learning Rate Scheduler Cosine Weight Decay 1.0e-2 Grad. Accum. Steps 4 Batch Size 2 Epochs 1 Fine-tuning Optimizer AdamW Learning Rate 1.0e-4 Learning Rate Scheduler Cosine Weight Decay 1.0e-2 Grad. Accum. Steps 16 Batch Size 1 Epochs 3 QLoRA Dropou...
work page 2022
-
[2013]
ISSN 1095-9203. doi: 10.1126/science.1237825. URL http: //dx.doi.org/10.1126/science.1237825. G. M. d. B. Wenniger, T. van Dongen, and L. Schomaker. Multischubert: Effective multimodal fusion for scholarly document quality prediction. arXiv preprint arXiv:2308.07971,
-
[2016]
URL https://arxiv.org/abs/1506.01066. S. Li, W. X. Zhao, E. J. Yin, and J.-R. Wen. A neural citation count prediction model based on peer review text. In K. Inui, J. Jiang, V . Ng, and X. Wan, editors, Proceedings of the 2019 Conference on Empirical Methods in Natural Language Processing and the 9th International Joint Conference on Natural Language Proce...
arXiv 2019
Show all 14 references
-
[2018]
URL https://arxiv.org/abs/1801.06146. A. Ib ´a˜nez, P. Larra ˜naga, and C. Bielza. Predicting citation count of bioinformatics papers within four years of publication. Bioinformatics, 25(24):3303–3309,
-
[2019]
doi: 10.18653/v1/D19-1497
Association for Computational Linguistics. doi: 10.18653/v1/D19-1497. URL https://aclanthology.org/D19-1497/. N. Pobiedina and R. Ichise. Citation count prediction as a link prediction problem. Applied Intelli- gence, 44:252–268,
-
[2020]
URL https://arxiv.org/abs/2005.14165. T. Chakraborty, S. Kumar, P. Goyal, N. Ganguly, and A. Mukherjee. Towards a stratified learning approach to predict future citation counts. In IEEE/ACM joint conference on digital libraries , pages 351–360. IEEE,
2005 arXiv
-
[2021]
URL https://arxiv.org/abs/2004.11207. J. Hirako, R. Sasano, and K. Takeda. Realistic citation count prediction task for newly published papers. In A. Vlachos and I. Augenstein, editors, Findings of the Association for Computational Linguistics: EACL 2023 , pages 1131–1141, Dub...
2004 arXiv
-
[2023]
URL https://arxiv.org/abs/2305.14314. Y . Hao, L. Dong, F. Wei, and K. Xu. Self-attention attribution: Interpreting information interactions inside transformer,
-
[2024]
URL https://arxiv.org/abs/2410.04404. J. Howard and S. Ruder. Universal language model fine-tuning for text classification,
Reviewed August 15, 2026 · model on record in the stance chip above.
Discussion (0). Continue with ORCID to comment.