New assignments of the CaH A²Pi-X²Sigma⁺ transitions in the sunspot umbral spectrum and effective temperature estimation using molecular lines
Pith reviewed 2026-06-26 07:14 UTC · model grok-4.3
The pith
New CaH line assignments in sunspot spectra allow effective umbral temperature estimate of around 4000 K.
A machine-rendered reading of the paper's core claim, the machinery that carries it, and where it could break.
Core claim
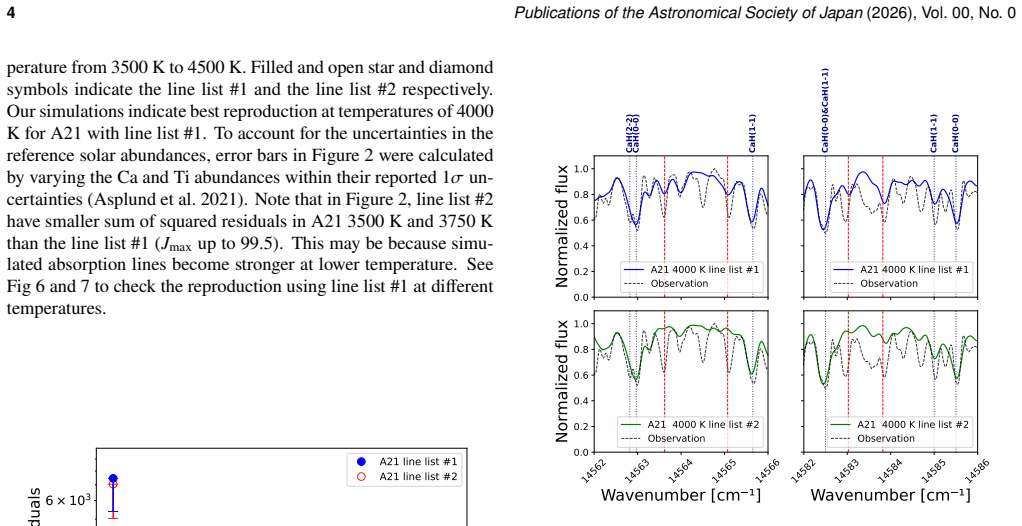
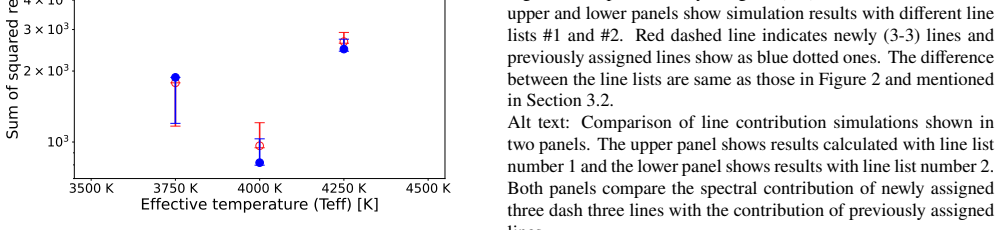
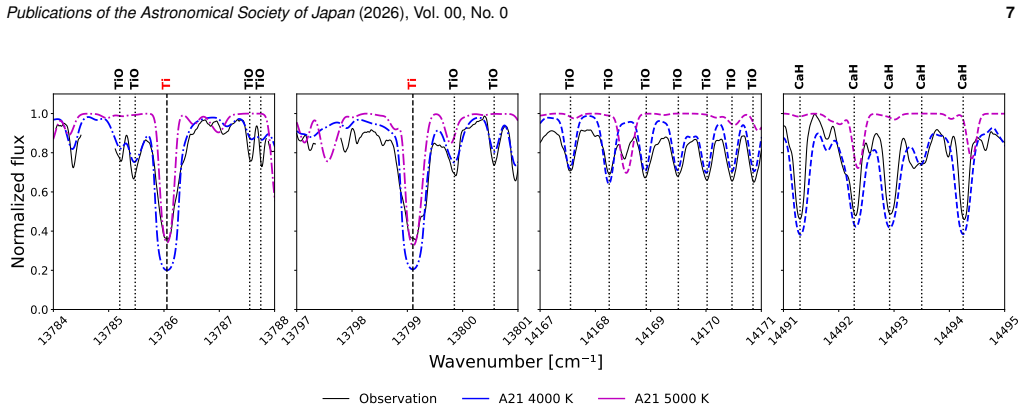
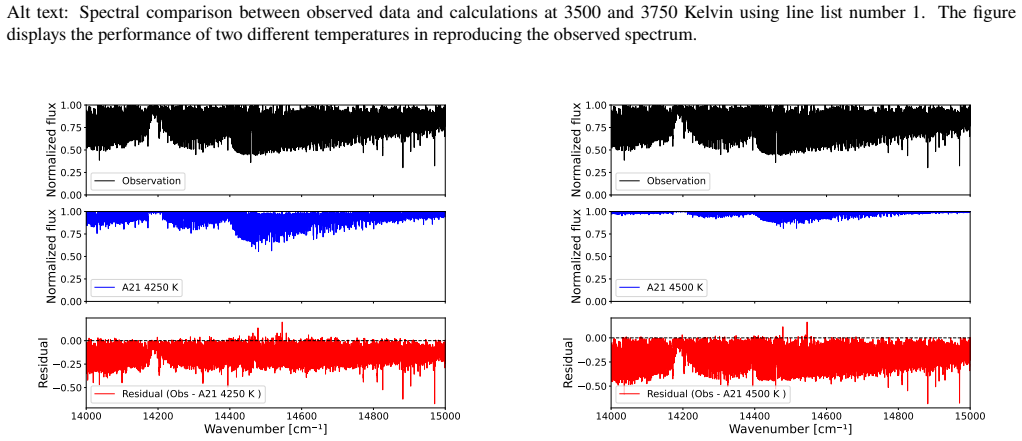
We report the assignment of 224 spectral lines of the CaH A²Π-X²Σ⁺ transition in the 14400-14900 cm^{-1} region of sunspot umbral spectra, with 75 lines in the (3-3) band reported for the first time and identifications extended to J_max ≈ 49.5. When these new identifications are included in spectral simulations accounting for TiO overlaps, the agreement with the observed spectrum improves modestly. Minimizing the residuals gives an effective umbral temperature of around 4000 K, consistent with formation in cool umbral cores.
What carries the argument
New assignments of CaH A²Π-X²Σ⁺ vibrational bands (v',v'' = 0-3) in sunspot spectra
If this is right
- Improved agreement between simulated and observed umbral spectra
- Effective temperature estimated at around 4000 K
- Molecular features form primarily in cool umbral cores
- Solar observations aid study of high-energy molecular transitions
- Molecular lines serve as thermometers for cool astronomical objects
Where Pith is reading between the lines
- Similar line assignment methods could enhance temperature estimates for other cool stars using molecular spectra
- Future higher-resolution observations might reveal additional CaH lines
- The temperature diagnostic could be tested on laboratory spectra or other solar features
- This work suggests molecular spectroscopy from sunspots can complement lab data for stellar atmosphere modeling
Load-bearing premise
The reported line assignments are accurate and the spectral model captures all significant features and constants without major unaccounted errors.
What would settle it
Laboratory spectroscopy confirming different positions or intensities for the assigned CaH lines in the 14400-14900 cm^{-1} region would disprove the identifications.
Figures
read the original abstract
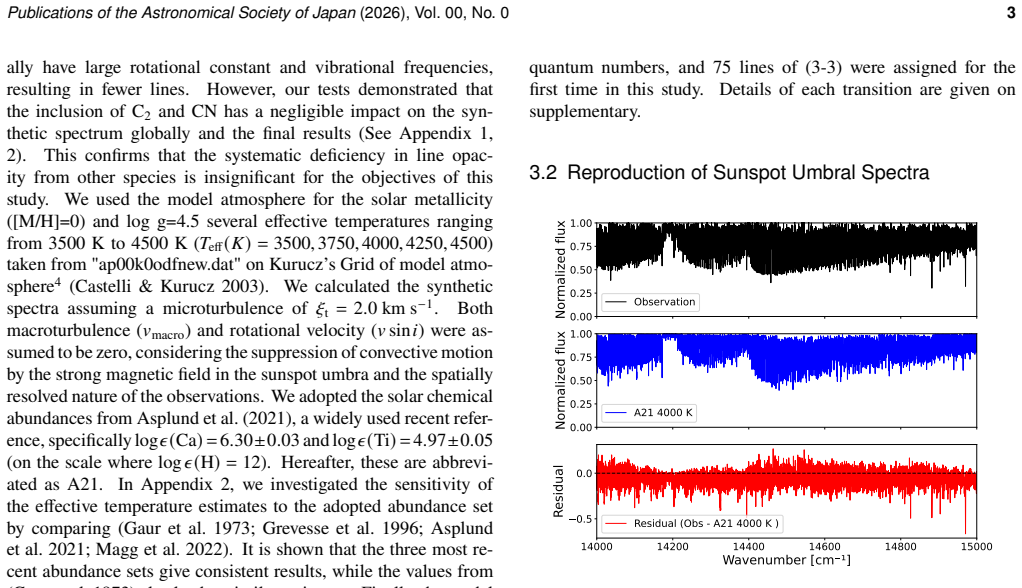
High-resolution spectroscopy observations of sunspots offer a unique natural laboratory for detailed molecular spectroscopy. Calcium monohydride (CaH) is a vital spectroscopic tracer in cool stellar and solar environments, where its electronic transitions are used for line identification and temperature diagnostics, yet its high-excitation transitions remain poorly characterized. Using high-resolution sunspot umbral spectra obtained with the Brault Fourier-transform spectrometer at the McMath-Pierce telescope (Wallace et al. 1999), we investigated the $A^2\Pi\;-\;X^2\Sigma^+$ electronic transition of CaH in the $\rm{14400-14900\;cm^{-1}}$ region. We report the assignment of 224 spectral lines spanning vibrational bands with $v^{\prime}, v^{\prime\prime} = 0\text{-}3$; notably, 75 lines in the (3-3) band are reported here for the first time, and the identification of the remaining bands was extended to significantly higher rotational quantum numbers ($J\rm{ _{max}\approx 49.5}$) compared to previous studies. Incorporating these new identifications into spectral simulations that account for overlapping TiO features, we aimed to reproduce the observed umbral spectrum and found modest but measurable improvement in the agreement between the simulated and observed spectra. Minimizing the residuals between observed and simulated spectra, we estimated an effective umbral temperature range of around 4000 K. We compare this effective temperature against those inferred from independent methods to show that molecular features primarily form in the cool umbral cores of the sunspots. This study demonstrates the utility of solar observations in studying the high-energy transitions that are challenging to reproduce in laboratory settings and the potential of molecular lines as sensitive "thermometers" for cool astronomical objects.
Editorial analysis
A structured set of objections, weighed in public.
Referee Report
Summary. The paper reports new assignments of 224 lines in the CaH A²Π–X²Σ⁺ transition from high-resolution sunspot umbral spectra in the 14400–14900 cm⁻¹ region, including 75 previously unreported lines in the (3-3) band and extensions of other bands to J_max ≈ 49.5. These assignments are incorporated into spectral simulations that include overlapping TiO features; residual minimization between simulated and observed spectra yields an effective umbral temperature of ~4000 K, stated to be consistent with independent methods and to demonstrate the utility of molecular lines as thermometers.
Significance. If the line assignments are robust, the work provides new high-J laboratory-free data on CaH transitions that are difficult to access in terrestrial experiments and illustrates the diagnostic value of molecular features in cool stellar atmospheres. The approach of using solar spectra to extend rotational coverage is a strength, but the absence of quantified extrapolation checks or independent verification limits the immediate impact on molecular databases or temperature scales.
major comments (2)
- [Abstract (line-assignment paragraph)] The assignment of the 75 new (3-3) lines and the extension to J ≈ 49.5 rests on extrapolation of molecular constants (presumably from prior laboratory work) without any reported quantification of position uncertainties, centrifugal-distortion covariance, or comparison to independent laboratory spectra at high J. This is load-bearing for the central claim because the subsequent spectral simulation and residual-minimization temperature fit use precisely these assigned lines.
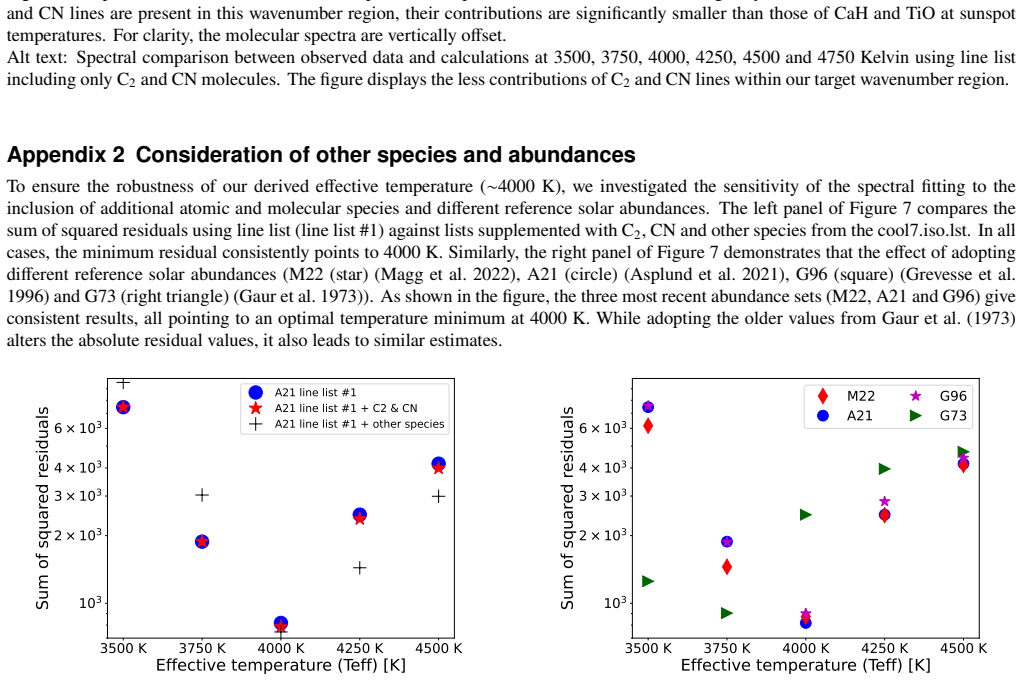
- [Abstract (temperature-estimation paragraph)] The effective temperature (~4000 K) is obtained by minimizing residuals between the model (incorporating the newly assigned CaH lines plus TiO) and the same observed spectrum used for the assignments. No independent validation (e.g., comparison to a temperature derived from atomic lines or a different molecular species on the identical dataset) is described, so the reported value is a fit result rather than a test of the assignments.
minor comments (2)
- [Abstract] The abstract states that the new identifications produce “modest but measurable improvement” but provides no quantitative metric (e.g., rms residual reduction or χ² change) or figure showing the before/after comparison.
- [Abstract] No error bars or confidence intervals are attached to the reported temperature range or to the line positions.
Simulated Author's Rebuttal
We thank the referee for their careful reading and constructive comments on our manuscript. We respond to each major comment below, indicating where the manuscript will be revised.
read point-by-point responses
-
Referee: [Abstract (line-assignment paragraph)] The assignment of the 75 new (3-3) lines and the extension to J ≈ 49.5 rests on extrapolation of molecular constants (presumably from prior laboratory work) without any reported quantification of position uncertainties, centrifugal-distortion covariance, or comparison to independent laboratory spectra at high J. This is load-bearing for the central claim because the subsequent spectral simulation and residual-minimization temperature fit use precisely these assigned lines.
Authors: We agree that the assignments of the new high-J lines, including the 75 (3-3) features, are based on extrapolation of published molecular constants and that the manuscript does not quantify the associated position uncertainties or covariance effects. This is a substantive limitation for the robustness of the line list. In the revised version we will add an explicit discussion of the constants adopted, the J-range of the extrapolation, and a simple estimate of line-position uncertainties derived from the reported constant errors. We will also note that no independent high-J laboratory spectra exist for direct comparison, which is precisely why astrophysical data are used here, while cautioning readers on the assignments. revision: yes
-
Referee: [Abstract (temperature-estimation paragraph)] The effective temperature (~4000 K) is obtained by minimizing residuals between the model (incorporating the newly assigned CaH lines plus TiO) and the same observed spectrum used for the assignments. No independent validation (e.g., comparison to a temperature derived from atomic lines or a different molecular species on the identical dataset) is described, so the reported value is a fit result rather than a test of the assignments.
Authors: The referee is correct that the temperature is obtained by residual minimization on the identical spectrum used for the assignments and that no cross-check with atomic lines or another molecular species on the same data is presented. The manuscript instead shows that inclusion of the new CaH lines modestly improves the fit and that the resulting ~4000 K value is consistent with temperatures reported in the literature from independent methods. We will revise the text to state explicitly that the temperature serves as a consistency demonstration rather than an independent validation of the line assignments, and we will add a brief discussion of this methodological limitation. revision: yes
Circularity Check
No significant circularity detected
full rationale
The paper reports observational line assignments in the sunspot spectrum and derives an effective temperature by explicit minimization of residuals between simulated and observed spectra using those assignments. This is a standard parameter-fitting procedure presented as an estimation, with direct comparison to independent temperature methods from other techniques. No quoted text shows a self-definitional relation, a fitted quantity renamed as a prediction, or a central claim that reduces by construction to a self-citation or input. The derivation chain remains self-contained against external benchmarks and observed data.
Axiom & Free-Parameter Ledger
free parameters (1)
- effective umbral temperature =
~4000 K
axioms (1)
- domain assumption Spectral simulation with CaH and TiO lines accurately reproduces the observed umbral spectrum when temperature is adjusted
Reference graph
Works this paper leans on
-
[1]
F., & Shayesteh, A
Alavi, S. F., & Shayesteh, A. 2017, MNRAS, 474, 2
2017
-
[2]
1981, Sol
Albregtsen, F., & Maltby, P. 1981, Sol. Phys., 71, 269
1981
-
[3]
M., & Grevesse, N
Asplund, M., Amarsi, A. M., & Grevesse, N. 2021, A&A, 653, A141
2021
-
[4]
P., Gregorio-hetem, J., Singh, P
Barbuy, B., Schiavon, R. P., Gregorio-hetem, J., Singh, P. D., & Batalha, C. 1993, A&AS, 101, 409
1993
-
[5]
Behere, S., Deshmukh, B., Patil, S., & Behere, S. H. 2020, in AIP Conf. Proc., Vol. 2224, AIP Conf. Proc., 020001
2020
-
[6]
D., Herman, M., Johns, J
Bell, G. D., Herman, M., Johns, J. W. C., & Peck, E. R. 1979, Phys. Scr., 20, 609
1979
-
[7]
V., Solanki, S
Berdyugina, S. V., Solanki, S. K., & Frutiger, C. 2003, A&A, 412, 513 Bernath,P.2016,SpectraofAtomsandMolecules(OxfordUniversityPress)
2003
-
[8]
Boyer, R., Sotirovski, P., & Harvey, J. W. 1976, A&AS, 24, 111
1976
-
[9]
2000, Dr
Bradski, G. 2000, Dr. Dobb’s Journal of Software Tools
2000
-
[10]
Bray, R. J. 1981, Sol. Phys., 69, 3 Brewer,J.M.,Fischer,D.A.,Valenti,J.A.,&Piskunov,N.2016,ApJS,225, 32
1981
-
[11]
Castelli, F., & Kurucz, R. L. 2003, in IAU Symposium, Vol. 210, Modelling ofStellarAtmospheres,ed.N.Piskunov,W.W.Weiss,&D.F.Gray,A20
2003
-
[12]
1994, Astronomy & Astrophysics, 291, 622
Vazquez, M. 1994, Astronomy & Astrophysics, 291, 622
1994
-
[13]
2021, A&A, 651, A33
Cont, D., Yan, F., Reiners, A., et al. 2021, A&A, 651, A33
2021
-
[14]
1973, A&AS, 10, 11
Engvold, O. 1973, A&AS, 10, 11
1973
-
[15]
2009, New Astronomy, 14, 708
Fawzy, D. 2009, New Astronomy, 14, 708
2009
-
[16]
1907, Proceedings of the Royal Society of London Series A, 79, 509
Fowler, A. 1907, Proceedings of the Royal Society of London Series A, 79, 509
1907
-
[17]
2025b, Chemical Physics Letters, 142234 Gaur,V.P.,Pande, M.C.,&Tripathi,B.M.1973, Bull.Astron.Inst.Czech., 24, 138
Furuta, J., Watanabe, K., Moriwaki, Y., et al. 2025b, Chemical Physics Letters, 142234 Gaur,V.P.,Pande, M.C.,&Tripathi,B.M.1973, Bull.Astron.Inst.Czech., 24, 138
1973
-
[18]
R., Line, M
Gharib-Nezhad, E., Iyer, A. R., Line, M. R., et al. 2021, ApJS, 254, 34
2021
-
[19]
Gizis, J. E. 1997, AJ, 113, 806
1997
-
[20]
O., & Corbally, C
Gray, R. O., & Corbally, C. J. 1994, AJ, 107, 742
1994
-
[21]
Grevesse, N., Noels, A., & Sauval, A. J. 1996, 99, 117
1996
-
[22]
J., Beaulieu, T
Jao, W.-C., Henry, T. J., Beaulieu, T. D., & Subasavage, J. P. 2008, AJ, 136, 840
2008
-
[23]
C., Wang, J., Asnodkar, A
Johnson, M. C., Wang, J., Asnodkar, A. P., et al. 2023, AJ, 165, 157
2023
-
[24]
2014, A&A, 565, A52
Kiess, C., Rezaei, R., & Schmidt, W. 2014, A&A, 565, A52
2014
-
[25]
Kirkpatrick, J. D. 2005, A&A, 43, 195
2005
-
[26]
M., & Zhao, L
Komori, C., Brewer, J. M., & Zhao, L. L. 2025, AJ, 170, 209 Lépine, S., & Scholz, R.-D. 2008, ApJL, 681, L33
2025
-
[27]
2022, A&A, 661, A140
Magg, E., Bergemann, M., Serenelli, A., et al. 2022, A&A, 661, A140
2022
-
[28]
1968, Sol
Makita, M. 1968, Sol. Phys., 3, 557
1968
-
[29]
1970, Sol
Maltby, P. 1970, Sol. Phys., 13, 312
1970
-
[30]
K., Martínez Pillet, V., Solanki, S
Mathew, S. K., Martínez Pillet, V., Solanki, S. K., & Krivova, N. A. 2007, A&A, 465, 291
2007
-
[31]
2003, Sol
Neckel, H. 2003, Sol. Phys., 212, 239
2003
-
[32]
1994, Sol
Neckel, H., & Labs, D. 1994, Sol. Phys., 153, 91
1994
-
[33]
K., Kawahara, H., Masuda, K., et al
Nugroho, S. K., Kawahara, H., Masuda, K., et al. 2017, AJ, 154, 221
2017
-
[34]
1908, Carnegie Inst
Olmsted, C. 1908, Carnegie Inst. Wash. Contr. Solar Obs., 21, 1
1908
-
[35]
2023, RAA, 23, 065010
Ouyang, Q., Wang, W., Zhai, M., et al. 2023, RAA, 23, 065010
2023
-
[36]
2022, MNRAS, 511, 5448
Owens, A., Dooley, S., McLaughlin, L., et al. 2022, MNRAS, 511, 5448
2022
-
[37]
C., Asnodkar, A
Petz, S., Johnson, M. C., Asnodkar, A. P., et al. 2025, AJ, 169, 267 Ram,R.,Tereszchuk,K.,Gordon,I.,Walker,K.,&Bernath,P.2011,Journal of Molecular Spectroscopy, 266, 86
2025
-
[38]
S., Bernath, P
Ram, R. S., Bernath, P. F., Dulick, M., & Wallace, L. 1999, ApJS, 122, 331
1999
-
[39]
N., Gizis, J
Reid, I. N., Gizis, J. E., Cohen, J. G., et al. 1997, PASP, 109, 559
1997
-
[40]
Richardson, R. S. 1931, ApJ, 73, 216
1931
-
[41]
J., Kawaguchi, K., et al
Sakamoto, S., White, G. J., Kawaguchi, K., et al. 1998, Monthly Notices of the Royal Astronomical Society, 301, 872
1998
-
[42]
Sedaghati, E., Boffin, H. M. J., MacDonald, R. J., et al. 2017, Nature, 549, 238
2017
-
[43]
F., Rahman, M., & Gharib-Nezhad, E
Shayesteh, A., Alavi, S. F., Rahman, M., & Gharib-Nezhad, E. 2017, Chem. Phys. Lett., 667, 345
2017
-
[44]
S., & Bernath, P
Shayesteh, A., Ram, R. S., & Bernath, P. F. 2013, J. Mol. Spectrosc., 288, 46
2013
-
[45]
N., Holzreuter, R., van Noort, M., & Solanki, S
Smitha, H. N., Holzreuter, R., van Noort, M., & Solanki, S. K. 2021, A&A, 647, A46
2021
-
[46]
Solanki, S. K. 2003, A&AR, 11, 153
2003
-
[47]
1971, A&A, 14, 319 Sriramachandran,P.,Bagare,S.P.,Rajamanickam,N.,&Balachandrakumar, K
Sotirovski, P. 1971, A&A, 14, 319 Sriramachandran,P.,Bagare,S.P.,Rajamanickam,N.,&Balachandrakumar, K. 2008, Solar Physics, 252, 267
1971
-
[48]
2020, Sol
Shanmugavel, R. 2020, Sol. Phys., 295, 169
2020
-
[49]
2011, Ap&SS, 336, 379
Sriramachandran, P., & Shanmugavel, R. 2011, Ap&SS, 336, 379
2011
-
[50]
2013, Sol
Sriramachandran, P., Viswanathan, B., & Shanmugavel, R. 2013, Sol. Phys., 286, 315
2013
-
[51]
K., & Yurchenko, S
Tennyson, J., Hulme, K., Naim, O. K., & Yurchenko, S. N. 2016, Journal of Physics B: Atomic, Molecular and Optical Physics, 49, 044002
2016
-
[52]
1999, AJ, 524, 454
Wallace, L., Hinkle, K., Li, G., & Bernath, P. 1999, AJ, 524, 454
1999
-
[53]
Wallace, L., Hinkle, K., & Livingston, W. C. 2005, An Atlas of Sunspot Umbral Spectra in the Visible from 15,000 to 25,500 cm−1 (3,920 to 6,664Å),NSOTechnicalReportNo.05-001(Tucson,AZ:NationalSolar Observatory)
2005
-
[54]
H., Livingston, W
Wallace, L., Hinkle, K. H., Livingston, W. C., & Davis, S. P. 2011, ApJS, 195, 6
2011
-
[55]
C., Bernath, P
Wallace, L., Livingston, W. C., Bernath, P. F., & Ram, R. S. 1999, An Atlas of the Sunspot Umbral Spectrum in the Red and Infrared from 8,900 to 15,050 cm−1 (6642 to 11,230 Å), Revised, NSO Technical Report No. 99-001 (Tucson, AZ: National Solar Observatory)
1999
-
[56]
Watanabe, K., Tani, I., Kobayashi, K., Moriwaki, Y., & Ross, S. C. 2018, Chem. Phys. Lett., 710, 11 Watanabe,K.,Yoneyama,N.,Uchida,K.,etal.2016,Chem.Phys.Lett.,657, 1
2018
-
[57]
Webber, J. C. 1971, Sol. Phys., 16, 340
1971
-
[58]
Western, C. M. 2017, JQSRT, 186, 221, satellite Remote Sensing and Spectroscopy: Joint ACE-Odin Meeting, October 2015
2017
-
[59]
2019, A&A, 632, A69
Yan, F., Casasayas-Barris, N., Molaverdikhani, K., et al. 2019, A&A, 632, A69
2019
discussion (0)
Sign in with ORCID, Apple, or X to comment. Anyone can read and Pith papers without signing in.