REVIEW 3 major objections 8 minor 22 references
Characterizing Photonic Ring Resonator Filters for OH Suppressed Near-infrared Astronomy
T0 review · 3 major / 8 minor · reviewed 2026-07-07 · glm-5.2
Pith's one-line read Quadratic law predicts where ring resonator filters suppress light
desk verdict Honest prototype characterization with a reasonable qualitative finding but statistically fragile quantitative claims. The quadratic model for suppressed-wavelength progression is probably directionally correct, but the evidence is thin. read the letter →
The pith
A machine-rendered reading of the paper's core claim, the machinery that carries it, and where it could break.
The reading
What carries the argument
The free spectral range (FSR) of a ring resonator, which governs the spacing between consecutive resonance wavelengths; the group refractive index n_g, which determines phase delay in the waveguide and is shown to vary linearly with wavelength for this silicon device; and the resonance condition (φ = 2πm), which selects which wavelengths are suppressed at each integer order m.
What would settle it
If the suppressed wavelength at order 6 for dips other than the third were measured with a calibrated dip-fitter and deviated from the quadratic-linear prediction by more than the ~1 nm agreement seen for the third dip, the quadratic model would be undermined.
Extended reading notes
Core claim
The suppressed wavelengths of photonic ring resonator filters follow a quadratic dependence on resonance order, arising from the wavelength-dependence of the group refractive index in the waveguide material. By replacing the constant group refractive index assumption with a linear wavelength-dependent term (n_g = n_0 + n_1·λ), the free spectral range acquires quadratic corrections that explain the observed curvature in the progression of suppressed wavelengths across orders. This provides a predictive model for placing suppression dips at target OH emission wavelengths across a broader spectral range than the device was originally fabricated for.
Load-bearing premise
The quadratic model for suppressed wavelength is established from only four lower-order data points per dip and corroborated by a single experimental measurement at order 6 for one dip; the remaining four upper H-band dip locations were read by eye from an unflattened spectrum where dips overlap, so the model's validity across all dips and orders rests on limited evidence.
Editorial extensions
If this is right
- If the quadratic model holds across more orders and devices, PRR filters fabricated for one wavelength band could be predictably characterized and tuned for OH suppression across adjacent bands without fabricating entirely new chips.
- The wavelength-dependence of the group refractive index is a critical parameter that must be measured or modeled for each PRR material and geometry; assuming it constant leads to large prediction errors (chi-squared values of 10,000+).
- The broadening and blending of dips at higher orders (FWHM grows roughly as λ²) sets a practical upper limit on how many OH lines a single PRR can suppress before adjacent dips become unresolvable.
- Reliable extraction of dip depth and FWHM at higher orders remains an unsolved problem; without accurate predictions of these metrics, total OH suppression cannot be guaranteed.
Reading between the lines
- The quadratic model is fitted to only four data points per dip and validated against a single upper H-band measurement; a denser sampling of orders (e.g., m = 5 and m = 7) would more rigorously test whether the quadratic term suffices or a cubic correction is needed, as the Taylor expansion of the FSR with linear n_g(λ) actually contains cubic terms.
- If the linear wavelength-dependence of n_g can be independently measured (e.g., via ellipsometry or interferometry on the same silicon wafer), the quadratic-linear model could become fully predictive rather than fitted, reducing the number of free parameters and strengthening extrapolation confidence.
- The dip broadening problem at higher orders suggests that future PRR designs for upper H-band suppression may need smaller ring circumferences or different waveguide materials with lower dispersion to keep FWHM within the ~0.2 nm target for effective OH line suppression.
Signed reviews
Editorial analysis
A structured set of objections, weighed in public.
Referee Report
Summary. This manuscript characterizes a prototype photonic ring resonator (PRR) filter (ANT-07) for OH suppression in near-infrared astronomy, extending prior lower H-band (1480–1620 nm) measurements into the upper H-band (1620–1665 nm). The authors measure suppressed wavelengths, FWHM, and depth for the first four orders of five dips, fit polynomial models to these data, and extrapolate to the sixth order. They conclude that suppressed wavelengths progress quadratically with order, consistent with a wavelength-dependent group refractive index, while depth and FWHM show no reliable trend. The sixth-order predictions are compared against visual-inspection measurements from an unflattened upper H-band spectrum.
Significance. The paper addresses a practical instrumentation problem—extending PRR-based OH suppression to the upper H-band—and provides a transparent, falsifiable comparison of linear versus quadratic-linear models for wavelength progression. The theoretical motivation via a linear wavelength-dependent group refractive index (Eqs. 5–6) is a reasonable physical extension of the standard FSR formula. The work is incremental but appropriate for a prototype characterization study. The target venue (JAAVSO) appears suitable for this type of instrumentation development paper.
major comments (3)
- §4, Eq. (4) and surrounding text: The chi-squared statistic uses σ = 10 pm for suppressed wavelengths, described as the laser resolution. However, the actual uncertainty on the DF suppressed wavelengths extracted by the dip-fitting script is not established. The script is documented to fail for depth and FWHM on most dips (§4), and DF vs. VI suppressed wavelengths differ by up to ~0.3 nm in some cases (Table 1 vs. Table 5). If the true fitting uncertainty is ~0.1–0.5 nm rather than 0.01 nm, the absolute chi-squared values in Table 2 (ranging from 3.8 to 14,184) cannot be interpreted for goodness-of-fit. The ratio between linear and quadratic-linear chi-squared is preserved, so the model selection direction is unaffected, but the claim that the quadratic-linear model provides an acceptable fit (as opposed to merely a better-than-linear fit) is not currently supported. The authors should (
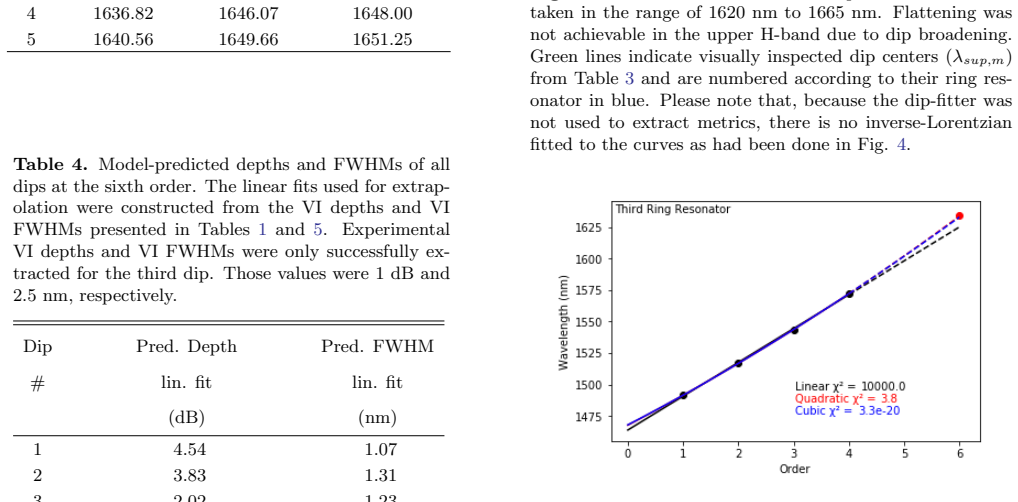
- §4, Table 3 and Fig. 5: The sixth-order experimental validation relies entirely on visually inspected dip centers from an unflattened, blended spectrum with no quantified uncertainty. The quadratic-linear predictions agree with these measurements to within 0.1–1.9 nm (Table 3), which is clearly better than the linear model's 7–11 nm errors. However, without any uncertainty estimate on the visual inspection, the statistical significance of this agreement cannot be assessed. The authors should provide at minimum a rough uncertainty estimate for the visual measurements (e.g., based on dip width and blending).
- §5, Eqs. (5)–(6): The theoretical derivation introduces n0 and n1 as parameters in ng(λ) = n0 + n1λ, but these are never fitted or constrained from the data. The quadratic-linear fit to suppressed wavelengths is a purely empirical polynomial fit; it is not derived from or constrained by Eqs. (5)–(6). The claim that the quadratic progression is 'consistent with the theoretical dependence' (§7) would be strengthened if the authors could extract n0 and n1 from their fit and check whether the values are physically reasonable for silicon waveguides, or at least clarify that the theoretical derivation provides qualitative motivation rather than quantitative prediction.
minor comments (8)
- §1: The abstract and introduction motivate the work with supernova cosmology and OH suppression, but the connection between the specific prototype measurement (orders 1–6 of one device) and the broader astronomical application could be stated more directly.
- §2, Eq. (2): The notation λres,m = mλres = mLng is slightly ambiguous; the relationship between λres and Lng should be stated more explicitly.
- §4, Table 2: The caption refers to 'quad-lin. fit' while the text uses 'quadratic-linear' and §5 uses 'linear-quadratic'. Consistent naming would help.
- §4, Table 5 footnote: The footnote text is garbled ('1585 a · · ·3.3· · ·1.10'). This should be corrected.
- §5: The phrase 'linear-quadratic fit' is used where 'quadratic-linear' is used elsewhere. Consistent naming would help.
- Fig. 5: The green lines indicating dip centers are helpful but the dip numbering in blue could be larger or placed more clearly to improve readability.
- §6: The future work items are reasonable but somewhat lengthy; the licensing/construction paragraph could be shortened or removed as it is not directly relevant to the scientific findings.
- Table 4: Predicted depths for dips 4 and 5 are negative (-0.72 and -0.39 dB), which is unphysical. This should be noted and discussed, or the predictions should be presented without comment.
Simulated Author's Rebuttal
We thank the referee for a careful and constructive report. All three major comments identify legitimate weaknesses that we can and should address in revision. We agree fully with Comments 1 and 2 and will revise accordingly. For Comment 3, we agree that the theoretical derivation should be clarified as qualitative motivation rather than quantitative prediction, and will revise the text; extracting physically constrained values of n0 and n1 from our data is not straightforward with the current four-point fits, and we explain why below.
read point-by-point responses
-
Referee: §4, Eq. (4): The chi-squared statistic uses σ = 10 pm (laser resolution), but the actual uncertainty on DF suppressed wavelengths extracted by the dip-fitting script is not established. The script fails for depth and FWHM on most dips, and DF vs. VI suppressed wavelengths differ by up to ~0.3 nm. If the true fitting uncertainty is ~0.1–0.5 nm, absolute chi-squared values cannot be interpreted for goodness-of-fit. The model selection direction is preserved, but the claim that the quadratic-linear model provides an acceptable fit is not supported.
Authors: The referee is correct on all points. The 10 pm value reflects the laser step size and spectrum granularity, not the uncertainty on the dip-fitting script's extracted suppressed wavelength. The discrepancies between DF and VI suppressed wavelengths (up to ~0.3 nm in Table 1 vs. Table 5) make clear that the true fitting uncertainty is larger than 10 pm, likely in the 0.1–0.5 nm range as the referee suggests. We agree that the absolute chi-squared values in Table 2 therefore cannot be interpreted for goodness-of-fit; only the ratio between linear and quadratic-linear chi-squared is meaningful for model selection. We will revise the manuscript to (1) explicitly state that σ = 10 pm represents the measurement granularity rather than the fitting uncertainty, (2) acknowledge that the true fitting uncertainty is not yet established and is likely orders of magnitude larger, (3) remove or qualify the claim that the quadratic-linear model provides an acceptable fit, replacing it with the more limited claim that the quadratic-linear model is strongly preferred over the linear model, and (4) note that proper goodness-of-fit assessment awaits improved characterization of the dip-fitting script's uncertainties. revision: yes
-
Referee: §4, Table 3 and Fig. 5: The sixth-order experimental validation relies entirely on visually inspected dip centers from an unflattened, blended spectrum with no quantified uncertainty. The quadratic-linear predictions agree to within 0.1–1.9 nm, but without any uncertainty estimate on the visual inspection, the statistical significance of this agreement cannot be assessed. The authors should provide at minimum a rough uncertainty estimate.
Authors: We agree. The visual inspection measurements were made on an unflattened spectrum with significant blending, and we did not assign uncertainties to these measurements. We will provide a rough uncertainty estimate in the revised manuscript. Based on the dip widths (FWHM ~2.5 nm for the third dip at sixth order, and broader for other dips) and the degree of blending visible in Fig. 5, we estimate that the visual inspection uncertainty on suppressed wavelength is approximately ±1–2 nm for the third dip (which is relatively isolated) and approximately ±2–4 nm for the more blended dips. We will add these estimates to Table 3 and discuss their implications: the quadratic-linear predictions for the third dip (0.5 nm agreement) are within this uncertainty, while for the more blended dips the agreement (0.1–1.9 nm) is comparable to the estimated uncertainty. We will also note explicitly that the sixth-order validation is qualitative rather than statistically rigorous, and that a proper test requires an improved spectrum (flattened, higher SNR) and automated dip-fitting. revision: yes
-
Referee: §5, Eqs. (5)–(6): n0 and n1 are introduced as parameters in ng(λ) = n0 + n1λ but are never fitted or constrained from the data. The quadratic-linear fit is purely empirical. The claim that the quadratic progression is 'consistent with the theoretical dependence' would be strengthened if the authors could extract n0 and n1 and check whether they are physically reasonable, or at least clarify that the theoretical derivation provides qualitative motivation rather than quantitative prediction.
Authors: The referee is correct that the quadratic-linear fit is purely empirical and is not derived from or constrained by Eqs. (5)–(6). We will revise the manuscript to clarify this distinction explicitly: the theoretical derivation in §5 provides qualitative motivation for expecting a quadratic component in the wavelength progression, but the fit itself is an empirical polynomial. We agree that extracting n0 and n1 from the fit and checking their physical reasonableness would strengthen the paper. However, doing so rigorously is not straightforward with our current data. The empirical quadratic-linear fit has three free parameters fitted to four data points per dip, leaving only one degree of freedom. Mapping these empirical coefficients back to n0 and n1 requires knowledge of the ring circumference L (which is set during fabrication but has manufacturing tolerances) and the relationship between the empirical fit parameters and the physical model parameters, which involves the Taylor expansion in Eq. (6). With only four data points and uncertain fitting errors, the resulting constraints on n0 and n1 would be too weak to be physically meaningful. We will state this limitation transparently and frame the theoretical derivation as qualitative motivation. We will also soften the claim in §7 from 'consistent with the theoretical dependence' to 'qualitatively consistent with the expectation from a wavelength-dependent group refractive index.' revision: partial
Circularity Check
No significant circularity. The central claim is an empirical extrapolation with independent experimental verification; the theoretical justification is post-hoc but not self-referential.
full rationale
The paper's derivation chain is: (1) measure suppressed wavelengths at m=1–4 in the lower H-band, (2) fit linear and quadratic-linear polynomial models to those four points per dip, (3) extrapolate to m=6, (4) measure m=6 experimentally in the upper H-band, (5) compare predictions to experiment (Table 3). This is standard empirical extrapolation with an independent check. The chi-squared comparison (Table 2) is a goodness-of-fit measure on the training data, not a prediction, but the paper does not present it as such—it presents the m=6 experimental comparison as the independent validation. The theoretical justification (Eq. 5–6) introduces n_g(λ) = n_0 + n_1·λ motivated by a private communication from a collaboration member, and shows via Taylor expansion that this produces quadratic terms in the FSR. This is post-hoc qualitative motivation, not a derivation that feeds its own outputs back as inputs; n_0 and n_1 are never quantified or fitted, so there is no self-definitional loop. The citation to Ellis et al. 2023 (co-author S. Ellis) for standard results (FWHM ∝ λ², n_g not constant with wavelength) is a minor self-citation for well-known physics, not a load-bearing uniqueness theorem. The paper's weaknesses—few data points, visual inspection uncertainties, overstated claims about 'quantifying coefficients in Eq. 3'—are correctness and statistical concerns, not circularity.
Assumptions & free parameters
free parameters (4)
- Polynomial fit coefficients (linear and quadratic-linear models for suppressed wavelength) =
Not explicitly tabulated; determined by least-squares minimization on 4 data points per dip
- n0 (base group refractive index) =
Not explicitly given; implicitly determined through polynomial fits
- n1 (linear wavelength-dependent dispersion term) =
Not explicitly given; sourced from private communication (P. Liu)
- Sigma assumptions for chi-squared (10 pm for wavelength, 0.25 dB for depth/FWHM) =
10 pm and 0.25 dB
assumptions (4)
- domain assumption The group refractive index n_g varies linearly with wavelength (Eq. 5)
- standard math The FSR formula (Eq. 3) accurately describes the PRR's resonance spacing
- ad hoc to paper Measurement uncertainties are constant across all orders
- ad hoc to paper Visual inspection provides reliable estimates of dip depth and FWHM
Cite this review
Pith. "Pith review of Characterizing Photonic Ring Resonator Filters for OH Suppressed Near-infrared Astronomy." pith.science (2026). https://pith.science/paper/MTDMHWBC
@misc{pith2026260705351,
  author       = {Pith},
  title        = {Pith review of: Characterizing Photonic Ring Resonator Filters for OH Suppressed Near-infrared Astronomy},
  year         = {2026},
  howpublished = {\url{https://pith.science/paper/MTDMHWBC}},
  note         = {Machine review of arXiv:2607.05351}
}
read the original abstract
Supernova cosmology relies on accurate measurement of the absolute magnitudes of Type Ia supernovae. Observation in the visible incurs significant systematic uncertainties in these measurements due to their high degree of interstellar dust extinction. Observing in the near-infrared (750-2500 nm) mitigates this issue by decreasing attenuation, decreasing dispersion, and increasing supernova observation distances. However, ground-based observations in the near-infrared suffer from sky background caused by atmospheric OH emission lines. Advancements in photonic ring resonator filter devices make it feasible to suppress these lines. In this paper, we evaluate the performance of a prototype photonic ring resonator device developed for use in the lower H-band (1480-1620 nm). Specifically, we characterize the progression of suppressed wavelengths into the upper H-band (1620-1800 nm) enabling the suppression of emission lines over a broader wavelength range.
Figures


Figures from the paper (4 more)



Reference graph
Works this paper leans on
-
[1]
Avelino, A., Friedman, A. S., Mandel, K. S., et al. 2019, ApJ, 887, 106, doi: 10.3847/1538-4357/ab2a16
-
[2]
Barone-Nugent, R. L., Lidman, C., Wyithe, J. S. B., et al. 2012, MNRAS, 425, 1007, doi: 10.1111/j.1365-2966.2012.21412.x Batista de Nazar´ e, F. V., da Silva Barros Allil, R. C., &
-
[3]
Werneck, M. M. 2017, Fiber Bragg Gratings: Theory, Fabrication, and Applications, doi: https://doi.org/10.1117/3.2286558.ch3
-
[4]
2011, AJ, 142, 31, doi: 10.1088/0004-6256/142/1/31 Non-spherical Void Galaxies11
Blanton, M. R., Kazin, E., Muna, D., et al. 2011, AJ, 142, 31, doi: 10.1088/0004-6256/142/1/31
-
[5]
2012, Laser & Photonics Reviews, 6, 47, doi: 10.1002/lpor.201100017
Bogaerts, W., De Heyn, P., Van Vaerenbergh, T., et al. 2012, Laser & Photonics Reviews, 6, 47, doi: 10.1002/lpor.201100017
-
[6]
Pantheon+ Cosmological Constraints,
Brout, D., Scolnic, D., Popovic, B., et al. 2022, ApJ, 938, 110, doi: 10.3847/1538-4357/ac8e04
-
[7]
Chance, K., Kurosu, T. P., & Sioris, C. E. 2005, Appl. Opt., 44, 1296, doi: 10.1364/AO.44.001296
-
[8]
2023, Principles of Astrophotonics, doi: 10.1142/q0391
Ellis, S., Bland-Hawthorn, J., & Leon-Saval, S. 2023, Principles of Astrophotonics, doi: 10.1142/q0391
Show all 22 references
-
[9]
C., & Bland-Hawthorn, J
Ellis, S. C., & Bland-Hawthorn, J. 2008, MNRAS, 386, 47, doi: 10.1111/j.1365-2966.2008.13021.x
2008 doi
-
[10]
2020, Journal of Lightwave Technology, 38, 4429, doi: 10.1109/JLT.2020.2991648
Fang, L., Gu, L., Zheng, J., et al. 2020, Journal of Lightwave Technology, 38, 4429, doi: 10.1109/JLT.2020.2991648
2020 doi
-
[11]
2002, Optics, 4th edn
Hecht, E. 2002, Optics, 4th edn. (Addison Wesley)
2002
-
[12]
2007, Optical Microresonators: Theory, Fabrication, and Applications, doi: https://doi.org/10.1007/978-0-387-73068-4
Heebner, J., Grover, R., & Ibrahim, T. 2007, Optical Microresonators: Theory, Fabrication, and Applications, doi: https://doi.org/10.1007/978-0-387-73068-4
2007 doi
-
[13]
2024, in Advances in Optical and Mechanical Technologies for Telescopes and Instrumentation VI, ed
Kuehn, K., Kelley, T., Kuhlmann, S., et al. 2024, in Advances in Optical and Mechanical Technologies for Telescopes and Instrumentation VI, ed. R. Navarro & R. Jedamzik, Vol. 13100, International Society for Optics and Photonics (SPIE), 1310069, doi: 10.1117/12.3018485
2024 doi
-
[14]
2020, in Society of Photo-Optical Instrumentation Engineers (SPIE) Conference Series, Vol
Kuehn, K., Kuhlmann, S., Ellis, S., et al. 2020, in Society of Photo-Optical Instrumentation Engineers (SPIE) Conference Series, Vol. 11451, Society of Photo-Optical Instrumentation Engineers (SPIE) Conference Series, 114516A, doi: 10.1117/12.2561990
2020 doi
-
[15]
A., Ellis, S., et al
Liu, P., Czaplewski, D. A., Ellis, S., et al. 2021, ApOpt, 60, 3865, doi: 10.1364/AO.421383
2021 doi
-
[16]
A., Menanteau, F., & DES Collaboration
Morganson, E., Gruendl, R. A., Menanteau, F., & DES Collaboration. 2018, PASP, 130, 074501, doi: 10.1088/1538-3873/aab4ef
2018 doi
-
[17]
R., Scolnic, D., Jones, D
Peterson, E. R., Scolnic, D., Jones, D. O., et al. 2024, A&A, 690, A56, doi: 10.1051/0004-6361/202450052
2024 doi
-
[18]
Phillips, M. M. 2012, Publications of the Astronomical Society of Australia, 29, 434–446, doi: 10.1071/AS11056
2012 doi
-
[19]
Robertson, J. G. 2017, Publications of the Astronomical Society of Australia, 34, e035, doi: 10.1017/pasa.2017.29
2017 doi
-
[20]
G., et al
Rousselot, P., Lidman, C., Cuby, J. G., et al. 2000, A&A, 354, 1134
2000
-
[21]
M., Friedman, A
Wood-Vasey, W. M., Friedman, A. S., Bloom, J. S., et al. 2008, The Astrophysical Journal, 689, 377, doi: 10.1086/592374
2008 doi
-
[22]
W., Krug, P
Yoffe, G. W., Krug, P. A., Ouellette, F., & Thorncraft, D. A. 1995, ApOpt, 34, 6859, doi: 10.1364/AO.34.006859 10Hermannet al. APPENDIX T able 5.The performance metrics of the first, second, fourth, and fifth dips created by ANT-07 for the first four orders contained in the lo...
1995 doi
Reviewed July 7, 2026 · model on record in the stance chip above.
Discussion (0). Continue with ORCID to comment.