REVIEW 4 major objections 5 minor 18 references
Hyper Vision Net: Kidney Tumor Segmentation Using Coordinate Convolutional Layer and Attention Unit
T0 review · 4 major / 5 minor · reviewed 2026-08-14 · deepseek-v4-flash
Pith's one-line read The paper claims that a U-Net variant with coordinate convolution, supervised decoder layers, and channel-spatial attention reaches 0.9552 tumor Dice and 0.9633 kidney Dice on KiTS19 training images.
desk verdict A routine U-Net variant with a plausible but unverified Dice claim; the central comparison to state of the art is not actually made. read the letter →
The pith
A machine-rendered reading of the paper's core claim, the machinery that carries it, and where it could break.
The reading
What carries the argument
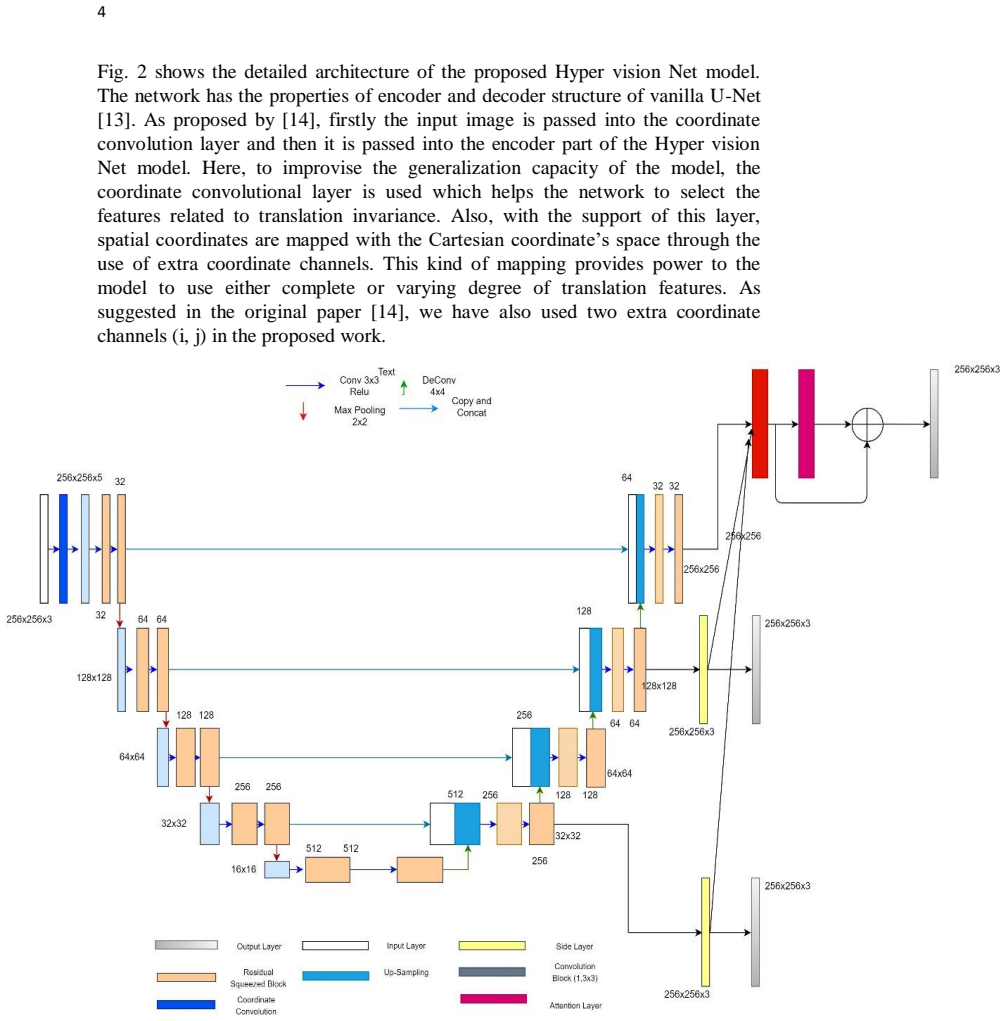
The load-bearing mechanism is the combination of three components inside a U-Net encoder-decoder. First, a coordinate convolution layer prepends two coordinate channels to the input, letting the network use spatial coordinate information. Second, two "hyper vision" decoder layers produce intermediate segmentations that are each supervised with the ground truth and fused with the final encoder output; this is intended to refine even very small tumor regions. Third, a convolutional block attention module (CBAM) applies channel attention then spatial attention to the fused feature map, and its output is added back before the final softmax. The loss is the sum of categorical cross-entropy and separate Dice losses for the tumor and kidney channels.
What would settle it
Train a plain U-Net with comparable depth, loss, and preprocessing on the 32,175 training images and evaluate on the same 13,790 validation images; if that baseline reaches or exceeds the reported 0.8967 tumor Dice, the paper's claim that Hyper Vision Net is superior is contradicted.
Extended reading notes
Core claim
The central claim is that a U-Net architecture augmented with a coordinate convolution layer, two supervised decoder "hyper vision" layers, and a channel-and-spatial attention unit accurately segments kidney and tumor regions in the KiTS19 CT dataset. On the authors' split, the model with the attention unit achieves Dice scores of 0.9552 for tumor and 0.9633 for kidney on the 32,175-image training set, and 0.8967 and 0.9535 on the 13,790-image validation set. The paper credits the attention unit with most of the gain, because dropping it lowers training tumor Dice to 0.8186 and validation tumor Dice to 0.84. The stated conclusion is that this makes Hyper Vision Net superior to previous segmentation methods in terms of Dice score.
Load-bearing premise
The paper assumes that the validation Dice scores it reports can be compared directly with published state-of-the-art results on KiTS19, even though it does not evaluate any baseline method on the same training/validation split.
Editorial extensions
If this is right
- If the scores hold, U-Net variants for abdominal CT segmentation can be expected to gain accuracy from decoder supervision layers and a channel-and-spatial attention module.
- The attention ablation (training tumor Dice drops from 0.9552 to 0.8186) indicates that most of the reported accuracy comes from the attention unit rather than from the coordinate layer alone.
- The loss formulation—cross-entropy plus a Dice term per target channel—can be transferred to other segmentation problems with severe class imbalance.
- A direct practical consequence is that the method, as described, can be run on a single GPU with 256x256 slices, making it accessible for clinical research settings.
Reading between the lines
- An implication the authors do not spell out is that the reported validation tumor Dice of 0.8967 is the more conservative estimate of real-world performance, since the training score is 0.9552; applying the model to new scans would likely land closer to the validation number.
- The architecture's emphasis on spatial coordinate information could transfer to other small, low-contrast structures such as pancreatic lesions, where precise boundaries are hard to learn from intensity alone.
- Because the paper works with 2D slices, a natural extension is to replace the 2D convolutions with 3D ones and keep the same attention-and-supervision structure, which would use inter-slice context and may reduce false positives.
- The claim of state-of-the-art performance would be directly testable by running the same network and a plain U-Net on the same split; the paper does not include that comparison, so that test remains open.
Signed reviews
Editorial analysis
A structured set of objections, weighed in public.
Referee Report
Summary. The paper proposes Hyper Vision Net, a U-Net-based architecture for kidney and kidney tumor segmentation in CT images from the KiTS19 dataset. The main additions are a coordinate convolutional layer at the input, residual blocks in the encoder/decoder, two 'hyper vision' layers with deep supervision in the decoder, and a CBAM-style attention unit. The authors report Dice scores for the model with and without the attention layer on the KiTS19 training and validation subsets (with attention: 0.9552/0.9633 training and 0.8967/0.9535 validation for tumor/kidney) and claim that the method is superior to state-of-the-art segmentation methods. The paper contains no comparison with any external baseline on the same split, does not specify which of the three supervised outputs is used for the reported scores, and contains an internal inconsistency in Section 4.2 where validation numbers are described as training results.
Significance. If the architecture were validated with appropriate comparisons, the combination of coordinate convolution, deep supervision, and attention within a U-Net is a plausible incremental contribution to medical image segmentation, and the use of a public dataset is commendable. The with/without attention ablation provides some internal evidence for the utility of the attention unit. However, the central claim of state-of-the-art superiority is not supported by the reported experiments: no same-split baseline is evaluated, the inference protocol is under-specified, and the abstract bases the headline claim on training-set Dice, which does not measure generalization. The paper therefore needs substantial additional experimental work before its significance can be assessed.
major comments (4)
- [Section 4.2, Table 1, Abstract] The central claim that Hyper Vision Net is superior to state-of-the-art methods is unsupported because no external baseline is evaluated on the same training/validation split. Table 1 only compares the proposed model with and without the attention layer; there is no comparison to U-Net, nnU-Net, or any published KiTS19 result on the same data partition. The abstract's reliance on the training Dice value of 0.9552/0.9633 for the superiority claim is particularly problematic, as training-set performance does not establish generalization. Please add at least one standard baseline (e.g., vanilla U-Net) evaluated under identical conditions and base the headline claim on validation or an independent test set.
- [Section 3.2, Section 4.1] The inference head used to compute the reported Dice scores is not specified. The architecture produces three supervised outputs (two hyper vision layer outputs and the fused final output), each passed through a softmax layer under ground-truth supervision. The paper does not state which of these outputs generated the numbers in Table 1, nor how the final segmentation is derived (e.g., argmax over the three-class map). Without this information, the results are not reproducible from the description. Please clarify exactly which output head was evaluated and describe the post-processing steps.
- [Section 4.2] The text in Section 4.2 is internally inconsistent with Table 1. The sentence 'during training, the proposed method achieves the Dice score of 0.8967 and 0.9535 for the tumor region and kidney region by involving attention layer' attributes the validation numbers (as listed in Table 1) to training, and the next sentence repeats the same values as a separate result. This makes it unclear which subset corresponds to which numbers and must be corrected to match the table.
- [Section 4.2, Table 1] No error bars, multiple runs, or statistical tests are reported. Single-run Dice scores for medical segmentation can vary by several tenths of a point depending on initialization and data shuffling, so the observed differences—e.g., 0.9552 vs. 0.8967 for tumor Dice with vs. without attention—cannot be judged statistically meaningful without an estimate of variance. Please report the mean and standard deviation over at least three random seeds and state the number of runs.
minor comments (5)
- [Section 3.2, References] In Section 3.2, the text refers to 'the encoder and decoder structure of vanilla U-Net [13]', but reference [13] is Shen et al., DeepContour, not U-Net; the U-Net citation is [11]. Please correct the citation.
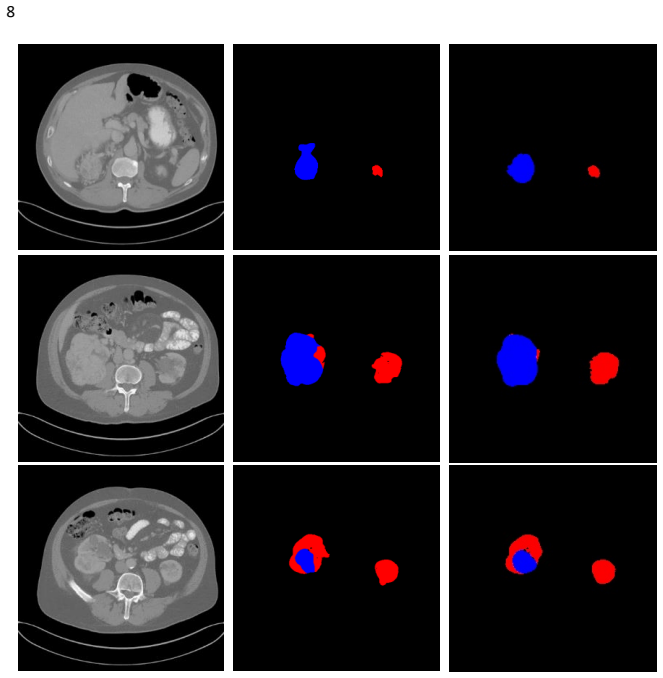
- [Section 3.2, Section 4.2] The figure numbering is duplicated: Fig.3 is used both for the residual block structure in Section 3.2 and for the qualitative segmentation outputs in Section 4.2. Please renumber the figures sequentially.
- [Title page] The author affiliations are inconsistent: the author line lists superscripts 1, 2, and 3, but affiliation 3 has no corresponding author superscript, and the link between the authors and the affiliations is ambiguous. Please correct the affiliation markers.
- [Equation (2)] The Dice loss formula in Eq. (2) has unclear summation indices (the limits 'i=0' and 'n=k' are not standard) and the denominator lacks parentheses, which makes the expression hard to parse. Please rewrite it in standard mathematical notation.
- [Abstract, Section 2] The abstract states that the dataset includes 45,964 images, but Section 2 reports 32,175 training plus 13,790 validation images, which sum to 45,965. Please check and correct this one-image discrepancy.
Circularity Check
Superiority claim reduces to training-set Dice, a fitted input presented as evidence of state-of-the-art performance.
-
fitted input called prediction
[Abstract; also Section 4.2 (Table 1) and Conclusion]
"Compared with the state-of-the-art segmentation methods, the results demonstrate the superiority of our approach on training dice value score of 0.9552 and 0.9633 in tumor region and kidney region, respectively."
The reported training Dice is the value of the segmentation objective measured on the very images used for gradient-based optimization. Using this fitted quantity to demonstrate superiority to state-of-the-art methods makes the claimed prediction (SOTA-level performance) reduce by construction to the training fit: the model was directly optimized to maximize Dice on these labels, and no baseline is evaluated on the same split. The paper's central quantitative claim is therefore supported by a measure of fit rather than by any held-out or comparative evidence.
full rationale
This is an empirical segmentation paper with no mathematical derivation, so most circularity patterns do not apply. The one clear circular step is the abstract and conclusion using training-set Dice (0.9552/0.9633) as evidence of superiority over state-of-the-art methods. Training Dice is the loss objective evaluated on the same images used for optimization, so the claimed superiority reduces by construction to the fit. The validation Dice values (0.8967/0.9535) are genuine predictions, but they are not compared to any baseline on the same split, and the paper does not specify which of the three output heads produced them. The self-citation to SkeletonNet (Ref. 15, same first author) is architectural inspiration and is not load-bearing for the numerical claim. No derivation chain exists beyond the empirical report; the specific reduction is the training-fit-as-prediction step.
Assumptions & free parameters
assumptions (2)
- domain assumption KiTS19 ground-truth segmentations are accurate enough for training and evaluation.
- domain assumption The official train/validation split is representative.
Cite this review
Pith. "Pith review of Hyper Vision Net: Kidney Tumor Segmentation Using Coordinate Convolutional Layer and Attention Unit." pith.science (2026). https://pith.science/paper/MUPWFHPS
@misc{pith2026190803339,
  author       = {Pith},
  title        = {Pith review of: Hyper Vision Net: Kidney Tumor Segmentation Using Coordinate Convolutional Layer and Attention Unit},
  year         = {2026},
  howpublished = {\url{https://pith.science/paper/MUPWFHPS}},
  note         = {Machine review of arXiv:1908.03339}
}
read the original abstract
KiTs19 challenge paves the way to haste the improvement of solid kidney tumor semantic segmentation methodologies. Accurate segmentation of kidney tumor in computer tomography (CT) images is a challenging task due to the non-uniform motion, similar appearance and various shape. Inspired by this fact, in this manuscript, we present a novel kidney tumor segmentation method using deep learning network termed as Hyper vision Net model. All the existing U-net models are using a modified version of U-net to segment the kidney tumor region. In the proposed architecture, we introduced supervision layers in the decoder part, and it refines even minimal regions in the output. A dataset consists of real arterial phase abdominal CT scans of 300 patients, including 45964 images has been provided from KiTs19 for training and validation of the proposed model. Compared with the state-of-the-art segmentation methods, the results demonstrate the superiority of our approach on training dice value score of 0.9552 and 0.9633 in tumor region and kidney region, respectively.
Figures

Reference graph
Works this paper leans on
-
[13]
Deepcontour: A deep convolutional feature learned by positive -sharing loss for contour detection
Shen W, Wang X, Wang Y, Bai X, Zhang Z., “ Deepcontour: A deep convolutional feature learned by positive -sharing loss for contour detection”, In Proceedings of the IEEE conference on computer vision and pattern recognition, pp. 3982-3991, 2015. 23
work page 2015
-
[1]
https://www.cancer.org/cancer/kidney-cancer/detection-diagnosis- staging/detection.html
-
[2]
Hesamian, M.H., Jia, W., He, X. et al. : Deep Learning Techniques for Medical Image Segmentation: Achievements and Challenges, Journal of Digit Imaging (2019) 32: 582. https://doi.org/10.1007/s10278-019-00227-x
-
[3]
Linguraru MG1, Wang S, Shah F, Gautam R, Peterson J, Linehan WM, Summers RM.: Automated noninvasive classification of renal cancer on multiphase CT , Med Phys. 2011 Oct;38(10):5738-46. doi: 10.1118/1.3633898
-
[4]
H. S. Lee, H. Hong and J. Kim, : Detection and segmentation of small renal masses in 9 contrast-enhanced CT images using texture and context feature classification, 2017 IEEE 14th International Symposium on Biomedical Imaging (ISBI 2017) , Melbourne, VIC, 2017, pp. 583-586. doi: 10.1109/ISBI.2017.7950588
arXiv 2017
-
[5]
Bansari Shah, Charmi Sawla, Shraddha Bhanushali and Poonam Bhogale, : Kidney Tumor Segmentation and Classification on Abdominal CT Scans”, International Journal of Computer Applications 164(9):1-5, April 2017
work page 2017
- [6]
-
[7]
William Thong, Samuel Kadoury, Nicolas Piché & Christopher J. Pal ,: Convolutional networks for kidney segmentation in contrast -enhanced CT scans , Computer Methods in Biomechanics and Biomedical Engineering: Imaging & Visualization, 2016. DOI:10.1080/21681163.2016.1148636
arXiv 2016
Show all 18 references
-
[8]
Jakubowski and T
Skalski, J. Jakubowski and T. Drewniak, : Kidney tumor segmentation and detection on Computed Tomography data, 2016 IEEE International Conference on Imaging Systems and Techniques (IST), Chania, 2016, pp. 238-242. doi: 10.1109/IST.2016.7738230
2016
-
[9]
Kanishka Sharma, :Machine Learning Methods for Segmentation in Autosomal Dominant Polycystic Kidney Disease, Sharma2017MachineLM, 2017
2017
-
[10]
Wang et al .: Interactive Medical Image Segmentation Using Deep Learning With Image-Specific Fine Tuning, in IEEE Transactions on Medical Imaging , vol
G. Wang et al .: Interactive Medical Image Segmentation Using Deep Learning With Image-Specific Fine Tuning, in IEEE Transactions on Medical Imaging , vol. 37, no. 7, pp. 1562-1573, July 2018. doi: 10.1109/TMI.2018.2791721
2018
-
[11]
U -net: Convolutional networks for biomedical image segmentation
Ronneberger O, Fischer P, Brox T. U -net: Convolutional networks for biomedical image segmentation. In International Conference on Medical image computing and computer-assisted intervention, pp. 234-241, Springer, Cham, 2015
2015
-
[12]
The KiTS19 Challenge Data: 300 Kidney Tumor Cases with Clinical Context, CT Semantic Segmentations, and Surgical Outcomes
N Heller, N Sathianathen, A Kalapara, E Walczak, K Moore, H Kaluzniak, J Rosenberg, P Blake, Z Rengel, M Oestreich, J Dean, M Tradewell, A Shah, R Tejpaul, Z Edgerton, M Peter son, S Raza, S Regmi, N Papanikolopoulos, C Weight, “The KiTS19 Challenge Data: 300 Kidney Tumor Case...
1904
-
[14]
Rosanne Liu, Joel Lehman, Piero Molino, Felipe Petr oski Such, Eric Frank, Alex Sergeev, Jason Yosinski, : An Intriguing Failing of Convolutional Neural Networks and the CoordConv Solution”, arXiv:1807.03247, 2018
2018 arXiv
-
[15]
SkeletonNet: Shape Pixel to Skeleton Pixel
Sabari Nathan and Priya Kansal, “SkeletonNet: Shape Pixel to Skeleton Pixel”, CVPRw, 2019, arXiv:1907.01683
2019 arXiv
-
[16]
Sanghyun Woo, Jongchan Park, Joon-Young Lee, In So Kweon, CBAM: Convolutional Block Attention Module, arXiv:1807.06521 , 2018
2018 arXiv
-
[17]
Deep residual learning for image recognition
He, Kaiming, Xiangyu Zhang, Shaoqing Ren, and Jian Sun. Deep residual learning for image recognition. In Proceedings of the IEEE conference on computer vision and pattern recognition, pp. 770-778. 2016
2016
-
[18]
Adam: A method for stochast ic optimization,
D. P. Kingma and J. Ba, "Adam: A method for stochast ic optimization," arXiv:1412.6980, 2014
2014 arXiv
Reviewed August 14, 2026 · model on record in the stance chip above.
Discussion (0). Continue with ORCID to comment.