Comparing telluric removal methods in their capability to recover injected exoplanet atmosphere signals with high resolution emission spectroscopy
Pith reviewed 2026-06-29 09:46 UTC · model grok-4.3
The pith
PCA can produce higher SNR in exoplanet spectra but degrades the planetary signal more than fitting-based telluric removal.
A machine-rendered reading of the paper's core claim, the machinery that carries it, and where it could break.
Core claim
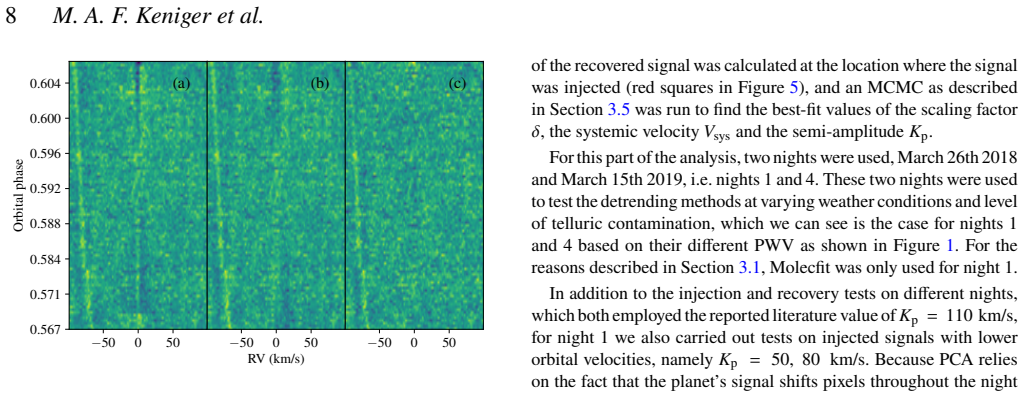
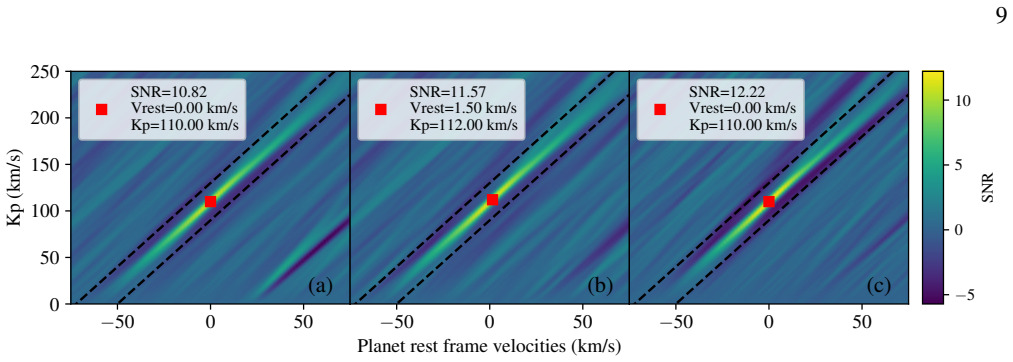
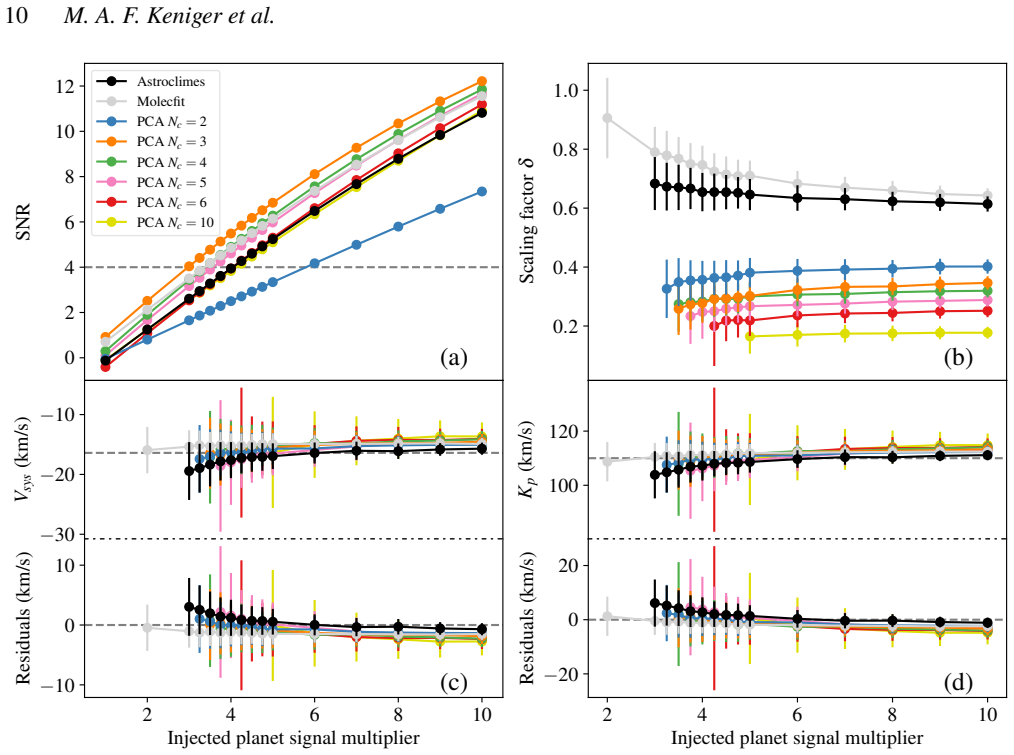
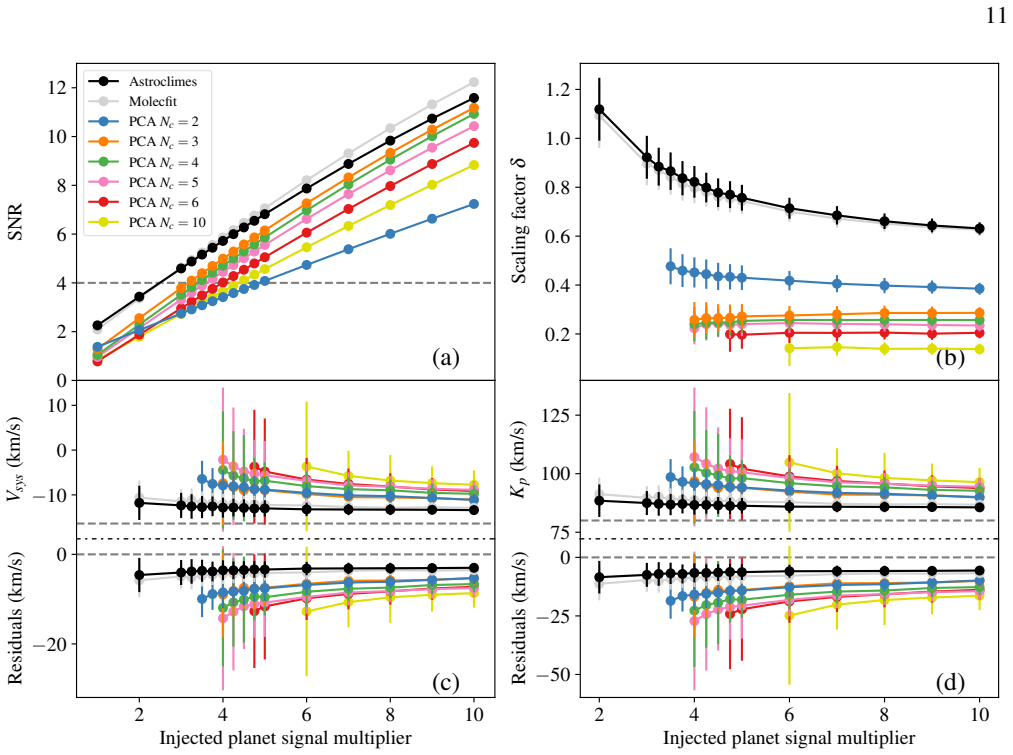
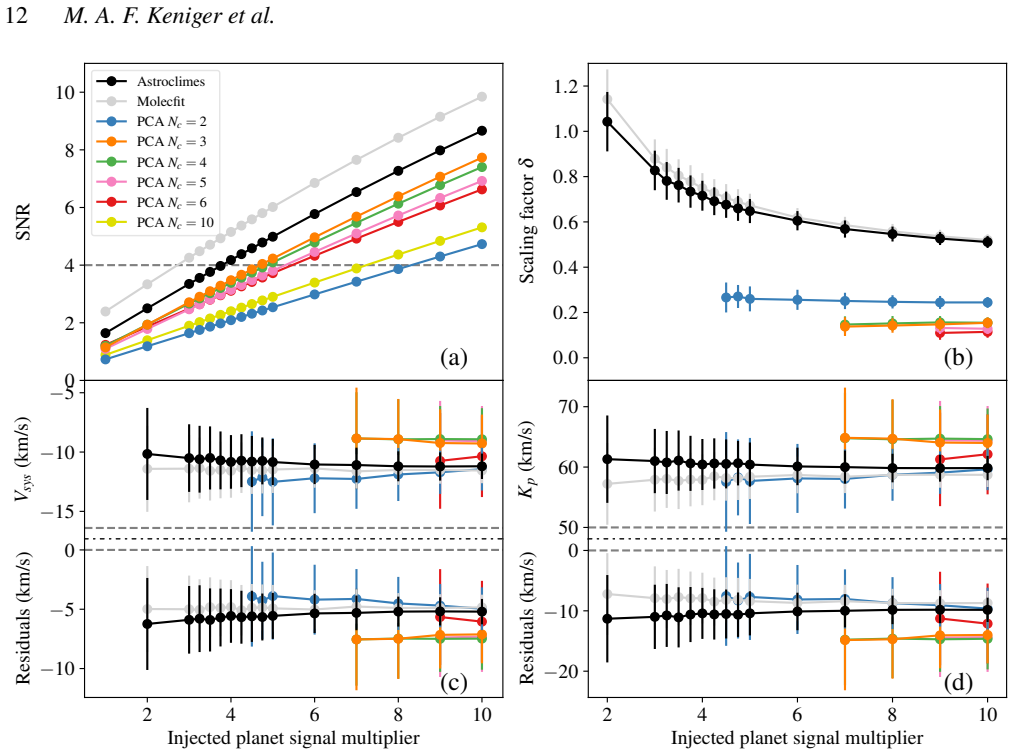
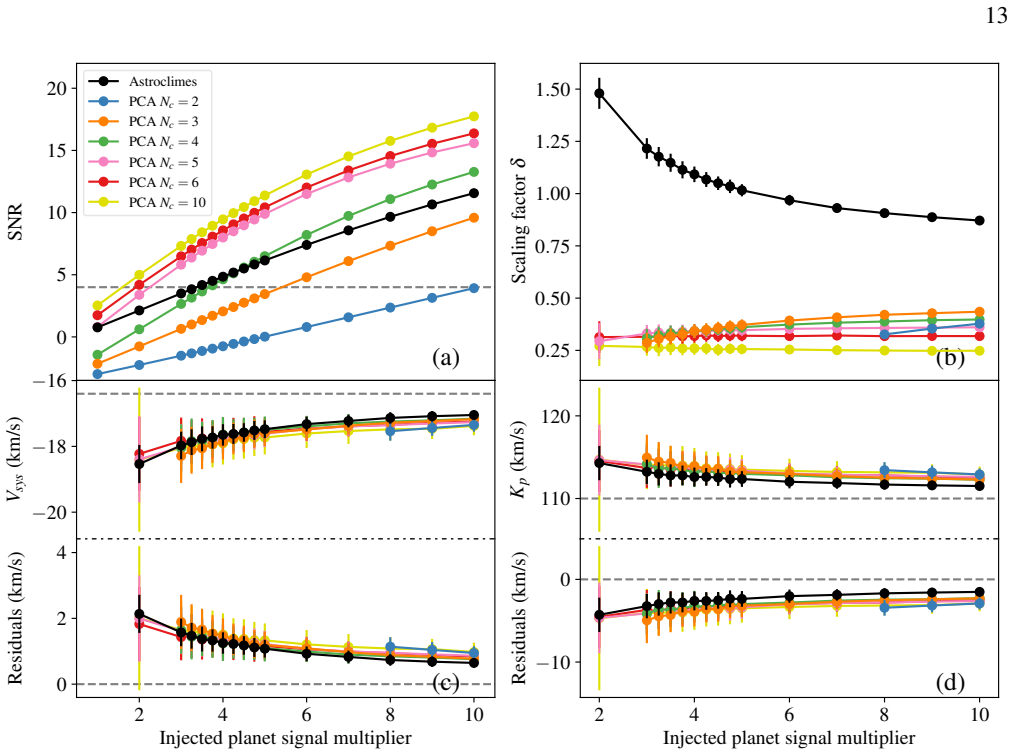
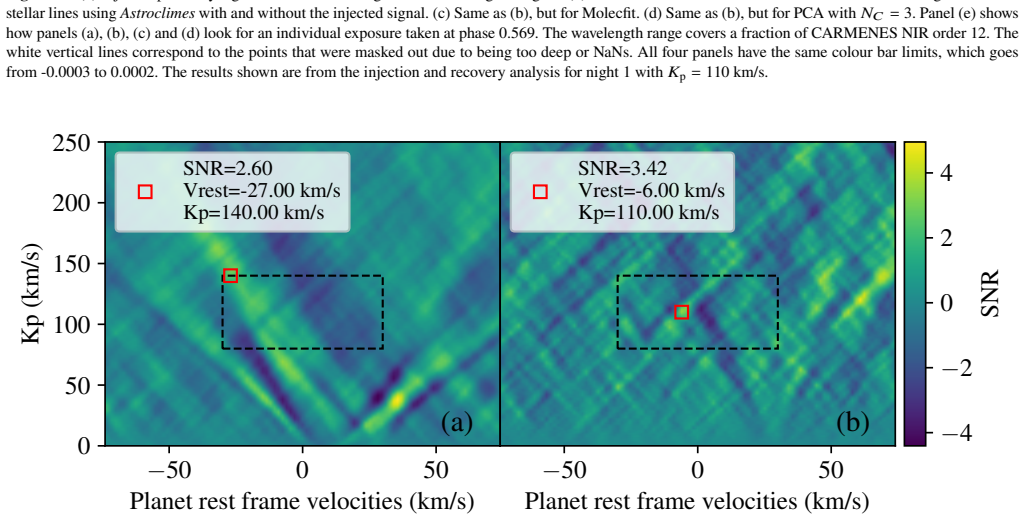
Through systematic injection and recovery of H2O signals into near-infrared observations of the dayside of τ Bootis b, the study demonstrates that PCA detrending achieves higher signal-to-noise ratios at the cost of greater planetary signal attenuation compared to model-based methods. All three techniques—PCA, Molecfit, and Astroclimes—exhibit increased difficulty recovering signals at lower orbital velocities, distorting both amplitude and velocity location, with the distortion most pronounced under PCA. No method recovers a previously reported water feature from the planet.
What carries the argument
Injection-recovery tests that insert synthetic exoplanet emission spectra into real observations before applying each detrending method and then measure the recovered cross-correlation signal in velocity space.
If this is right
- Characterizations of exoplanet atmospheres may carry systematic biases in velocity and abundance if PCA is used without correction.
- Model-based telluric removal is less likely to erase real signals but may require more accurate line lists.
- Claims of atmospheric detections should be re-checked with multiple detrending approaches.
- Low-velocity planets require extra caution in analysis pipelines.
- Non-detections in re-analyses can arise from the choice of detrending rather than absence of the signal.
Where Pith is reading between the lines
- Hybrid detrending that combines PCA for initial cleaning with model fitting for final steps might reduce the trade-off.
- Velocity biases could be corrected post-facto by adjusting the template grid after detrending.
- Similar tests on other instruments or wavelengths would test whether the PCA degradation is universal.
- The results suggest that some literature non-detections of atmospheres may be method-dependent.
Load-bearing premise
The synthetic injected signals interact with the observed spectra and the detrending algorithms in exactly the same way that genuine exoplanet signals would.
What would settle it
A high-SNR detection of an exoplanet atmosphere signal recovered at the expected velocity and amplitude after PCA detrending, matching independent model-based results on the same data.
Figures
read the original abstract
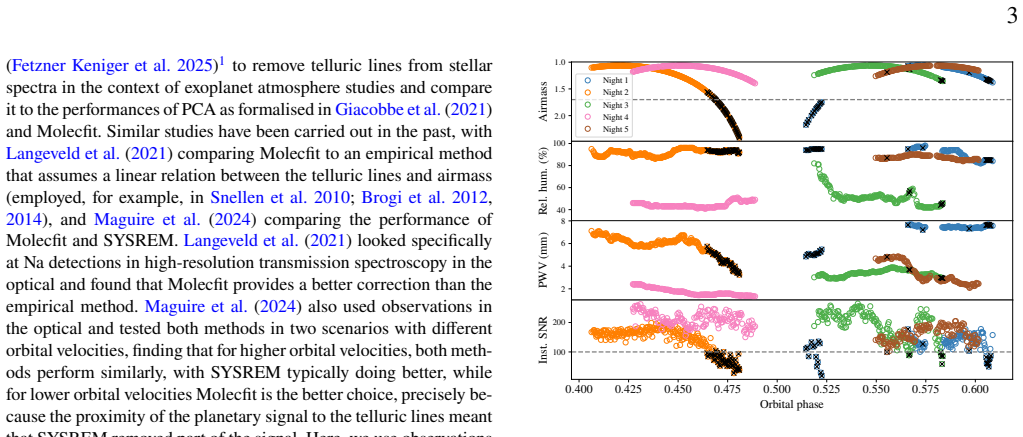
For ground-based high-resolution spectroscopic exoplanet atmosphere studies, removing the contamination from telluric and stellar lines is a crucial step in the analysis process. Despite that, there is no consensus in the literature on the most appropriate way to carry this out. Typically, tellurics are either directly modelled to a percent-level precision, or blindly detrended via Principal Component Analysis (PCA) algorithms, the latter particularly common at infrared wavelengths. Here, we compare three different detrending methods, PCA, Molecfit and our own fitting algorithm Astroclimes, measuring their performance in the context of removing telluric and stellar lines to detect exoplanetary atmospheric signals. We specifically look for H2O detections, which are particularly affected by residual, time-correlated variability of the telluric spectrum. We use near-infrared CARMENES observations of the day-side of $\tau$ Bootis b to carry out injection and recovery tests. We find that while PCA can sometimes achieve higher SNR, it comes at the expense of stronger signal degradation. All methods struggle more for injected signals with lower orbital velocities, not just affecting the signal's magnitude but its location in velocity space as well. This behaviour is more prominent for PCA than for Astroclimes and Molecfit. These results highlight the importance of understanding the effects of different detrending methods on exoplanetary signals, which can lead to biases when characterising real detections. Finally, we report that our attempts to detect a previously claimed water signal from $\tau$ Bootis b all resulted in non-detections.
Editorial analysis
A structured set of objections, weighed in public.
Referee Report
Summary. The paper compares three telluric and stellar line removal methods (PCA, Molecfit, and Astroclimes) for high-resolution near-IR emission spectroscopy using CARMENES observations of τ Bootis b. Through injection-and-recovery experiments of H2O signals, it reports that PCA can yield higher SNR at the cost of greater signal degradation, that all methods exhibit worse performance (in both amplitude and velocity location) at lower orbital velocities with the effect strongest for PCA, and that attempts to recover a previously claimed water signal result in non-detections.
Significance. If the injection tests are representative of real signal–telluric–detrending interactions, the results provide a useful empirical demonstration that common detrending choices can bias both detection significance and retrieved orbital parameters, which is relevant for the growing sample of high-resolution exoplanet atmosphere studies.
major comments (1)
- [Abstract / Methods (injection tests)] The central performance rankings and non-detection conclusion rest entirely on injection-recovery tests (abstract and associated methods/results sections). The manuscript does not report additional validation (e.g., comparison against synthetic datasets with known extra systematics such as airmass-dependent telluric depth variations or residual stellar-line correlations) that would confirm the injected signals experience the same linear and non-linear interactions as genuine planetary emission; this assumption is load-bearing for the claim that PCA degrades signals more severely and for the velocity-shift results.
minor comments (2)
- [Abstract] The abstract states that 'all methods struggle more for injected signals with lower orbital velocities' but does not quantify the velocity bias (e.g., mean offset in km/s or dependence on K_p); adding a table or figure panel with these metrics would strengthen the presentation.
- [Methods] Notation for the three methods is introduced without a dedicated methods subsection summarizing their algorithmic differences (e.g., number of PCA components, fitting parameters in Astroclimes); a short comparison table would improve clarity.
Simulated Author's Rebuttal
We thank the referee for their thoughtful review and constructive feedback on our manuscript. We respond to the major comment below.
read point-by-point responses
-
Referee: [Abstract / Methods (injection tests)] The central performance rankings and non-detection conclusion rest entirely on injection-recovery tests (abstract and associated methods/results sections). The manuscript does not report additional validation (e.g., comparison against synthetic datasets with known extra systematics such as airmass-dependent telluric depth variations or residual stellar-line correlations) that would confirm the injected signals experience the same linear and non-linear interactions as genuine planetary emission; this assumption is load-bearing for the claim that PCA degrades signals more severely and for the velocity-shift results.
Authors: We thank the referee for raising this point. Our injection-recovery experiments inject synthetic planetary emission signals directly into the real CARMENES spectra prior to detrending. This design ensures the injected signals encounter the actual time-varying telluric absorption, airmass trends, and any residual stellar-line correlations present in the observations. We maintain that this is the most direct test of how each method interacts with genuine data properties, consistent with standard practice in high-resolution exoplanet spectroscopy. That said, we acknowledge the referee's concern that additional cross-checks against controlled synthetic datasets could further test the robustness of the observed trends. We will therefore revise the Methods and Discussion sections to expand on the assumptions of the injection approach, explicitly note its limitations relative to purely synthetic tests, and compare our methodology to similar studies in the literature. revision: partial
Circularity Check
No circularity: purely empirical method comparison via injection tests
full rationale
The paper contains no mathematical derivation chain, no fitted parameters renamed as predictions, and no self-citation load-bearing steps. All claims (SNR comparisons, velocity shifts, non-detections) are direct outputs of the described injection-and-recovery experiments on CARMENES data. The study is self-contained against external benchmarks with no reduction of results to inputs by construction.
Axiom & Free-Parameter Ledger
axioms (1)
- domain assumption Injected signals accurately represent real exoplanet atmospheric signals without introducing additional biases or interactions with the detrending algorithms
Reference graph
Works this paper leans on
-
[1]
Ahrer E.-M., et al., 2023, Nature, 614, 653 Alderson L., et al., 2023, Nature, 614, 664 Allart R., Lovis C., Pino L., Wyttenbach A., Ehrenreich D., Pepe F., 2017, A&A, 606, A144 Allart R., et al., 2019, A&A, 623, A58 Alonso-Floriano F. J., et al., 2019, A&A, 621, A74 Bailey J., Simpson A., Crisp D., 2007, PASP, 119, 228 Basilicata M., et al., 2024, A&A, 6...
-
[2]
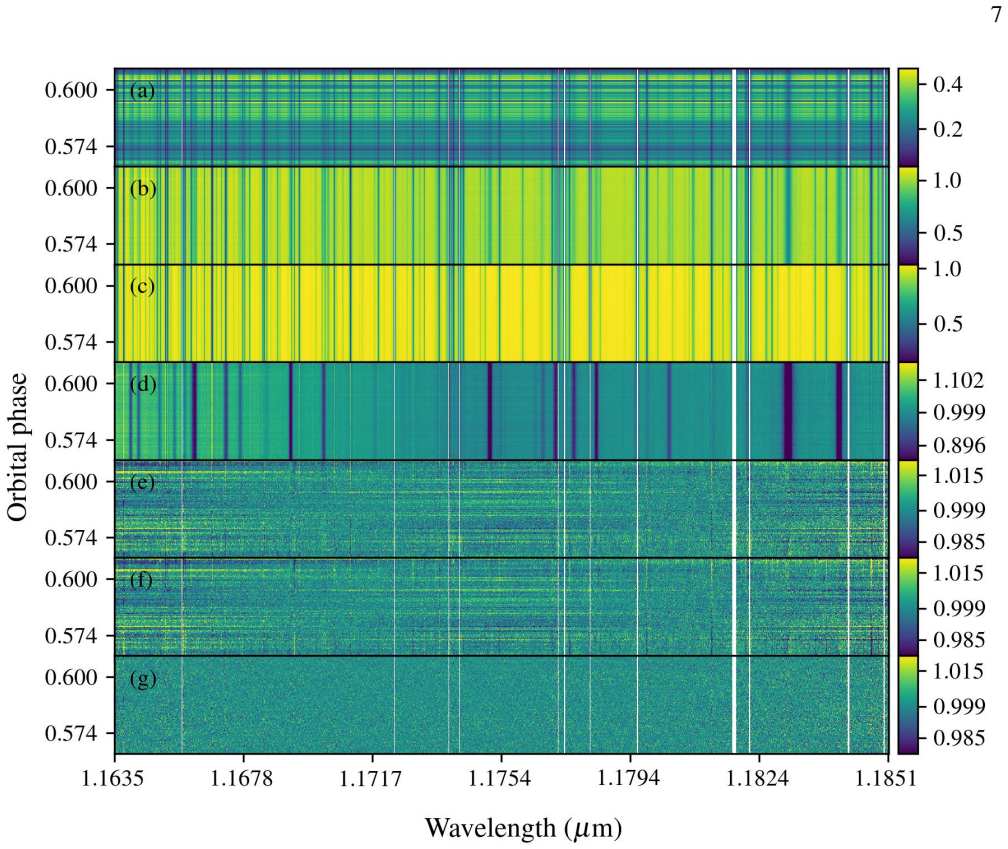
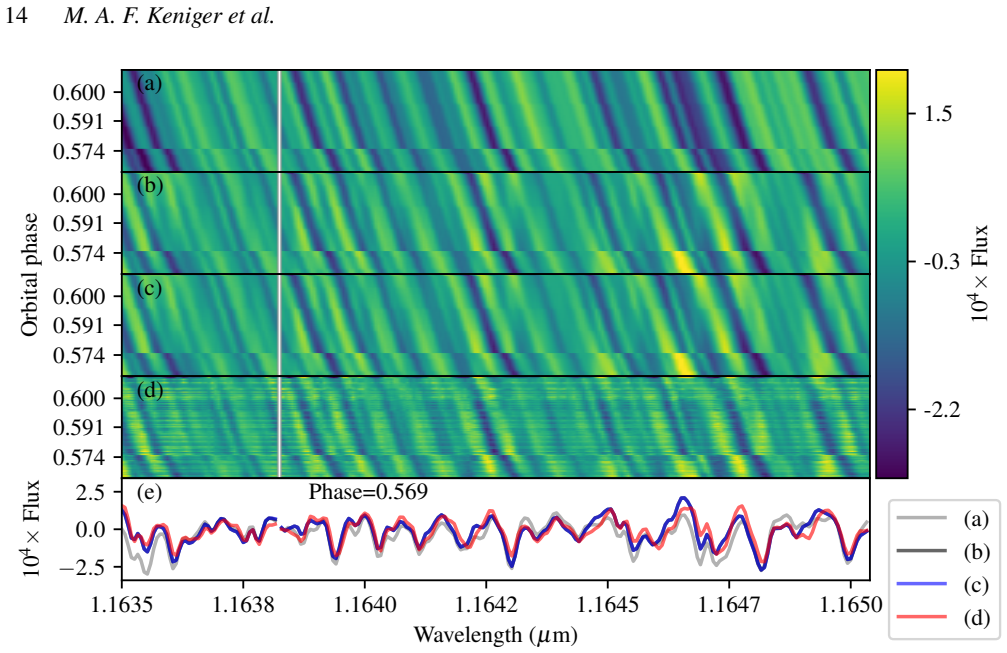
Each row on the𝑦-axis corresponds to an individual observation, represented by the orbital phase, and the colour maps on the right side correspond to the flux level of each panel. For panels (a) and (b), the colour bar limits are the minimum and maximum values of the quantity being plotted, whereas for panels (c)-(h) the limits were taken to be the median...
2026
-
[3]
signal” and “noise
Each row on the𝑦-axis corresponds to an individual observation, represented by the orbital phase, and the colour maps on the right side correspond to the flux level of each panel. The white vertical lines correspond to the points that were masked out due to being too deep or NaNs. (a) is the observationalspectra,(b)istheobservationalspectradivideditsmedia...
2026
discussion (0)
Sign in with ORCID, Apple, or X to comment. Anyone can read and Pith papers without signing in.