REVIEW 5 major objections 7 minor 34 references
Similarity Trajectories: Linking Sampling Process to Artifacts in Diffusion-Generated Images
T0 review · 5 major / 7 minor · reviewed 2026-08-11 · deepseek-v4-flash
Pith's one-line read The pattern of similarity between consecutive denoised images during the diffusion sampling process predicts whether the final image contains artifacts.
desk verdict A genuinely new representation for data-efficient artifact detection, but the headline accuracy needs prompt-conditioned CV before it can be trusted. read the letter →
The pith
A machine-rendered reading of the paper's core claim, the machinery that carries it, and where it could break.
The reading
What carries the argument
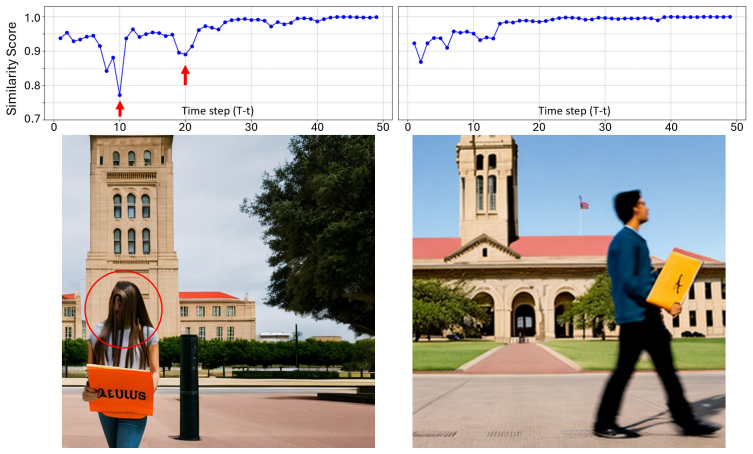
The central object is the Similarity Trajectory, the time series $z_t = d(x_0^{(t)}, x_0^{(t-1)})$ of similarities between denoised images predicted at consecutive sampling steps, using DreamSim as the human-aligned metric $d$. The paper also defines the maximum decline $D_{\max}$ of a trajectory and uses the Haar transform plus bag-of-statistics features (percentiles, mean crossings, entropy) to turn each trajectory into a vector for a random forest classifier. These components carry the argument: the trajectory is the evidence that links sampling dynamics to artifacts, and the classifier demonstrates the claim is actionable with little labeled data.
What would settle it
Generate a large uncurated batch of images from the same SD2/DDIM setting and obtain human ratings of artifact severity for every image, including the previously discarded borderline ones; then test whether trajectory features and the max-decline statistic sort these images by severity. If accuracy on the unfiltered set is near chance, the link between trajectory drops and artifacts is an artifact of extreme-case selection.
Extended reading notes
Core claim
Diffusion sampling produces a sequence of denoised images; the paper's central discovery is that the similarity between consecutive denoised images, monitored across the whole sampling run, is correlated with the severity of artifacts in the final generated image. Concretely, the authors define the Similarity Trajectory $\{z_t\}$ with $z_t = d(x_0^{(t)}, x_0^{(t-1)})$, and a maximal decline in that trajectory is statistically larger for images with obvious artifacts than for natural-looking ones. Because the trajectory compresses the sampling process into a compact signature, a random forest classifier trained on Haar-transform coefficients and statistical features of the trajectory can predict artifact presence from only 680 labeled images, and the predictions agree with human judgments more often than they disagree on a paired real-world test. The same signature, averaged over many generated images, shifts in a direction consistent with model improvement as training time and model capacity increase.
Load-bearing premise
The labeled dataset used for the max-decline statistics and classifier training was manually filtered to keep only images with obvious artifacts or clear natural quality, discarding every ambiguous case, so the measured separation and 72.35% accuracy may not hold on unfiltered, real-world images where most artifacts are borderline.
Editorial extensions
If this is right
- Artifact detection for diffusion models can be data-efficient: trajectory features reduce the annotated-data requirement to a few hundred images, roughly 0.1% of what prior image-based methods need.
- A drop or sustained decline in the Similarity Trajectory is a usable red flag for artifacts, since the average maximum decline is 0.027 for artifact-exhibiting images versus 0.017 for natural-looking ones.
- The averaged Similarity Trajectory can serve as a complementary model-evaluation signal to FID: adjacent-latent similarity increases with both training progress and model capacity in the EDM2 framework.
- Human evaluation on paired images shows the trajectory-based classifier's artifact picks align with human judgment about 2.7 times more often than they contradict it.
Reading between the lines
- We infer that the same trajectory signal could support real-time feedback during sampling, such as rejecting or restarting a run when a large similarity drop is detected, something the paper does not test.
- The claim is established on a deliberately filtered distribution (only extreme artifact and clearly natural images); we infer that extending the approach to continuous artifact severity will require either richer labels or trajectory features tailored to borderline cases.
- We infer that the connection between trajectory smoothness and artifact presence may transfer to other iterative generative paradigms, such as flow matching or consistency models, that also produce a denoising path, though the paper only studies DDIM and EDM2/Heun samplers.
Signed reviews
Editorial analysis
A structured set of objections, weighed in public.
Referee Report
Summary. The paper introduces the Similarity Trajectory, defined as the sequence of DreamSim similarities between consecutive denoised predictions x0^(t) during diffusion sampling. The central claim is that a drop or low similarity in this trajectory signals the presence of artifacts in the final generated image. The authors build a random forest classifier on statistical features of the trajectory (including Haar transform coefficients and k-NN probabilities) trained on 680 hand-filtered images from Stable Diffusion 2, report 72.35% accuracy in 10-fold cross-validation, and support the claim with a max-decline analysis, a human evaluation, and a preliminary model-assessment study on EDM2 checkpoints. The paper positions this as enabling artifact detection with orders-of-magnitude less labeled data than prior work.
Significance. The idea of using the sampling process rather than the final image for artifact detection is novel and potentially valuable, especially if it truly enables low-data training. The Similarity Trajectory is a simple, generalizable concept that could be applied to any denoising-based generative model. However, the significance is currently limited by evaluation weaknesses: the cross-validation likely suffers from prompt-level leakage, the dataset is filtered to exclude borderline cases, there is no raw-image baseline, and the human evaluation lacks a chance baseline. If the authors can show that the result survives prompt-grouped cross-validation and that trajectory features outperform raw-image features under the same data budget, the contribution would be solid. The model-evaluation part (Section 7.4) is explicitly preliminary and would benefit from more extensive validation.
major comments (5)
- [Section 7.2, Section 6.1] The 10-fold cross-validation splits images, not prompts. Given that the dataset contains 250 prompts with 9 images per prompt, and that DreamSim is a semantic similarity metric, trajectories from the same prompt are likely to be more similar to each other than to trajectories from different prompts regardless of artifact status. This makes the reported 72.35% accuracy potentially inflated by prompt identity leakage. Please report the accuracy under prompt-conditioned CV (e.g., grouped k-fold by prompt or leave-one-prompt-out) and describe how the 255 natural images were selected; if they are the first 255 in the dataset order, the prompt distribution may differ between classes, further enabling prompt-driven shortcuts.
- [Section 6.1] The dataset is manually filtered to 425 natural-looking and 255 artifact-exhibiting images, discarding all images that fall between these categories. This means the classifier and the max-decline analysis are evaluated on a distribution free of borderline cases. Since real deployment includes images across the full severity spectrum, the reported 72.35% accuracy and the 0.017 vs 0.027 max-decline gap may not transfer. Please report performance on an unfiltered random sample or provide a principled discussion of how the filtering affects the claimed correlation and the classifier's expected real-world performance.
- [Section 7.2, Section 5.2] The paper claims that the Similarity Trajectory enables classification with only 680 images, which is 0.1% of the data used in prior work. However, there is no ablation comparing trajectory features to raw-image features (or final-image features) under the same data budget and evaluation protocol. A classifier trained on final-image features with the same 680 images could potentially achieve similar accuracy, which would undermine the specific advantage of the trajectory. Please add such a baseline (e.g., a small CNN or a classifier on pixel statistics) to demonstrate that the trajectory, not merely the small dataset, is what enables the result.
- [Section 7.3] The human evaluation reports 58.1% agreement, 21.7% disagreement, and 20.2% draws, but no chance baseline or statistical test is provided. With three possible outcomes and draws handled as a separate category, the agreement rate must be compared to a chance model (e.g., random selection among non-draw responses) and accompanied by confidence intervals or a significance test. In addition, the comparison to prior work's 71.4% agreement (Section 7.3) is not apples-to-apples because the pairing protocol differs: prior work pairs best-of-100 vs random, while this paper pairs highest vs lowest probability according to the classifier.
- [Section 7.1] The maximum-decline analysis is restricted to time steps 13-34, a window selected based on Gini impurity computed on the same dataset that is later used for evaluation (Figure 4). This data-driven selection can inflate the apparent difference between artifact and natural images. Please validate the selected window on a held-out subset or report sensitivity of the max-decline difference to the choice of time-step range.
minor comments (7)
- [Section 4, Eq. (5) and Section 5.1] The notation in Eq. (5) is confusing: {z_t}^1_{t=T-1} should be {z_t}_{t=1}^{T-1}. Similarly, the definition of D_max has reversed index bounds; it should read '1 ≤ s < e ≤ T-1' for a strictly decreasing subsequence, and the condition 'zs > zs+1 > ... > ze' should be made explicit.
- [Section 5.2, Eqs. (8)-(9)] The definitions of mean crossings and zero crossings assume an ordering on the elements of set S, but S is defined as a set. Please clarify that these features are computed on the ordered sequence rather than an unordered set.
- [Section 6.2 and Section 7.4] The model evaluation uses RMSE between denoised latents as a dissimilarity metric, whereas the classifier experiments use DreamSim on decoded images. Please clarify the relationship between these two similarity measures and whether the RMSE-based evaluation supports the same conclusions as the DreamSim-based trajectory analysis.
- [Section 7.4, Figure 5] The text states that stronger models exhibit 'higher similarity' between adjacent latents, but the y-axis of Figure 5 is RMSE (where larger values indicate more dissimilarity). Please make the axis labeling and the accompanying explanation consistent.
- [Throughout] There are several typos and formatting issues, including 'theSimilarity Trajectory' appearing without a space in multiple places (Introduction, Section 5.2), and 'Similarity' used where 'Similarly' is intended. Please proofread the manuscript.
- [Section 7.3] Please clarify how the 10 human participants were split across the 100 test pairs: does each of the 50 pairs in a group get evaluated by all 5 participants in that group, or do participants evaluate disjoint subsets? This affects how the agreement percentage is computed and interpreted.
- [Section 7.1] Reference [27] is cited as prior work showing that the middle section of the sampling process has the greatest influence on the final image. Please ensure this citation is appropriate, as ShiftDDPMs focuses on shifting diffusion trajectories rather than on time-step importance for artifact formation.
Circularity Check
No significant circularity: labels come from manual screening of final images, and the classifier's held-out and external evaluations are independent of the trajectory construction.
full rationale
The paper's central claim is an empirical correlation between the similarity of consecutive denoised predictions during sampling and the presence of human-visible artifacts. The Similarity Trajectory is defined by Eq. (5) from denoised images x0^(t) computed via Eqs. (6) and (7), while artifact labels are assigned by manual review of the final generated image only; the paper explicitly states that this selection 'focuses solely on the quality of the final generated image as opposed to looking at the Similarity Trajectory' (Sec. 6.1). The Dmax statistic (Sec. 5) is a descriptive comparison of the two labeled groups, not a fitted parameter renamed as a prediction. The 72.35% accuracy (Sec. 7.2) is obtained by training a random forest on trajectory-derived features and evaluating it with 10-fold cross-validation, so held-out test images are not used in fitting the model. The human evaluation on unseen Pick-a-Pic prompts (Sec. 7.3) provides an external, independent benchmark. The middle-window selection is justified by an external citation [27] and by in-sample Gini-importance analysis, but the paper does not present the resulting Dmax gap as an out-of-sample prediction, so this is at most data-driven exploration rather than circular reasoning. The acknowledged limitations—imperfect accuracy, varied artifact sources, and the need for further model-evaluation studies—are consistent with an empirical correlation rather than a tautology. The remaining concerns, such as possible prompt-level leakage if cross-validation splits were by image rather than by prompt and the use of an extreme-filtered dataset, are validity and generalizability threats, not circularity: they do not make any result equivalent to its inputs by construction. No load-bearing self-citation or uniqueness argument is present. Overall circularity score: 0.
Assumptions & free parameters
free parameters (4)
- middle time-window for max-decline analysis =
time steps 13 to 34 of 50
- SNR display range in model evaluation =
SNR from 5e-2 to 1e4
- balanced subset size =
255 natural images (first 255 of 425)
- random forest and k-NN hyperparameters =
1,000 trees; k not specified in main text
assumptions (4)
- domain assumption DreamSim similarity scores align with human perception of image similarity.
- standard math Equations 6 and 7 correctly recover the denoised image x0 for DDIM and Heun samplers.
- domain assumption A sustained drop in consecutive denoised-image similarity is causally linked to artifact formation.
- domain assumption Haar detail coefficients capture the artifact-relevant fluctuations in the trajectory.
Cite this review
Pith. "Pith review of Similarity Trajectories: Linking Sampling Process to Artifacts in Diffusion-Generated Images." pith.science (2026). https://pith.science/paper/NJO53PZN
@misc{pith2026241217109,
  author       = {Pith},
  title        = {Pith review of: Similarity Trajectories: Linking Sampling Process to Artifacts in Diffusion-Generated Images},
  year         = {2026},
  howpublished = {\url{https://pith.science/paper/NJO53PZN}},
  note         = {Machine review of arXiv:2412.17109}
}
read the original abstract
Artifact detection algorithms are crucial to correcting the output generated by diffusion models. However, because of the variety of artifact forms, existing methods require substantial annotated data for training. This requirement limits their scalability and efficiency, which restricts their wide application. This paper shows that the similarity of denoised images between consecutive time steps during the sampling process is related to the severity of artifacts in images generated by diffusion models. Building on this observation, we introduce the concept of Similarity Trajectory to characterize the sampling process and its correlation with the image artifacts presented. Using an annotated data set of 680 images, which is only 0.1% of the amount of data used in the prior work, we trained a classifier on these trajectories to predict the presence of artifacts in images. By performing 10-fold validation testing on the balanced annotated data set, the classifier can achieve an accuracy of 72.35%, highlighting the connection between the Similarity Trajectory and the occurrence of artifacts. This approach enables differentiation between artifact-exhibiting and natural-looking images using limited training data.
Figures


Figures from the paper (2 more)


Reference graph
Works this paper leans on
- [1]
-
[2]
Diffusion pos- terior sampling for general noisy inverse problems
Hyungjin Chung, Jeongsol Kim, Michael Thompson Mc- cann, Marc Louis Klasky, and Jong Chul Ye. Diffusion pos- terior sampling for general noisy inverse problems. In The Eleventh International Conference on Learning Representa- tions, 2023. 1
work page 2023
-
[3]
Thomas M. Cover and Peter E. Hart. Nearest neighbor pat- tern classification. IEEE Transactions on Information The- ory, 13:21–27, 1967. 5
work page 1967
-
[4]
Diffusion models beat gans on image synthesis
Prafulla Dhariwal and Alexander Nichol. Diffusion models beat gans on image synthesis. In M. Ranzato, A. Beygelz- imer, Y . Dauphin, P.S. Liang, and J. Wortman Vaughan, ed- itors, Advances in Neural Information Processing Systems , volume 34, pages 8780–8794. Curran Associates, Inc., 2021. 2
work page 2021
-
[5]
Dreamsim: Learning new dimensions of human visual simi- larity using synthetic data
Stephanie Fu, Netanel Yakir Tamir, Shobhita Sundaram, Lucy Chai, Richard Zhang, Tali Dekel, and Phillip Isola. Dreamsim: Learning new dimensions of human visual simi- larity using synthetic data. In Thirty-seventh Conference on Neural Information Processing Systems, 2023. 5
work page 2023
-
[6]
Ian Goodfellow, Jean Pouget-Abadie, Mehdi Mirza, Bing Xu, David Warde-Farley, Sherjil Ozair, Aaron Courville, and Yoshua Bengio. Generative adversarial nets. In Z. Ghahra- mani, M. Welling, C. Cortes, N. Lawrence, and K.Q. Wein- berger, editors, Advances in Neural Information Processing Systems, volume 27. Curran Associates, Inc., 2014. 2
work page 2014
-
[7]
Gans trained by a two time-scale update rule converge to a local nash equilib- rium
Martin Heusel, Hubert Ramsauer, Thomas Unterthiner, Bernhard Nessler, and Sepp Hochreiter. Gans trained by a two time-scale update rule converge to a local nash equilib- rium. In Advances in Neural Information Processing Sys- tems, 2017. 6
2017
-
[8]
Denoising dif- fusion probabilistic models
Jonathan Ho, Ajay Jain, and Pieter Abbeel. Denoising dif- fusion probabilistic models. In H. Larochelle, M. Ranzato, R. Hadsell, M.F. Balcan, and H. Lin, editors, Advances in Neural Information Processing Systems , volume 33, pages 6840–6851. Curran Associates, Inc., 2020. 2
work page 2020
Show all 34 references
-
[9]
Elucidating the design space of diffusion-based generative models
Tero Karras, Miika Aittala, Timo Aila, and Samuli Laine. Elucidating the design space of diffusion-based generative models. In Advances in Neural Information Processing Sys- tems, 2022. 4
2022
-
[10]
Analyzing and improving the training dynamics of diffusion models
Tero Karras, Miika Aittala, Jaakko Lehtinen, Janne Hellsten, Timo Aila, and Samuli Laine. Analyzing and improving the training dynamics of diffusion models. InProc. CVPR, 2024. 2, 3, 6, 7
2024
-
[11]
Denoising diffusion restoration models
Bahjat Kawar, Michael Elad, Stefano Ermon, and Jiaming Song. Denoising diffusion restoration models. In Advances in Neural Information Processing Systems, 2022. 1
2022
-
[12]
Auto-encoding varia- tional bayes, 2022
Diederik P Kingma and Max Welling. Auto-encoding varia- tional bayes, 2022. 2
2022
-
[13]
Pick-a-pic: An open dataset of user preferences for text-to-image generation
Yuval Kirstain, Adam Polyak, Uriel Singer, Shahbuland Ma- tiana, Joe Penna, and Omer Levy. Pick-a-pic: An open dataset of user preferences for text-to-image generation. In A. Oh, T. Naumann, A. Globerson, K. Saenko, M. Hardt, and S. Levine, editors, Advances in Neural Informat...
2023
-
[14]
Srdiff: Single image super-resolution with diffusion probabilistic models
Haoying Li, Yifan Yang, Meng Chang, Shiqi Chen, Huajun Feng, Zhihai Xu, Qi Li, and Yueting Chen. Srdiff: Single image super-resolution with diffusion probabilistic models. Neurocomputing, 2022. 1
2022
-
[15]
Collins, Yiwen Luo, Yang Li, Kai J Kohlhoff, Deepak Ramachandran, and Vidhya Naval- pakkam
Youwei Liang, Junfeng He, Gang Li, Peizhao Li, Arseniy Klimovskiy, Nicholas Carolan, Jiao Sun, Jordi Pont-Tuset, Sarah Young, Feng Yang, Junjie Ke, Krishnamurthy Dj Dvijotham, Katherine M. Collins, Yiwen Luo, Yang Li, Kai J Kohlhoff, Deepak Ramachandran, and Vidhya Naval- pakk...
2024
-
[16]
Belongie, Lubomir D
Tsung-Yi Lin, Michael Maire, Serge J. Belongie, Lubomir D. Bourdev, Ross B. Girshick, James Hays, Pietro Perona, Deva Ramanan, Piotr Doll’a r, and C. Lawrence Zitnick. Microsoft COCO: common objects in context. CoRR, abs/1405.0312,
-
[17]
Repaint: Inpaint- ing using denoising diffusion probabilistic models
Andreas Lugmayr, Martin Danelljan, Andres Romero, Fisher Yu, Radu Timofte, and Luc Van Gool. Repaint: Inpaint- ing using denoising diffusion probabilistic models. In Pro- ceedings of the IEEE/CVF Conference on Computer Vision and Pattern Recognition (CVPR), pages 11461–11471, June
-
[18]
SDXL: Improving latent diffusion models for high-resolution image synthesis
Dustin Podell, Zion English, Kyle Lacey, Andreas Blattmann, Tim Dockhorn, Jonas M ¨uller, Joe Penna, and Robin Rombach. SDXL: Improving latent diffusion models for high-resolution image synthesis. In The Twelfth Inter- national Conference on Learning Representations, 2024. 2, 6
2024
-
[19]
Learning transferable visual models from natural language supervision
Alec Radford, Jong Wook Kim, Chris Hallacy, Aditya Ramesh, Gabriel Goh, et al. Learning transferable visual models from natural language supervision. In Proceedings of the 38th International Conference on Machine Learning ,
-
[20]
High-resolution image synthesis with latent diffusion models
Robin Rombach, Andreas Blattmann, Dominik Lorenz, Patrick Esser, and Bj ¨orn Ommer. High-resolution image synthesis with latent diffusion models. In Proceedings of the IEEE/CVF Conference on Computer Vision and Pattern Recognition (CVPR), June 2022. 1, 2, 6
2022
-
[21]
U-net: Convolutional networks for biomedical image segmentation
Olaf Ronneberger, Philipp Fischer, and Thomas Brox. U-net: Convolutional networks for biomedical image segmentation. In Medical Image Computing and Computer-Assisted Inter- vention - MICCAI 2015 - 18th International Conference Mu- nich, Germany, October 5 - 9, 2015, Proceeding...
2015
-
[22]
Denois- ing diffusion implicit models
Jiaming Song, Chenlin Meng, and Stefano Ermon. Denois- ing diffusion implicit models. In International Conference on Learning Representations, 2021. 4
2021
-
[23]
Stankovi ´c and Bogdan J
Radomir S. Stankovi ´c and Bogdan J. Falkowski. The haar wavelet transform: its status and achievements. Computers and Electrical Engineering, 29(1):25–44, 2003. 5, 11
2003
-
[24]
Better aligning text-to-image models with human preference
Xiaoshi Wu, Keqiang Sun, Feng Zhu, Rui Zhao, and Hong- sheng Li. Better aligning text-to-image models with human preference. ArXiv, abs/2303.14420, 2023. 1, 3
2023 arXiv
-
[25]
Imagere- ward: Learning and evaluating human preferences for text- to-image generation
Jiazheng Xu, Xiao Liu, Yuchen Wu, Yuxuan Tong, Qinkai Li, Ming Ding, Jie Tang, and Yuxiao Dong. Imagere- ward: Learning and evaluating human preferences for text- to-image generation. In Thirty-seventh Conference on Neu- ral Information Processing Systems, 2023. 1, 3
2023
-
[26]
Perceptual artifacts localization for image synthesis tasks
Lingzhi Zhang, Zhengjie Xu, Connelly Barnes, Yuqian Zhou, Qing Liu, He Zhang, Sohrab Amirghodsi, Zhe Lin, Eli Shechtman, and Jianbo Shi. Perceptual artifacts localization for image synthesis tasks. In Proceedings of the IEEE/CVF International Conference on Computer Vision (ICC...
2023
-
[27]
Shiftddpms: Exploring conditional diffusion models by shifting diffusion trajectories
Zijian Zhang, Zhou Zhao, Jun Yu, and Qi Tian. Shiftddpms: Exploring conditional diffusion models by shifting diffusion trajectories. arXiv preprint arXiv:2302.02373, 2023. 6
2023 arXiv
-
[28]
Each element zt represents the similarity score between the denoised images in consecutive time steps t and t − 1
Supplementary Material Detailed Information for the Experimental Setup We define theSimilarity Trajectory as a discrete time se- ries {zt}1 t=T −1, where T is the total number of time steps in the sampling process. Each element zt represents the similarity score between the de...
-
[29]
µS = 1 NS X s∈S s, (14) where NS is the number of elements in the set S
Mean (µS): The average value of the data in the setS. µS = 1 NS X s∈S s, (14) where NS is the number of elements in the set S
-
[30]
This is related to fluctuation in the Similarity Trajectory for sets in the time domain
Standard Deviation (σS): Measures the dispersion of the data in the set S. This is related to fluctuation in the Similarity Trajectory for sets in the time domain. σS = s 1 NS X s∈S (s − µS)2. (15)
-
[31]
The significance of percentiles lies in their relation to the fluctuation of the Similarity Trajectory for detail coef- ficients
Percentile: We extract the 5th, 25th, 50th, 75th, and 95th percentiles for each obtained set’s values. The significance of percentiles lies in their relation to the fluctuation of the Similarity Trajectory for detail coef- ficients
-
[32]
This describes how rapidly the Similarity Trajec- tory fluctuates in the time domain
Number of Mean Crossings ( Cµ,S): Counts how many times the data crosses its mean value in the set S. This describes how rapidly the Similarity Trajec- tory fluctuates in the time domain. Cµ,S = NSX i=1 I [(Si+1 − µs) (Si − µs) < 0] , (16) where NS is the total number of eleme...
-
[33]
Number of Zero Crossings (C0,S): Counts how many times the data crosses zero in set S. Note that in detail coefficients, this represents how many times the Sim- ilarity Trajectory changes direction, from monotoni- cally increasing to monotonically decreasing or vice versa. C0,...
-
[34]
Again, this is another metric characterizing the fluctuations of the set
Entropy (Es): Measures how uniform of the data in set S is. Again, this is another metric characterizing the fluctuations of the set. ES = − X i p(S) i log2 p(S) i , (18) where p(S) i is the probability of the i-th bin in the his- togram of the data in set S. These features ar...
Reviewed August 11, 2026 · model on record in the stance chip above.
Discussion (0). Continue with ORCID to comment.