REVIEW 5 major objections 6 minor 46 references
Toward Maximizing the Visibility of Content in Social Media Brand Pages: A Temporal Analysis
T0 review · 5 major / 6 minor · reviewed 2026-08-14 · deepseek-v4-flash
Pith's one-line read Posting at times chosen from a page's audience reaction history can draw seven times more reactions than an average posting time.
desk verdict Useful descriptive patterns for Facebook brand pages, but the headline 7x gain is an in-sample artifact and should be read skeptically. read the letter →
The pith
A machine-rendered reading of the paper's core claim, the machinery that carries it, and where it could break.
The reading
What carries the argument
The carrying object is the reaction profile vector $R_k(P_x)$: for each page, the count of audience reactions received in each 15-minute bucket of the day, summed across years. Rankings derived from these vectors define the schedules, and the reaction gain $RG(C,k) = \delta(C,k)/\omega(C)$ evaluates them as reaction per post in a bucket divided by the category's average reaction per post. The same cumulative counts that build the schedule also define its evaluation, so the reported gain is an internal comparison on the training data.
What would settle it
Take the same pages, randomize new posts between the top reaction bucket and a bucket with average gain, and compare reactions per post after two weeks; if the gap is far below sevenfold, the historical ratio was not predictive. A cheaper version is a temporal holdout: build the schedule on 2011–2013 and evaluate on 2014–2015.
Extended reading notes
Core claim
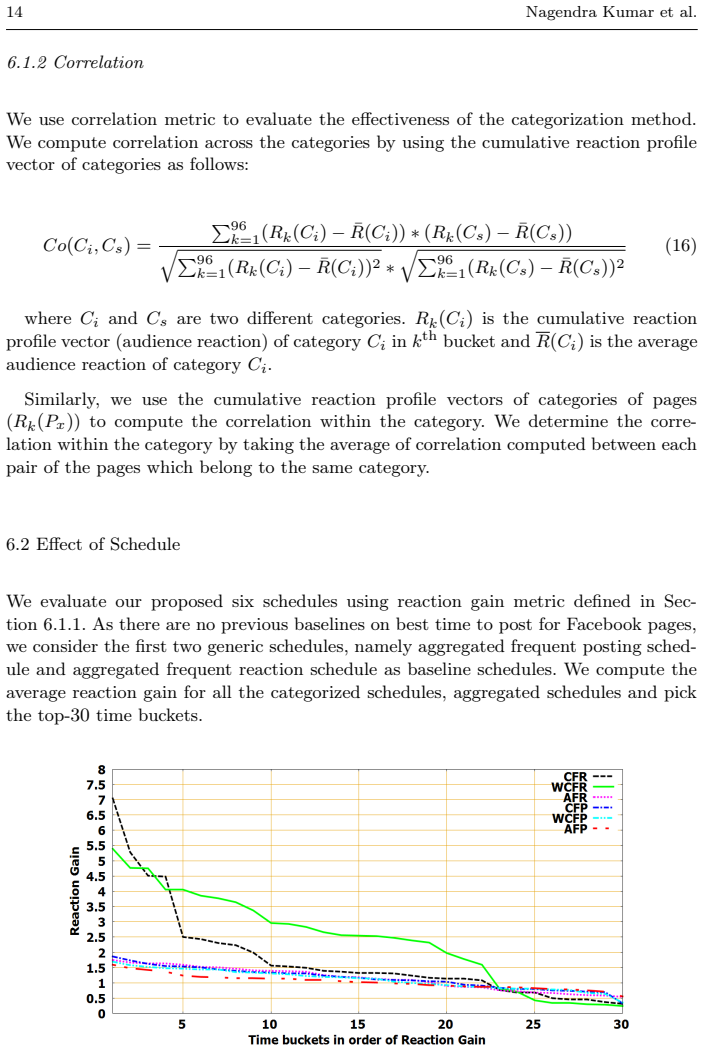
The central claim is that audience reaction profiles—histograms of how many reactions arrive in each 15-minute bucket of the day—are stable enough to serve as posting schedules, and that posting in the buckets where reactions concentrate produces far more reactions per post than posting at an average time. On its dataset, the categorized frequent reaction schedule has reaction gain 7 in the best bucket, the weighted version 5.4, and all posting-based schedules below 2. The paper also claims that pages cluster into categories with coherent reaction patterns; the top features for categorization are reactions within the first hour, posts per day, and page type.
Load-bearing premise
The 7x result assumes that a 15-minute slot that drew many reactions per post in the past will keep drawing many reactions per post in the future, independently of what is posted, which page posts it, and how audience habits change.
Editorial extensions
If this is right
- A brand page that posts in its category's top reaction bucket should, on the paper's numbers, receive roughly seven times the average reactions per post it would get without a schedule.
- A new page with little reaction history can be assigned to a category using reaction-within-first-hour, posts-per-day, and page type, then use that category's schedule.
- Reaction-based schedules outperform posting-based schedules by a wide margin, so the paper's result is not just 'post when other admins post.'
- Because 84% of reactions arrive within 24 hours, the timing decision is essentially a same-day decision; the top 15-minute bucket is where that day's reaction window concentrates.
- Content type matters too: videos and photos earn more reactions per post than links, so timing gains can be combined with content-choice gains.
Reading between the lines
- The 7x gain is probably an upper bound: the schedule is selected from the same historical counts that define the gain, so regression toward the mean will shrink the realized effect on new posts.
- A temporal holdout (build the schedule on 2011–2013, test on 2014–2015) would tell how much of the gain transfers; the paper reports no such test.
- The daily peaks line up with office hours and commutes, so the schedule is likely specific to the city, era, and page types in the dataset; re-running elsewhere would show how portable it is.
- A content-and-time policy (post video in the top bucket) is a natural extension the paper stops short of making.
Signed reviews
Editorial analysis
A structured set of objections, weighed in public.
Referee Report
Summary. The paper addresses when brand-page administrators should post on Facebook to maximize audience reactions. Using Graph API data from 100 pages (20 each in e-commerce, traffic, telecommunication, hospital, and politics) over 2011–2015, with roughly 0.3 million posts and 10 million comment timestamps, the authors define two aggregate and four category-based 'schedules' (frequent posting, frequent reaction, and weighted variants). Pages are clustered into five categories by k-medoid on reaction-profile similarity using three selected features, and schedules are ranked over 96 fifteen-minute buckets. The headline claim is that the categorized frequent reaction schedule achieves a seven-fold reaction gain over the average reaction rate (Section 6.2); the paper also reports daily, weekly, and monthly audience reaction patterns and shows that content type correlates strongly with reactions (Section 6.5).
Significance. If properly established, the headline result would offer a directly actionable, low-cost tool for brand-page managers, and the large five-year dataset would make the empirical patterns (84% of reactions within 24 hours; diurnal, weekly, and seasonal rhythms; content-type effects) a useful reference for the community. The formal problem statements and explicit schedule equations (Eqs. 2–14) are clear and would be straightforward to re-implement, which is a genuine strength. However, the significance of the central contribution hinges entirely on the validity of the reaction-gain evaluation, and for the reasons in the major comments—the misalignment of reaction-arrival and post-creation buckets, the in-sample nature of the 7x figure, and the absence of confound controls—the paper as it stands does not establish the headline claim; a corrected analysis could plausibly yield a much smaller gain.
major comments (5)
- [§5, §6.1.1, Eqs. (12)–(14)] The reaction-gain metric is misaligned with the claims it is used to support. R_k(C_i) is defined (Section 5) as reactions whose timestamps fall in bucket k, while M_k(C_i) is the number of posts created in bucket k. Since the paper itself shows that 84% of reactions arrive within 24 hours of posting (Figure 1), most reactions in bucket k are responses to posts created in earlier buckets, not to posts created in the same bucket. The ratio δ(C_i,k)=R_k/M_k therefore does not measure “reactions received when the category posts in time bucket t_k” as claimed in Section 6.1.1; a bucket with high incoming reaction volume but low posting volume will exhibit a large RG even if posting time has no causal effect on engagement. The central 7x figure is consequently not evidence for the posting-time recommendation. The evaluation should instead compute, for each bucket, the average number of reactions received per post created in that bucket (for example within a fixed 24-hour horizon), which the dataset’s post and comment timestamps can support.
- [§6.2, Eqs. (6), (11), (14)] The reported 7x gain is an in-sample maximum with no validation. The schedule ranking (Eq. (6) or Eq. (11)) and the reaction gain (Eq. (14)) are both computed from the same cumulative counts R_k(C_i) and M_k(C_i) over the same 100 pages and the same 2011–2015 years. No temporal holdout, page-level cross-validation, bootstrap confidence interval, or permutation test is provided, and no minimum-post-count floor is imposed on δ(C_i,k). Selecting the best of 96 buckets on the basis of its historical per-bucket ratio and then reporting that same ratio as the achievable gain is an upward-biased estimate of the best bucket’s true effect. As written, the paper provides no evidence that the 7x figure would transfer to future posts or to new pages.
- [§6.5, Table 5] Content type is a strong potential confounder for the posting-time effect. Table 5 shows that links constitute 78.6% of posts but yield only 54.16% of reactions, while videos yield more than twice their share of reactions per post. If the content-type mix varies across time buckets (for instance, news links in the morning and videos in the evening), the apparent schedule gains are not identified as posting-time effects. The evaluation contains no control for content type, page size, or page identity, and the abstract’s claim that the posting time is “derived taking other factors into account” is not substantiated by the reported analysis.
- [§2.2 vs. Abstract/§1] The outcome variable is comments only, not “likes, comments, shares.” Section 2.2 states that only comment timestamps were accessible and that comments are used as the reaction variable, so the “10 million audience reactions” in Table 1 are 10 million comments. The Abstract and Introduction nevertheless frame the contribution in terms of audience reactions generally (“in the form of likes, comments, shares, etc.”). This mismatch means the headline claims exceed the measured outcome; either the claims should be restricted to comments or additional reaction types must be included.
- [§4.3, §6.3, Tables 3–4] The categorization is validated using the same reaction-profile vectors that define the clustering objective, so the reported within- and across-category correlations largely restate the clustering criterion. K-medoid similarity is defined as the correlation between pages’ cumulative reaction profiles R_k (Section 4.3, cf. Eq. (16)), and the “effectiveness” of the categorization is then measured as the correlation of these same profiles within and across clusters (Tables 3–4). High within-category and low across-category correlation are therefore partly by construction, not independent evidence that the categories are meaningful. An external validation—for instance, association of the learned clusters with the pages’ declared labels on held-out pages, or out-of-sample classification—is needed.
minor comments (6)
- [§6.4.1] The phrase “around 10 AM to 12 AM” for the telecommunications category should presumably read “10 AM to 12 PM”; as written it describes a period ending after midnight.
- [§5.1, Eq. (2)] The expression “in the tth_k bucket” appears to be a typesetting artifact; it should read “in the t_k-th bucket.”
- [§6.2] The number of buckets retained per schedule (“top-30”) is arbitrary; the paper should state how a page admin is expected to use the ranked list in practice (how many slots per day, and with what spacing).
- [Figure 3] The plot should include a clear legend for the six schedules (SAFP, SCFP, SWCFP, SAFR, SCFR, SWCFR), since the text refers to each by acronym.
- [§2.2] The dataset’s geographic location is not stated, although the monthly interpretations (elections, festive sales) are country-specific; the region should be reported for reproducibility.
- [§6.2] The statement that “there are no previous baselines on best time to post for Facebook pages” is too strong given the works cited in Section 7 (refs. [16], [35], [45]); at minimum those methods should be discussed as candidate baselines, or the claim should be softened.
Circularity Check
Headline 7x gain is an in-sample property of the same reaction/posting counts used to choose the schedule; no holdout or denominator floor is provided.
-
fitted input called prediction
[Section 5.2 (Eq. 6), Section 6.1.1 (Eqs. 12-14), Section 6.2]
"Reaction gain metric is used to compute the performance of proposed schedules. ... δ(Ci,k ) = Rk(Ci)/Mk(Ci) (12) ... RG(Ci,k ) = δ(Ci,k )/ω(Ci) (14) ... Scf r k (Ci) is the fraction of total reactions received on category Ci at kth bucket ... We rank the buckets in decreasing order of ... Scf r k (Ci). ... Reaction gain of categorized frequent reaction schedule (SCF R) is highest (i.e., seven times better) in its top bucket."
The schedule is exactly the per-bucket reaction share R_k(C_i)/ΣR (Eq. 6), and the evaluation metric RG(C_i,k) = [R_k(C_i)/M_k(C_i)] / [ΣR_k/ΣM_k] (Eqs. 12-14) is computed from the same cumulative R_k and M_k over the same 2011-2015 pages. There is no train/test split, holdout, page-level cross-validation, minimum M_k, or confidence interval. The '7x' figure is therefore an in-sample property of the bucket selected by ranking R_k, not an out-of-sample prediction of future posts. The paper even acknowledges SCFR 'is biased towards those buckets which receive a large number of audience reactions,' yet presents that same biased in-sample ratio as the headline improvement.
full rationale
The central claim is only partially circular, not a formal tautology: the reaction gain depends on M_k as well as R_k, and the schedule selection uses only R_k, so a high-R_k bucket is not guaranteed to have high RG. However, all quantities are computed from the same cumulative 2011-2015 reaction and posting profiles on the same 100 pages, and the reported 7x figure is the top-bucket value of the very reaction profile used to rank buckets. No temporal holdout, page split, or min-count threshold is given, so the headline number is an in-sample selection artifact rather than an independent prediction. The paper itself admits SCFR is biased toward high-reaction buckets. The categorization evaluation (correlation of the same reaction profiles used to cluster) is also in-sample, but this is secondary. No load-bearing self-citation or imported uniqueness theorem appears in the derivation. The Section 2.2 admission that only comment timestamps were accessible means the outcome is comments, not the full like/comment/share total implied by 'audience reactions'; this is a correctness and measurement limitation, not a circularity. Because the central quantitative claim reduces to a selected in-sample ratio with no external validation, the circularity score is 6 rather than 0-2.
Assumptions & free parameters
free parameters (3)
- Time bucket size =
15 minutes (96 buckets per day)
- Number of clusters k for k-medoid categorization =
Not reported; chosen via elbow method in Section 4.3
- Top reaction-determining features =
Reaction within first hour, posts per day, page type
assumptions (5)
- domain assumption Facebook's News Feed amplifies posts that receive early audience reactions, creating a feedback loop that makes posting time causally important.
- domain assumption Comments are a valid proxy for all audience reactions, including likes and shares.
- domain assumption A post receives essentially all of its reactions within one week, so a one-week aggregation window captures total reactions.
- domain assumption The 100 pages from one geographic region, split equally across five categories, are representative enough to support general statements about Facebook brand pages.
- standard math Standard probability normalization and Pearson correlation are valid tools for ranking time buckets and measuring category similarity.
Cite this review
Pith. "Pith review of Toward Maximizing the Visibility of Content in Social Media Brand Pages: A Temporal Analysis." pith.science (2026). https://pith.science/paper/NZFWBILF
@misc{pith2026190808622,
  author       = {Pith},
  title        = {Pith review of: Toward Maximizing the Visibility of Content in Social Media Brand Pages: A Temporal Analysis},
  year         = {2026},
  howpublished = {\url{https://pith.science/paper/NZFWBILF}},
  note         = {Machine review of arXiv:1908.08622}
}
read the original abstract
A large amount of content is generated everyday in social media. One of the main goals of content creators is to spread their information to a large audience. There are many factors that affect information spread, such as posting time, location, type of information, number of social connections, etc. In this paper, we look at the problem of finding the best posting time(s) to get high content visibility. The posting time is derived taking other factors into account, such as location, type of information, etc. In this paper, we do our analysis over Facebook pages. We propose six posting schedules that can be used for individual pages or group of pages with similar audience reaction profile. We perform our experiment on a Facebook pages dataset containing 0.3 million posts, 10 million audience reactions. Our best posting schedule can lead to seven times more number of audience reactions compared to the average number of audience reactions that users would get without following any optimized posting schedule. We also present some interesting audience reaction patterns that we obtained through daily, weekly and monthly audience reaction analysis.
Figures


Figures from the paper (3 more)


Reference graph
Works this paper leans on
-
[1]
In: Fifth International AAAI Conference on Weblogs and Social Media
Asur, S., Huberman, B.A., Szabo, G., Wang, C.: Trends in social media: Persistence and decay. In: Fifth International AAAI Conference on Weblogs and Social Media. pp. 434–437 (2011)
work page 2011
-
[2]
Backstrom, L.: News feed fyi: A window into news feed. https://www.facebook.com/ business/news/News-Feed-FYI-A-Window-Into-News-Feed (2013) Maximizing the Visibility of Content in Social Media Brand Pages 21
work page 2013
-
[3]
Management Science 61(8), 1902–1920 (2015)
Bapna, R., Umyarov, A.: Do your online friends make you pay? a randomized field exper- iment on peer influence in online social networks. Management Science 61(8), 1902–1920 (2015)
work page 2015
-
[4]
Internet and Network Economics pp
Bharathi,S.,Kempe,D.,Salek,M.:Competitiveinfluencemaximizationinsocialnetworks. Internet and Network Economics pp. 306–311 (2007)
work page 2007
-
[5]
Journalism Quarterly 71(3), 689–696 (1994)
Biswas, R., Riffe, D., Zillmann, D.: Mood influence on the appeal of bad news. Journalism Quarterly 71(3), 689–696 (1994)
work page 1994
-
[6]
science 329(5996), 1194–1197 (2010)
Centola, D.: The spread of behavior in an online social network experiment. science 329(5996), 1194–1197 (2010)
2010
-
[7]
Chen, W., Wang, Y., Yang, S.: Efficient influence maximization in social networks. In: Proceedings of the 15th ACM SIGKDD international conference on Knowledge discovery and data mining. pp. 199–208. ACM (2009)
work page 2009
-
[8]
Cheng, J., Adamic, L., Dow, P.A., Kleinberg, J.M., Leskovec, J.: Can cascades be pre- dicted? In: Proceedings of the 23rd international conference on World wide web. pp. 925–
Show all 46 references
-
[9]
In: Proceedings of the 7th ACM international conference on Web search and data mining
Das, A., Gollapudi, S., Munagala, K.: Modeling opinion dynamics in social networks. In: Proceedings of the 7th ACM international conference on Web search and data mining. pp. 403–412. ACM (2014)
2014
-
[10]
In: Proceedings of the 5th Information Interaction in Context Sym- posium
Esiyok, C., Kille, B., Jain, B.J., Hopfgartner, F., Albayrak, S.: Users’ reading habits in online news portals. In: Proceedings of the 5th Information Interaction in Context Sym- posium. pp. 263–266. ACM (2014)
2014
-
[11]
In: Advances in Neural Information Processing Systems
Farajtabar, M., Ye, X., Harati, S., Song, L., Zha, H.: Multistage campaigning in social networks. In: Advances in Neural Information Processing Systems. pp. 4718–4726 (2016)
2016
-
[12]
Machine learning 8(1), 87–102 (1992)
Fayyad, U.M., Irani, K.B.: On the handling of continuous-valued attributes in decision tree generation. Machine learning 8(1), 87–102 (1992)
1992
-
[13]
Neurocomputing 72(7), 1483–1493 (2009)
García-Laencina, P.J., Sancho-Gómez, J.L., Figueiras-Vidal, A.R., Verleysen, M.: K near- est neighbours with mutual information for simultaneous classification and missing data imputation. Neurocomputing 72(7), 1483–1493 (2009)
2009
-
[14]
In: Proceedings of the 2013 SIGMOD/PODS Ph
Guille, A.: Information diffusion in online social networks. In: Proceedings of the 2013 SIGMOD/PODS Ph. D. symposium. pp. 31–36. ACM (2013)
2013
-
[15]
In: IEEE International Conference on Systems, Man, and Cybernetics, SMC
Kao,L.J.,Huang,Y.P.,Sandnes,F.E.:Miningtime-dependentinfluentialusersinfacebook fans group. In: IEEE International Conference on Systems, Man, and Cybernetics, SMC
-
[16]
Karimi, M.R., Tavakoli, E., Farajtabar, M., Song, L., Gomez Rodriguez, M.: Smart broad- casting: Do you want to be seen? In: Proceedings of the 22nd ACM SIGKDD. pp. 1635–
-
[17]
In: Proceedings of the ninth ACM SIGKDD international conference on Knowl- edge discovery and data mining
Kempe, D., Kleinberg, J., Tardos, É.: Maximizing the spread of influence through a social network. In: Proceedings of the ninth ACM SIGKDD international conference on Knowl- edge discovery and data mining. pp. 137–146. ACM (2003)
2003
-
[18]
International Journal 1(6), 90–95 (2013)
Kodinariya, T.M., Makwana, P.R.: Review on determining number of cluster in k-means clustering. International Journal 1(6), 90–95 (2013)
2013
-
[19]
Artificial intelligence 97(1- 2), 273–324 (1997)
Kohavi, R., John, G.H.: Wrappers for feature subset selection. Artificial intelligence 97(1- 2), 273–324 (1997)
1997
-
[20]
Kwak, H., Lee, C., Park, H., Moon, S.: What is twitter, a social network or a news media? In: Proceedings of the 19th international conference on World wide web. pp. 591–600. ACM (2010)
2010
-
[21]
In: Data Mining (ICDM), 2013 IEEE 13th International Conference on
Kwon, S., Cha, M., Jung, K., Chen, W., Wang, Y.: Prominent features of rumor prop- agation in online social media. In: Data Mining (ICDM), 2013 IEEE 13th International Conference on. pp. 1103–1108. IEEE (2013)
2013
-
[22]
In: Proceedings of the 21st international conference on World Wide Web
Lehmann, J., Gonçalves, B., Ramasco, J.J., Cattuto, C.: Dynamical classes of collective attention in twitter. In: Proceedings of the 21st international conference on World Wide Web. pp. 251–260. ACM (2012)
2012
-
[23]
ICWSM 10, 90–97 (2010)
Lerman, K., Ghosh, R.: Information contagion: An empirical study of the spread of news on digg and twitter social networks. ICWSM 10, 90–97 (2010)
2010
-
[24]
In: Proceedings of the 15th ACM SIGKDD international conference on Knowledge discovery and data mining
Leskovec, J., Backstrom, L., Kleinberg, J.: Meme-tracking and the dynamics of the news cycle. In: Proceedings of the 15th ACM SIGKDD international conference on Knowledge discovery and data mining. pp. 497–506. ACM (2009)
2009
-
[25]
In: Proceedings of the 2007 SIAM international conference on data mining
Leskovec, J., McGlohon, M., Faloutsos, C., Glance, N., Hurst, M.: Patterns of cascading behavior in large blog graphs. In: Proceedings of the 2007 SIAM international conference on data mining. pp. 551–556. SIAM (2007) 22 Nagendra Kumar et al
2007
-
[26]
Expert Systems with Applications 41(11), 5115–5124 (2014)
Li, J., Peng, W., Li, T., Sun, T., Li, Q., Xu, J.: Social network user influence sense-making and dynamics prediction. Expert Systems with Applications 41(11), 5115–5124 (2014)
2014
-
[27]
In: Proceedings of the 2016 ACM on Multimedia Conference
Mazloom, M., Rietveld, R., Rudinac, S., Worring, M., van Dolen, W.: Multimodal popu- larity prediction of brand-related social media posts. In: Proceedings of the 2016 ACM on Multimedia Conference. pp. 197–201. ACM (2016)
2016
-
[28]
In: AAAI-98 workshop on learning for text categorization
McCallum, A., Nigam, K., et al.: A comparison of event models for naive bayes text classification. In: AAAI-98 workshop on learning for text categorization. vol. 752, pp. 41–48. Madison, WI (1998)
1998
-
[29]
Journal of Statistical Mechanics: Theory and Experiment 2013(12), P12002 (2013)
Pei, S., Makse, H.A.: Spreading dynamics in complex networks. Journal of Statistical Mechanics: Theory and Experiment 2013(12), P12002 (2013)
2013
-
[30]
Packt Publishing Ltd (2014)
Perkins, J.: Python 3 Text Processing with NLTK 3 Cookbook. Packt Publishing Ltd (2014)
2014
-
[31]
Business & Information Systems Engi- neering 5(3), 179–193 (2013)
Probst, F., Grosswiele, D.K.L., Pfleger, D.K.R.: Who will lead and who will follow: Iden- tifying influential users in online social networks. Business & Information Systems Engi- neering 5(3), 179–193 (2013)
2013
-
[32]
In: Big Data (Big Data), 2015 IEEE International Conference on
Rao, A., Spasojevic, N., Li, Z., DSouza, T.: Klout score: Measuring influence across mul- tiple social networks. In: Big Data (Big Data), 2015 IEEE International Conference on. pp. 2282–2289. IEEE (2015)
2015
-
[33]
In: Ninth International AAAI Conference on Web and Social Media
dos Rieis, J.C.S., de Souza, F.B., de Melo, P.O.S.V., Prates, R.O., Kwak, H., An, J.: Breaking the news: First impressions matter on online news. In: Ninth International AAAI Conference on Web and Social Media. pp. 357–366 (2015)
2015
-
[34]
In: ICWSM
Rizoiu, M.A., Xie, L.: Online popularity under promotion: Viral potential, forecasting, and the economics of time. In: ICWSM. pp. 182–191 (2017)
2017
-
[35]
In: Proceedings of the 21th ACM SIGKDD International Conference on Knowledge Discovery and Data Mining
Spasojevic, N., Li, Z., Rao, A., Bhattacharyya, P.: When-to-post on social networks. In: Proceedings of the 21th ACM SIGKDD International Conference on Knowledge Discovery and Data Mining. pp. 2127–2136. ACM (2015)
2015
-
[36]
Communications of the ACM 53(8), 80–88 (2010)
Szabo, G., Huberman, B.A.: Predicting the popularity of online content. Communications of the ACM 53(8), 80–88 (2010)
2010
-
[37]
Social Network Analysis and Mining 4(1), 174 (2014)
Tatar, A., Antoniadis, P., De Amorim, M.D., Fdida, S.: From popularity prediction to ranking online news. Social Network Analysis and Mining 4(1), 174 (2014)
2014
-
[38]
Taylor, D.G., Lewin, J.E., Strutton, D.: Friends, fans, and followers: do ads work on social networks? Journal of advertising research 51(1), 258–275 (2011)
2011
-
[39]
In: Proceedings of the 20th ACM SIGKDD international conference on Knowl- edge discovery and data mining
Tsytsarau, M., Palpanas, T., Castellanos, M.: Dynamics of news events and social media reaction. In: Proceedings of the 20th ACM SIGKDD international conference on Knowl- edge discovery and data mining. pp. 901–910. ACM (2014)
2014
-
[40]
Semantic Web 4(3), 245– 250 (2013)
Weaver, J., Tarjan, P.: Facebook linked data via the graph api. Semantic Web 4(3), 245– 250 (2013)
2013
-
[41]
In: Proceedings of the sixth ACM international conference on Web search and data mining
Wu, S., Das Sarma, A., Fabrikant, A., Lattanzi, S., Tomkins, A.: Arrival and departure dynamics in social networks. In: Proceedings of the sixth ACM international conference on Web search and data mining. pp. 233–242. ACM (2013)
2013
-
[42]
In: Proceedings of the 20th international conference on World wide web
Wu, S., Hofman, J.M., Mason, W.A., Watts, D.J.: Who says what to whom on twitter. In: Proceedings of the 20th international conference on World wide web. pp. 705–714. ACM (2011)
2011
-
[43]
In: Proceedings of the 12th ACM/IEEE-CS joint conference on Digital Libraries
Yan, R., Huang, C., Tang, J., Zhang, Y., Li, X.: To better stand on the shoulder of giants. In: Proceedings of the 12th ACM/IEEE-CS joint conference on Digital Libraries. pp. 51–
-
[44]
In: Proceedings of the 23rd ACM SIGKDD International Conference on Knowledge Discovery and Data Mining
Yu, L., Cui, P., Song, C., Zhang, T., Yang, S.: A temporally heterogeneous survival frame- work with application to social behavior dynamics. In: Proceedings of the 23rd ACM SIGKDD International Conference on Knowledge Discovery and Data Mining. pp. 1295–
-
[45]
In: Proceedings of the Tenth ACM International Conference on Web Search and Data Mining
Zarezade, A., Upadhyay, U., Rabiee, H.R., Gomez-Rodriguez, M.: Redqueen: An online algorithm for smart broadcasting in social networks. In: Proceedings of the Tenth ACM International Conference on Web Search and Data Mining. pp. 51–60. ACM (2017)
2017
-
[2016]
pp. 718–723. IEEE (2016)
2016
Reviewed August 14, 2026 · model on record in the stance chip above.
Discussion (0). Continue with ORCID to comment.