Phase diagram of the vortex state in an amorphous Re6Zr thin film exhibiting inverse melting
Pith reviewed 2026-05-25 02:53 UTC · model grok-4.3
The pith
Inverse melting of the vortex lattice in amorphous Re6Zr films is thickness-dependent.
A machine-rendered reading of the paper's core claim, the machinery that carries it, and where it could break.
Core claim
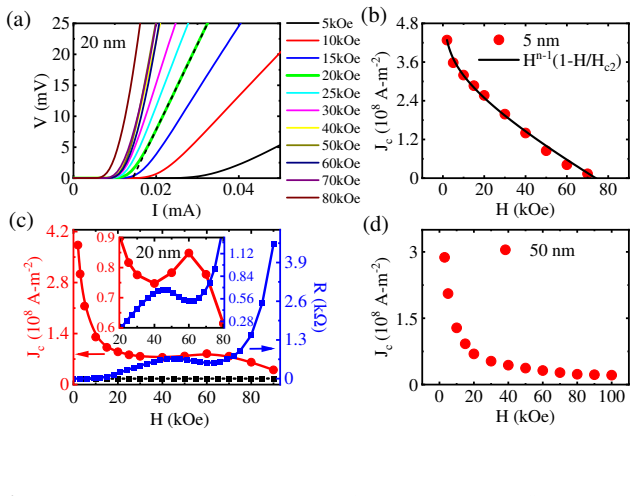
In Type II superconductors the vortex lattice can undergo inverse melting, passing from liquid to crystalline solid with increasing temperature. Using d.c. transport and low-frequency magnetic screening responses together with scanning tunneling spectroscopy, the authors construct the vortex-state phase diagram for amorphous Re6Zr thin films and show that inverse melting is thickness-dependent: a 5 nm film retains an inhomogeneous liquid state while a 50 nm film maintains a crystalline solid structure except near the upper critical field.
What carries the argument
The vortex-state phase diagram in the magnetic field-temperature plane, built from distinct signatures in d.c. transport and low-frequency magnetic screening that are cross-checked against scanning tunneling spectroscopy imaging.
If this is right
- Transport and screening measurements can locate the inverse melting line without direct imaging.
- Film thickness provides a practical control knob for the stability of the vortex solid versus liquid phases.
- The 50 nm film remains solid over most of the phase diagram except close to the upper critical field.
- The 5 nm film shows no recrystallization into a solid at any measured temperature or field.
Where Pith is reading between the lines
- Thickness tuning could be used to stabilize or suppress particular vortex phases in device geometries.
- Similar thickness dependence may appear in other amorphous thin-film superconductors where inverse melting has been reported.
- The phase boundaries identified here supply concrete targets for microscopic models of vortex pinning and dynamics.
Load-bearing premise
The signatures seen in transport and screening mark the same vortex-lattice transitions previously identified by scanning tunneling microscopy.
What would settle it
Absence of any corresponding feature in d.c. resistivity or screening response at the field and temperature values where scanning tunneling microscopy images show the liquid-to-solid transition.
Figures




read the original abstract
In Type II superconductors, the vortex lattice can exhibit "inverse melting," transitioning from a liquid to a crystalline solid as temperature increases. While recently observed via scanning tunneling microscopy in a 20 nm thick amorphous Re6Zr thin film, this work investigates the corresponding d.c. transport and low-frequency magnetic screening responses. By identifying distinct signatures of these transitions and integrating scanning tunneling spectroscopy imaging, we construct a comprehensive vortex-state phase diagram in the magnetic field-temperature parameter space. Furthermore, we demonstrate that inverse melting is thickness-dependent: a 5 nm film retains an inhomogeneous liquid state, while a 50 nm film maintains a crystalline solid structure except near the upper critical field.
Editorial analysis
A structured set of objections, weighed in public.
Referee Report
Summary. The manuscript reports d.c. transport and low-frequency AC magnetic screening measurements on amorphous Re6Zr thin films of 5 nm, 20 nm, and 50 nm thicknesses. Building on prior STM work, it identifies signatures of inverse melting (liquid-to-solid transition with increasing temperature) and constructs a vortex-state phase diagram in the H-T plane. The central claim is that inverse melting is thickness-dependent: the 5 nm film remains in an inhomogeneous liquid state while the 50 nm film maintains a crystalline solid structure except near the upper critical field.
Significance. If the transport signatures reliably track the same inverse-melting line across thicknesses, the work would provide a practical method to map vortex phases without STM and demonstrate that film thickness can be used to tune the vortex solid-liquid boundary, which is relevant for understanding dimensionality effects in vortex matter.
major comments (2)
- [Results (phase diagram construction) and Discussion] The phase assignments for the 5 nm and 50 nm films rest on the untested assumption that the same d.c. resistivity drops and AC screening features mark the liquid-solid inverse melting transition calibrated only against 20 nm STM data (prior work). No independent structural probe (STM or neutron scattering) is reported on the 5 nm or 50 nm samples to confirm that thickness-induced changes in pinning or inhomogeneity do not alter or mask the signatures. This directly undermines the thickness-dependence claim.
- [Methods and Figure captions] No explicit criteria, thresholds, or error bars are provided for identifying the phase boundaries from transport and screening data, nor are raw data or fitting procedures shown for the claimed transitions. This makes it impossible to judge whether the observed features support the stated liquid-to-solid assignments.
minor comments (2)
- [Abstract] The abstract states that STS imaging is integrated, but it is unclear whether new STS data were acquired on the 5 nm and 50 nm films or whether only the prior 20 nm data are used.
- [Experimental methods] Notation for the AC screening response (e.g., real/imaginary parts of susceptibility) should be defined consistently with standard conventions in the vortex literature.
Simulated Author's Rebuttal
We thank the referee for their careful reading of our manuscript and for the constructive comments. We address each of the major comments below.
read point-by-point responses
-
Referee: The phase assignments for the 5 nm and 50 nm films rest on the untested assumption that the same d.c. resistivity drops and AC screening features mark the liquid-solid inverse melting transition calibrated only against 20 nm STM data (prior work). No independent structural probe (STM or neutron scattering) is reported on the 5 nm or 50 nm samples to confirm that thickness-induced changes in pinning or inhomogeneity do not alter or mask the signatures. This directly undermines the thickness-dependence claim.
Authors: We agree that the phase assignments for the 5 nm and 50 nm films are extrapolated from the transport signatures calibrated on the 20 nm film with STM data. While this is an assumption, the d.c. resistivity and AC screening features are standard indicators used in vortex matter studies, and their consistency across thicknesses supports our interpretation of thickness-dependent behavior. However, to address the concern, we will revise the discussion section to explicitly note this assumption and discuss potential influences of thickness on the signatures. We do not have additional structural data on these samples. revision: partial
-
Referee: No explicit criteria, thresholds, or error bars are provided for identifying the phase boundaries from transport and screening data, nor are raw data or fitting procedures shown for the claimed transitions. This makes it impossible to judge whether the observed features support the stated liquid-to-solid assignments.
Authors: We will include explicit criteria and thresholds for the phase boundaries in the revised manuscript, along with error bars where applicable. Raw data and details of the analysis procedures will be provided in the supplementary material to allow for independent assessment of the transitions. revision: yes
- Lack of independent structural probes on the 5 nm and 50 nm films to directly confirm the phase assignments.
Circularity Check
No circularity: purely experimental phase diagram from transport, screening, and STM data
full rationale
The manuscript is an experimental study that identifies d.c. transport and AC screening signatures of vortex transitions, integrates them with scanning tunneling spectroscopy imaging, and maps a thickness-dependent phase diagram. No derivations, equations, fitted parameters renamed as predictions, or self-referential constructions appear. Prior STM observation on the 20 nm film is cited as calibration for signature identification; this is external experimental input rather than a self-citation chain that forces the result. The thickness dependence for 5 nm and 50 nm films rests on the assumption that the same signatures apply, but this is an empirical extrapolation, not a definitional or fitted reduction. The paper is self-contained against its own data sets and external benchmarks.
Axiom & Free-Parameter Ledger
Reference graph
Works this paper leans on
-
[1]
PD performed the transport measurements and analyze d the data
Acknowledgements: This work was supported by the Department of Atomic Energy, Government of India. PD performed the transport measurements and analyze d the data. PD, SS and SD performed the two-coil mutual inductance measurement and analyzed the data . RD, AJ, SD and PD performed the STS measurements and PD and RD analyzed the data. AD, JJ and VB provide...
work page 1957
-
[2]
Phys. Rev. B 62 , 11838 (2000). 15 7 J. Aragón Sánchez, R. Cortés Maldonado, N. R. Cejas Bolecek et al. Unveiling the vortex glass phase in the surface and volume of a type-II superconductor. Commun Phys 2, 143 (2019) 8 A. Yazdani, W. R. White, M. R. Hahn, M. Gabay, M. R. Beasley, and A. Kapitulnik, Observation of Kosterlitz- Thouless-type melting of the ...
work page 2000
discussion (0)
Sign in with ORCID, Apple, or X to comment. Anyone can read and Pith papers without signing in.