REVIEW 3 major objections 5 minor 134 references
This paper shows that the temperature lag between a shadow cast by a misaligned inner disk and the outer disk's thermal response is a direct measure of the cooling timescale, and that in HD 142527 this timescale is 20–90 years and limits th
Reviewed by Pith at T0; open to challenge. T0 means a machine referee read the full paper against a public rubric. the ladder, T0–T4 →
T0 review · deepseek-v4-flash
2026-08-01 17:25 UTC pith:O5UBYIGH
load-bearing objection Original method, but the cooling-time measurement sits at the resolution limit and is not beam-convolved, so the headline grain-size constraint is provisional. the 3 major comments →
Probing disk dynamics and dust evolution through shadows in protoplanetary disks: A case study of the HD 142527 disk
The pith
A machine-rendered reading of the paper's core claim, the machinery that carries it, and where it could break.
Core claim
The central discovery is that the angular offset between a shadow boundary and the resulting temperature minimum on the outer disk is a direct read-off of the thermal relaxation timescale, and that this timescale translates into a dust grain size. For HD 142527, reconstructing the three-dimensional scattering surface from near-infrared polarized scattered light places the shadow boundary, while azimuthal brightness-temperature profiles at 170 au from submillimeter continuum show a downstream minimum. Fitting an exponential cooling law gives a dimensionless cooling time of 0.1–0.4, i.e., 20–90 years. An analytic model of the cooling timescale at the dust emission height, evaluated over dust s
What carries the argument
The mechanism is a two-sided comparison. Observationally, a geometric reconstruction of the outer-disk scattering surface identifies the shadow boundaries; the azimuthal lag between those boundaries and the brightness-temperature minimum is then fit with a first-order exponential relaxation law to extract the observed cooling timescale. Theoretically, an analytic model computes the local cooling timescale as the maximum of radiative diffusion, gas–dust collisional transfer, and emission timescales, evaluated at the dust thermal emission height where the vertical optical depth equals unity. Collisional transfer dominates in the outer disk. The intersection of the observed and calculated cooli
Load-bearing premise
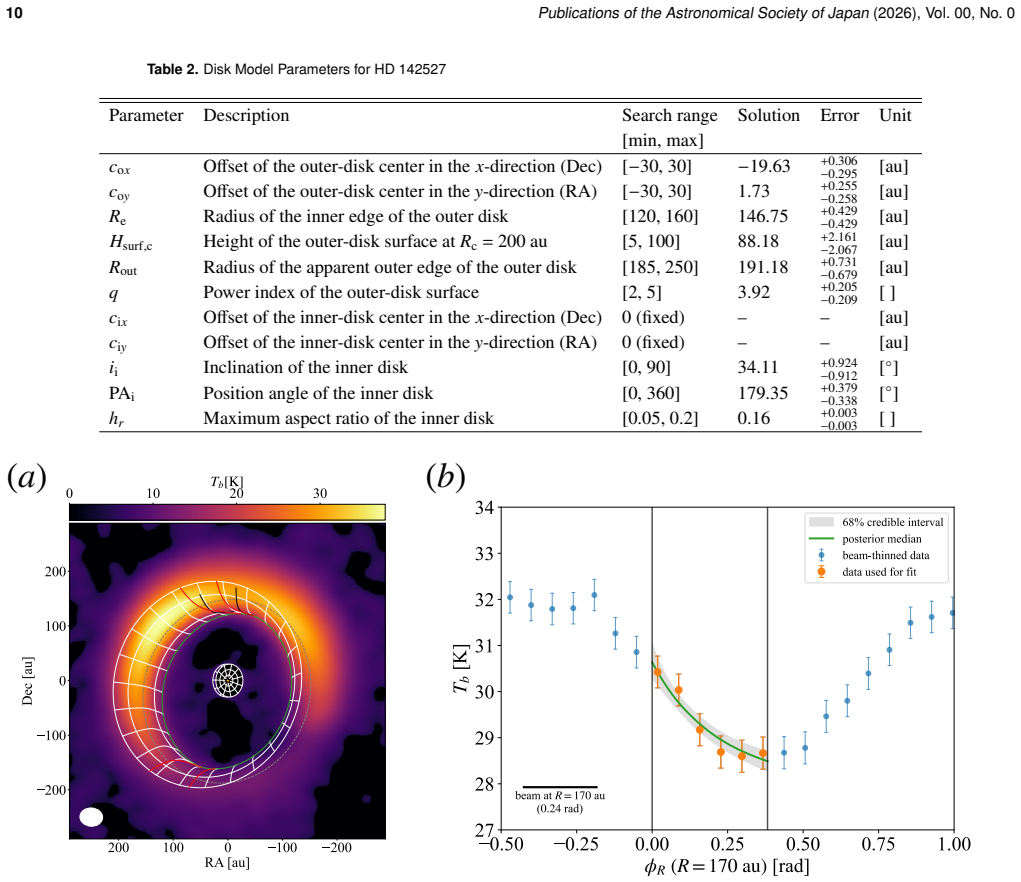
The interpretation assumes the shadow boundary is fixed and the temperature minimum's downstream offset is purely a thermal relaxation lag; if the inner-disk shadow moved between the epochs of the scattered-light and continuum observations, or if the finite synthesized beam (about 0.24 rad, comparable to the inferred 0.1–0.4 rad lag) shifts the apparent minimum, the retrieved cooling timescale is not physical.
What would settle it
Re-observed the HD 142527 shadow at two epochs separated by a few years: if the shadow boundary moves by an angular amount comparable to the inferred lag (≳0.1 rad), the stationary-shadow assumption fails. Alternatively, a hydrodynamical simulation with a moving shadow would show a temperature minimum whose lag does not follow the exponential relaxation form, falsifying the interpretation.
If this is right
- If the method is correct, shadows in transition disks provide a general, directly observable measure of local cooling timescales, needing only scattered-light geometry and continuum temperature maps.
- For HD 142527, the inferred sub-millimeter maximum grain sizes imply dust growth is limited by fragmentation or bouncing at low collision velocities (roughly 1–2.4 m/s for compact grains).
- The short cooling timescale satisfies the vertical shear instability criterion, so the vertical shear instability is a viable source of the turbulence that shapes the dust distribution and the disk surface height.
- The approach transfers to other transition disks with misaligned inner disks, allowing systematic comparisons of cooling across disks.
- The single cooling-timescale constraint leaves the maximum grain size and dust surface density degenerate; combining with multi-wavelength continuum data would break that degeneracy, as the paper notes.
Where Pith is reading between the lines
- A natural extension is to treat the shadow as a moving boundary: multi-epoch scattered-light images would reveal precession of the inner disk, and the full time-dependent thermal response could separate kinematic shadow motion from thermal relaxation, tightening the inferred cooling time.
- The inferred lag (0.1–0.4 rad) is comparable to the synthesized beam's azimuthal extent (about 0.24 rad); observations at higher angular resolution, or deconvolution of the azimuthal temperature profile, would test whether the retrieved cooling timescale is resolution-limited.
- Because the analytic cooling time is dominated by gas–dust collisional heat transfer, the same shadow-clock observable could be used as an independent probe of the dust-to-gas ratio, complementary to continuum optical depth estimates.
- Surveying transition disks of different ages with shadows could reveal whether the sub-millimeter size cap seen in HD 142527 is universal or evolves as dust coagulation, fragmentation, and bouncing balance change.
Editorial analysis
A structured set of objections, weighed in public.
Referee Report
Summary. The paper proposes a method to constrain dust grain sizes in protoplanetary disks by measuring the local cooling timescale from the azimuthal thermal relaxation of the outer disk behind an inner-disk shadow. The method is applied to HD 142527: the shadow geometry is reconstructed from a 2017 VLT/SPHERE H-band polarized image using the Orihara & Momose (2025) framework, and the azimuthal brightness-temperature profile at R=170 au from 2015 ALMA Band 9 data is fitted to a first-order exponential relaxation model (Eq. 26). The inferred dimensionless cooling timescale is t_cool,est Ω_K = 0.1–0.4 (20–90 yr). An analytic model for the cooling timescale at the ALMA Band 9 emission height is then used to map this constraint onto dust maximum grain size, yielding a_max ≈ 150–900 μm at Σ_dust = 10 g cm⁻² in the fiducial model. The paper also checks whether the vertical shear instability (VSI) can sustain the assumed vertical diffusion α_z = 2×10⁻³, finding a consistent parameter region for the fiducial and several alternative parameter choices.
Significance. If the central measurement is robust, the paper introduces a genuinely new observational probe: shadows as 'cooling clocks' in transition disks. The inferred sub-mm maximum grain size in HD 142527's outer disk and the consistency with a VSI-active layer would connect disk thermodynamics, turbulence, and dust evolution in a falsifiable way. The analytic model is transparent and the parameter study is unusually thorough (gas surface density, size distribution, porosity, opacity models, VSI condition). The observational estimate of t_cool,est is a forward-model comparison, not a fit that returns the model inputs, so the inversion is not circular in the strong sense. However, the load-bearing measurement is made at the resolution limit and without beam convolution, and the shadow is taken from an epoch two years away from the temperature map; these issues must be addressed before the claimed grain-size and VSI conclusions become convincing.
major comments (3)
- [Section 4.1.2, Eq. (26), Fig. 4(b)] The synthesized beam subtends ~0.24 rad in azimuth at R=170 au, while the inferred t_cool Ω_K = 0.1–0.4 corresponds to an e-folding lag of 0.1–0.4 rad. A physically instantaneous temperature drop at the shadow boundary, smoothed by a Gaussian beam of this size, produces an apparent exponential relaxation with a scale comparable to the beam width. The paper acknowledges that the pre-boundary decrease is 'likely affected by convolution' but does not quantify the bias. Since the model fit is performed in the image plane and the model is not convolved with the beam, the reported t_cool,est may be dominated by beam smearing rather than physical cooling. The authors should forward-model the synthesized beam (e.g., convolve the model brightness distribution, or fit in the visibility domain) and show that the inferred t_cool range survives this treatment.
- [Sections 3.1, 3.2, 4.1.2] The shadow boundary is derived from the 2017 SPHERE epoch, while the azimuthal temperature profile is from the 2015 ALMA program (project 2015.1.00614.S). The central observable is the azimuthal offset between the shadow boundary and the temperature minimum; any radial or azimuthal motion of the inner-disk shadow between 2015 and 2017 enters directly as an apparent thermal lag. Section 6.2 cites detections of moving shadows in other disks but gives no bound on the shadow angular velocity for HD 142527. The authors should either justify that the shadow is static on these timescales (e.g., from multi-epoch images or polarimetric data) or explicitly fold the unknown shadow motion into the uncertainty of t_cool,est. Without this, the measured offset cannot be unambiguously interpreted as a thermal relaxation timescale.
- [Section 4.1.2, Eq. (26), Section 6.2] The interpretation of Eq. (26) assumes a single, stationary shadow boundary, a constant target temperature behind the shadow, and first-order relaxation without azimuthal transport or dynamical feedback. The paper itself discusses in Section 6.2 that shadow-induced spirals, warps, or non-axisymmetric dust traps could reshape the temperature pattern on timescales comparable to or shorter than the cooling time. These effects are not included in the fiducial fitting model or in the uncertainty budget. At minimum, the authors should test whether the inferred t_cool is stable when the fit is restricted to a narrower azimuthal window around the shadow boundary or when the model includes a smooth transition region for the illumination profile. Without such tests, the inferred t_cool = 0.1–0.4 may reflect a combination of thermal lag and azimuthal structure rather than cooling alone.
minor comments (5)
- [Section 2.2.1 / Eq. (27)] The conversion from I_ν to T_b uses full Planck inversion; it may be worth stating explicitly that this is a brightness temperature and that the optically-thick assumption is revisited in Section 4.2.1. Currently the assumption is introduced in the calculation procedure but not prominently flagged as a modeling assumption.
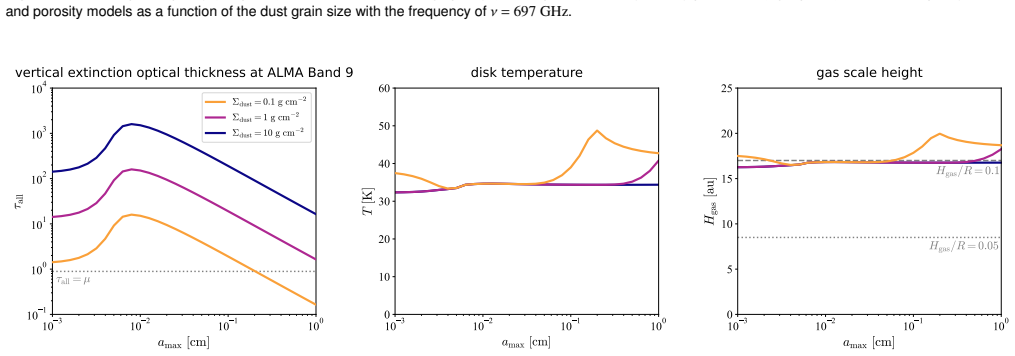
- [Section 4.2.1 / Figure 8] The abstract states 'maximum grain size consistent with the observations is approximately 0.1–1 mm', but this is the fiducial-model result at Σ_dust = 10 g cm⁻². The paper is careful to show the strong degeneracy with Σ_dust (20–200 μm at 1 g cm⁻², 20–50 μm at 0.1 g cm⁻²) and with other parameters (e.g., single-size model allows 20–30 μm). The abstract and conclusions should be reworded to emphasize the fiducial-model conditionality, or framed as 'sub-millimeter to millimeter' only after quoting the full parameter dependence.
- [Figure 4(b) / Section 4.1.2] The horizontal scale bar indicating one synthesized beam is helpful, but the figure could also mark the 68% credible interval of t_cool Ω_K directly on the axis to make the resolution-limit comparison more transparent. Also clarify why the orange fitting points exclude the data immediately at the shadow boundary.
- [Section 5.1, Eqs. (29)–(31)] The VSI criterion uses |q_temp| = 0.5, but the paper does not justify this value for HD 142527's outer disk. Since Section 5's conclusion that VSI operates depends on this choice, a brief justification or a sensitivity check for |q_temp| would strengthen the claim.
- [General / notation] The text sometimes writes t_cool Ω_K and sometimes t_coolΩ_K without a space; please normalize the notation. Also, the symbol t_cool,cal is introduced without an explicit definition in the calculation procedure (step 8); define it at first use.
Circularity Check
No significant circularity: t_cool,est and t_cool,cal are independent quantities compared as a forward model.
full rationale
The derivation chain is self-contained rather than circular. The observed cooling timescale t_cool,est is obtained by fitting Eq. (26) to the ALMA azimuthal brightness-temperature profile, with the shadow boundary fixed by a separate SPHERE scattered-light reconstruction; no parameter of the analytic dust model enters that fit. The analytic t_cool,cal is computed from dust opacities, vertical distribution, and emission height (Eqs. 1–25) and compared with t_cool,est only at the final step, so the 150–900 μm grain-size range is the output of a forward-model comparison, not an input. Self-citations (Orihara & Momose 2025 for shadow reconstruction; Fukuhara & Okuzumi 2024 and Fukuhara et al. 2025 for the cooling model and VSI criterion) are prior published methods, not uniqueness theorems, and the central grain-size constraint does not reduce to them. The concerns raised in the paper itself—beam convolution in §4.1.2, moving shadows and steady-state/dynamical effects in §6.2—are observational/systematic-error limitations, not circular reductions of the kind required to raise the circularity score.
Axiom & Free-Parameter Ledger
free parameters (10)
- Σ_gas (gas surface density) =
10 g cm^-2 (fiducial); 1 g cm^-2 (Low-Gas)
- α_z (vertical diffusion coefficient) =
2e-3 (fixed)
- p (size-distribution slope) =
-2.5 (fiducial); -3.5 (Steep)
- a_min (minimum grain size) =
1 μm (fiducial); 0.1 μm (variant)
- f_dust (filling factor) =
1.0 (fiducial); 0.3, 0.1 (Mid/Low-Fill)
- Opacity model =
Ricci (fiducial); DIANA; DSHARP
- |q_temp| (temperature gradient for VSI) =
0.5
- μ' (scattering-surface grazing angle) =
0.1
- ΔL_VSI > 2 H_gas threshold =
2 gas scale heights
- a_max and Σ_dust (constrained pair) =
a_max = 150-900 μm at Σ_dust = 10 g cm^-2 (fiducial)
axioms (7)
- domain assumption First-order thermal relaxation with a single cooling timescale and constant T_ini, T_tar (Eq. 26)
- domain assumption Band 9 emission is optically thick, so brightness temperature equals local dust temperature (Eq. 27)
- domain assumption Vertical dust distribution from settling-diffusion balance (Eqs. 10-13) in the Epstein regime
- domain assumption Cooling timescale is the maximum of diffusion, collision, and emission timescales (Eq. 24)
- ad hoc to paper VSI active where t_cool < t_crit (Eqs. 29-30) and globally when ΔL_VSI > 2 H_gas (Eq. 31)
- domain assumption The shadow-casting inner disk is static, axisymmetric, centered on the star, with h_r = 0.16
- standard math Keplerian rotation maps azimuthal angle to time (φ_R = Ω_K t)
Cite this review
Pith. "Pith review of Probing disk dynamics and dust evolution through shadows in protoplanetary disks: A case study of the HD 142527 disk." pith.science (2026). https://pith.science/paper/O5UBYIGH
@misc{pith2026260717648,
  author       = {Pith},
  title        = {Pith review of: Probing disk dynamics and dust evolution through shadows in protoplanetary disks: A case study of the HD 142527 disk},
  year         = {2026},
  howpublished = {\url{https://pith.science/paper/O5UBYIGH}},
  note         = {Machine review of arXiv:2607.17648}
}
read the original abstract
Planet formation begins with dust growth and planetesimal formation within protoplanetary disks surrounding young stars. To understand these processes, it is essential to estimate dust grain sizes from disk observations. In this study, we develop a new method to constrain grain size based on the estimation of cooling timescales. Our approach applies to transitional disks that possess an inclined inner disk casting shadows on the outer disk, whose temperature variations serve as a tracer of dust properties. By constructing a three-dimensional model of the disk surface using near-infrared scattering light images and comparing it with submillimeter dust continuum maps, we estimate the spatial offset between the irradiated and shadowed regions to derive the cooling timescale. We then build an analytic model that calculates the cooling timescale at the dust thermal emission height with an assumed turbulent diffusion intensity to infer the dust surface density and dust grain size. Applying this method to the protoplanetary disk around HD~142527, we find that the disk's northern shadowed region cools on a timescale of a few percent of the orbital period and that the maximum grain size consistent with the observations is approximately 0.1-1 mm. We also find that the conditions required for the vertical shear instability, which needs a short cooling timescale, are satisfied, allowing turbulence with an intensity consistent with near-infrared observations. This study demonstrates that estimating cooling timescales is an effective tool for constraining dust grain size. Our approach can be generally applied to other transition disks with inner-disk-induced shadows.
Figures






Reference graph
Works this paper leans on
-
[1]
2023, , 951, L16, 10.3847/2041-8213/acdb5f
Arakawa , S., Okuzumi , S., Tatsuuma , M., et al. 2023, , 951, L16, 10.3847/2041-8213/acdb5f
-
[2]
2019, , 157, 159, 10.3847/1538-3881/ab0ca1
Arun , R., Mathew , B., Manoj , P., et al. 2019, , 157, 159, 10.3847/1538-3881/ab0ca1
-
[3]
Avenhaus , H., Quanz , S. P., Schmid , H. M., et al. 2014, , 781, 87, 10.1088/0004-637X/781/2/87
-
[4]
2017, , 154, 33, 10.3847/1538-3881/aa7560
---. 2017, , 154, 33, 10.3847/1538-3881/aa7560
-
[5]
2023, in Astronomical Society of the Pacific Conference Series, Vol
Bae , J., Isella , A., Zhu , Z., et al. 2023, in Astronomical Society of the Pacific Conference Series, Vol. 534, Astronomical Society of the Pacific Conference Series, ed. S. Inutsuka , Y. Aikawa , T. Muto , K. Tomida , & M. Tamura , 423
2023
-
[6]
2021, , 912, 56, 10.3847/1538-4357/abe45e
Bae , J., Teague , R., & Zhu , Z. 2021, , 912, 56, 10.3847/1538-4357/abe45e
-
[7]
2015, , 814, 155, 10.1088/0004-637X/814/2/155
Baehr , H., & Klahr , H. 2015, , 814, 155, 10.1088/0004-637X/814/2/155
-
[8]
2021 a , , 909, 135, 10.3847/1538-4357/abddb3
Baehr , H., & Zhu , Z. 2021 a , , 909, 135, 10.3847/1538-4357/abddb3
-
[9]
2021 b , , 909, 136, 10.3847/1538-4357/abddb4
---. 2021 b , , 909, 136, 10.3847/1538-4357/abddb4
-
[10]
Barranco , J. A., Pei , S., & Marcus , P. S. 2018, , 869, 127, 10.3847/1538-4357/aaec80
-
[11]
Bate , M. R. 2018, , 475, 5618, 10.1093/mnras/sty169
-
[12]
2017, , 597, A42, 10.1051/0004-6361/201629798
Benisty , M., Stolker , T., Pohl , A., et al. 2017, , 597, A42, 10.1051/0004-6361/201629798
-
[13]
2018, , 619, A171, 10.1051/0004-6361/201833913
Benisty , M., Juh^^c3^^a1sz , A., Facchini , S., et al. 2018, , 619, A171, 10.1051/0004-6361/201833913
-
[14]
Birnstiel , T., Dullemond , C. P., & Brauer , F. 2009, , 503, L5, 10.1051/0004-6361/200912452
-
[15]
2010, , 513, A79, 10.1051/0004-6361/200913731
---. 2010, , 513, A79, 10.1051/0004-6361/200913731
-
[16]
2012, , 539, A148, 10.1051/0004-6361/201118136
Birnstiel , T., Klahr , H., & Ercolano , B. 2012, , 539, A148, 10.1051/0004-6361/201118136
-
[17]
Birnstiel , T., Ormel , C. W., & Dullemond , C. P. 2011, , 525, A11, 10.1051/0004-6361/201015228
-
[18]
Birnstiel , T., Dullemond , C. P., Zhu , Z., et al. 2018, , 869, L45, 10.3847/2041-8213/aaf743
-
[19]
J., Benisty , M., Perraut , K., et al
Bohn , A. J., Benisty , M., Perraut , K., et al. 2022, , 658, A183, 10.1051/0004-6361/202142070
-
[20]
Booth , R. A., & Clarke , C. J. 2016, , 458, 2676, 10.1093/mnras/stw488
-
[21]
1999, , 349, 619
Bouvier , J., Chelli , A., Allain , S., et al. 1999, , 349, 619
1999
-
[22]
Brauer , F., Dullemond , C. P., & Henning , T. 2008, , 480, 859, 10.1051/0004-6361:20077759
-
[23]
Burke , J. R., & Hollenbach , D. J. 1983, , 265, 223, 10.1086/160667
doi:10.1086/160667 1983
-
[24]
2015, , 582, L7, 10.1051/0004-6361/201527267
Canovas , H., M^^c3^^a9nard , F., de Boer , J., et al. 2015, , 582, L7, 10.1051/0004-6361/201527267
-
[25]
2019, , 883, 71, 10.3847/1538-4357/ab3d33
Carrasco-Gonz^^c3^^a1lez , C., Sierra , A., Flock , M., et al. 2019, , 883, 71, 10.3847/1538-4357/ab3d33
-
[26]
2022, , 134, 114501, 10.1088/1538-3873/ac9642
CASA Team , Bean , B., Bhatnagar , S., et al. 2022, , 134, 114501, 10.1088/1538-3873/ac9642
-
[27]
Casassus , S., Wright , C. M., Marino , S., et al. 2015, , 812, 126, 10.1088/0004-637X/812/2/126
-
[28]
2018, , 477, 5104, 10.1093/mnras/sty894
Casassus , S., Avenhaus , H., P^^c3^^a9rez , S., et al. 2018, , 477, 5104, 10.1093/mnras/sty894
-
[29]
Cossins , P., Lodato , G., & Clarke , C. J. 2009, , 393, 1157, 10.1111/j.1365-2966.2008.14275.x
arXiv 2009
-
[30]
Cuello , N., Montesinos , M., Stammler , S. M., Louvet , F., & Cuadra , J. 2019, , 622, A43, 10.1051/0004-6361/201731732
-
[31]
2024, , 688, A81, 10.1051/0004-6361/202450328
Delussu , L., Birnstiel , T., Miotello , A., et al. 2024, , 688, A81, 10.1051/0004-6361/202450328
-
[32]
Dominik , C., & Dullemond , C. P. 2024, , 682, A144, 10.1051/0004-6361/202347716
-
[33]
2021, OpTool: Command-line driven tool for creating complex dust opacities , Astrophysics Source Code Library, record ascl:2104.010
Dominik , C., Min , M., & Tazaki , R. 2021, OpTool: Command-line driven tool for creating complex dust opacities , Astrophysics Source Code Library, record ascl:2104.010
2021
-
[34]
Draine , B. T. 2003, , 598, 1026, 10.1086/379123
doi:10.1086/379123 2003
-
[35]
2023, in Astronomical Society of the Pacific Conference Series, Vol
Dr a ^^c5^^bckowska , J., Bitsch , B., Lambrechts , M., et al. 2023, in Astronomical Society of the Pacific Conference Series, Vol. 534, Protostars and Planets VII, ed. S. Inutsuka , Y. Aikawa , T. Muto , K. Tomida , & M. Tamura , 717, 10.48550/arXiv.2203.09759
-
[36]
1995, , 114, 237, 10.1006/icar.1995.1058
Dubrulle , B., Morfill , G., & Sterzik , M. 1995, , 114, 237, 10.1006/icar.1995.1058
arXiv 1995
-
[37]
Dullemond , C. P., & Dominik , C. 2005, , 434, 971, 10.1051/0004-6361:20042080
-
[38]
P., Ziampras , A., Ostertag , D., & Dominik , C
Dullemond , C. P., Ziampras , A., Ostertag , D., & Dominik , C. 2022, , 668, A105, 10.1051/0004-6361/202244218
-
[39]
2018, , 473, 4459, 10.1093/mnras/stx2523
Facchini , S., Juh^^c3^^a1sz , A., & Lodato , G. 2018, , 473, 4459, 10.1093/mnras/stx2523
-
[40]
Flock , M., Turner , N. J., Nelson , R. P., et al. 2020, , 897, 155, 10.3847/1538-4357/ab9641
-
[41]
Foreman-Mackey , D., Hogg , D. W., Lang , D., & Goodman , J. 2013, , 125, 306, 10.1086/670067
doi:10.1086/670067 2013
-
[42]
2020, , 892, 111, 10.3847/1538-4357/ab7b63
Francis , L., & van der Marel , N. 2020, , 892, 111, 10.3847/1538-4357/ab7b63
-
[43]
2021, , 923, 134, 10.3847/1538-4357/ac2df4
Fritscher , M., & Teiser , J. 2021, , 923, 134, 10.3847/1538-4357/ac2df4
-
[44]
2013, , 65, L14, 10.1093/pasj/65.6.L14
Fukagawa , M., Tsukagoshi , T., Momose , M., et al. 2013, , 65, L14, 10.1093/pasj/65.6.L14
-
[45]
Fukuhara , Y., Flock , M., Okuzumi , S., & Tominaga , R. T. 2025, , 701, A72, 10.1051/0004-6361/202555624
-
[46]
2024, , 76, 708, 10.1093/pasj/psae042
Fukuhara , Y., & Okuzumi , S. 2024, , 76, 708, 10.1093/pasj/psae042
-
[47]
2021, , 914, 132, 10.3847/1538-4357/abfe5c
Fukuhara , Y., Okuzumi , S., & Ono , T. 2021, , 914, 132, 10.3847/1538-4357/abfe5c
-
[48]
2023, , 75, 233, 10.1093/pasj/psac107
---. 2023, , 75, 233, 10.1093/pasj/psac107
-
[49]
2021, , 922, 13, 10.3847/1538-4357/ac1d4e
Fung , J., & Ono , T. 2021, , 922, 13, 10.3847/1538-4357/ac1d4e
-
[50]
Gaia Collaboration , Vallenari , A., Brown , A. G. A., et al. 2023, , 674, A1, 10.1051/0004-6361/202243940
-
[51]
Gammie , C. F. 2001, , 553, 174, 10.1086/320631
doi:10.1086/320631 2001
-
[52]
Goldreich , P., & Ward , W. R. 1973, , 183, 1051, 10.1086/152291
doi:10.1086/152291 1973
-
[53]
Gundlach , B., Schmidt , K. P., Kreuzig , C., et al. 2018, , 479, 1273, 10.1093/mnras/sty1550
-
[54]
Hammond , I., Christiaens , V., Price , D. J., et al. 2022, , 515, 6109, 10.1093/mnras/stac2119
-
[55]
Hashimoto , J., Dong , R., Muto , T., Liu , H. B., & Terada , Y. 2024, , 167, 75, 10.3847/1538-3881/ad1b5e
-
[56]
Hunziker , S., Schmid , H. M., Ma , J., et al. 2021, , 648, A110, 10.1051/0004-6361/202040166
-
[57]
2016, , 831, L12, 10.3847/2041-8205/831/2/L12
Kataoka , A., Tsukagoshi , T., Momose , M., et al. 2016, , 831, L12, 10.3847/2041-8205/831/2/L12
-
[58]
2013, , 225, 75, 10.1016/j.icarus.2013.02.034
Kothe , S., Blum , J., Weidling , R., & G^^c3^^bcttler , C. 2013, , 225, 75, 10.1016/j.icarus.2013.02.034
-
[59]
2016, , 54, 271, 10.1146/annurev-astro-081915-023307
Kratter , K., & Lodato , G. 2016, , 54, 271, 10.1146/annurev-astro-081915-023307
-
[60]
P., Reissl , S., & Goicovic , F
Kuffmeier , M., Dullemond , C. P., Reissl , S., & Goicovic , F. G. 2021, , 656, A161, 10.1051/0004-6361/202039614
-
[61]
Leedham , C. S., Booth , R. A., & Clarke , C. J. 2025, , 539, 2780, 10.1093/mnras/staf644
-
[62]
2015, , 450, 1503, 10.1093/mnras/stv712
Les , R., & Lin , M.-K. 2015, , 450, 1503, 10.1093/mnras/stv712
-
[63]
Lesur , G., Latter , H., & Ogilvie , G. I. 2025, , 703, A225, 10.1051/0004-6361/202555944
-
[64]
2023, in Astronomical Society of the Pacific Conference Series, Vol
Lesur , G., Flock , M., Ercolano , B., et al. 2023, in Astronomical Society of the Pacific Conference Series, Vol. 534, Protostars and Planets VII, ed. S. Inutsuka , Y. Aikawa , T. Muto , K. Tomida , & M. Tamura , 465
2023
-
[65]
Lim , J., Simon , J. B., Li , R., et al. 2026, , 1000, 156, 10.3847/1538-4357/ae47e9
-
[66]
2025, , 981, 160, 10.3847/1538-4357/adb311
---. 2025, , 981, 160, 10.3847/1538-4357/adb311
-
[67]
Lin , M.-K., & Youdin , A. N. 2015, , 811, 17, 10.1088/0004-637X/811/1/17
-
[68]
2021, , 920, L41, 10.3847/2041-8213/ac2df6
Longarini , C., Lodato , G., Toci , C., et al. 2021, , 920, L41, 10.3847/2041-8213/ac2df6
-
[69]
G., Klahr , H., Semenov , D., Henning , T., & Dullemond , C
Malygin , M. G., Klahr , H., Semenov , D., Henning , T., & Dullemond , C. P. 2017, , 605, A30, 10.1051/0004-6361/201629933
-
[70]
2021, , 508, 5402, 10.1093/mnras/stab2599
Manger , N., Pfeil , T., & Klahr , H. 2021, , 508, 5402, 10.1093/mnras/stab2599
-
[71]
2015, , 798, L44, 10.1088/2041-8205/798/2/L44
Marino , S., Perez , S., & Casassus , S. 2015, , 798, L44, 10.1088/2041-8205/798/2/L44
-
[72]
2017, , 153, 60, 10.3847/1538-3881/153/2/60
Matsakos , T., & K^^c3^^b6nigl , A. 2017, , 153, 60, 10.3847/1538-3881/153/2/60
-
[73]
2012, , 760, L26, 10.1088/2041-8205/760/2/L26
Mayama , S., Hashimoto , J., Muto , T., et al. 2012, , 760, L26, 10.1088/2041-8205/760/2/L26
-
[74]
2018, , 868, L3, 10.3847/2041-8213/aae88b
Mayama , S., Akiyama , E., Pani^^c4^^87 , O., et al. 2018, , 868, L3, 10.3847/2041-8213/aae88b
-
[75]
Mej^^c3^^ada , A. C., Durisen , R. H., Pickett , M. K., & Cai , K. 2005, , 619, 1098, 10.1086/426707
doi:10.1086/426707 2005
-
[76]
Miranda , R., & Rafikov , R. R. 2020 a , , 892, 65, 10.3847/1538-4357/ab791a
-
[77]
2020 b , , 904, 121, 10.3847/1538-4357/abbee7
---. 2020 b , , 904, 121, 10.3847/1538-4357/abbee7
-
[78]
2016, , 823, L8, 10.3847/2041-8205/823/1/L8
Montesinos , M., Perez , S., Casassus , S., et al. 2016, , 823, L8, 10.3847/2041-8205/823/1/L8
-
[79]
2026, , 171, 241, 10.3847/1538-3881/ae473d
Mullin , C., Lucas , M., Dong , R., et al. 2026, , 171, 241, 10.3847/1538-3881/ae473d
-
[80]
2019, , 873, 58, 10.3847/1538-4357/ab0428
Musiolik , G., & Wurm , G. 2019, , 873, 58, 10.3847/1538-4357/ab0428
discussion (0)
Sign in with ORCID, Apple, or X to comment. Anyone can read and Pith papers without signing in.