REVIEW 4 major objections 7 minor 37 references
MSCM-net classifies hyperspectral images by pairing multi-scale CNN local features with Mamba long-sequence modeling, beating strong baselines at lower parameter cost.
Reviewed by Pith at T0; open to challenge. T0 means a machine referee read the full paper against a public rubric. the ladder, T0–T4 →
T0 review · grok-4.5
2026-07-31 12:27 UTC pith:OJSHQLRO
load-bearing objection Coherent multi-scale-CNN + Mamba HSI classifier with real efficiency gains, but SOTA margins rest on single-run point estimates tuned on the test sets. the 4 major comments →
MSCM-net: A hyperspectral image classiffcation method based on multi-scale convolution and Mamba
The pith
A machine-rendered reading of the paper's core claim, the machinery that carries it, and where it could break.
Core claim
The authors claim that combining multi-scale CNN feature extraction (MCSE with 1×1, 3×3, and 5×5 branches plus SENet) with stacked selective state-space (Mamba) blocks, residual fusion of original features, and a center-plus-global dual-branch aggregator yields state-of-the-art hyperspectral classification accuracy on three standard benchmarks while cutting parameter count and keeping competitive FLOPs and inference time relative to CNN, Transformer, and prior Mamba baselines.
What carries the argument
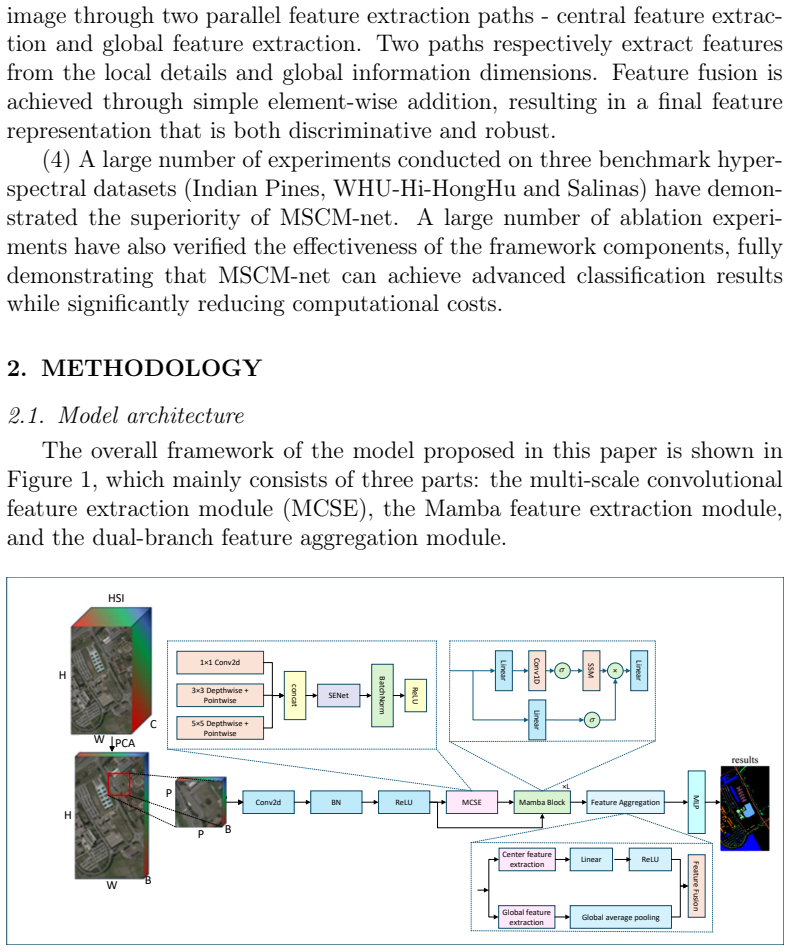
MSCM-net: PCA-patched HSI cubes go through spectral compression, an MCSE multi-scale convolution+SENet module, residual-fused serialization into stacked Mamba encoder blocks, then a dual-branch center/global feature aggregator into an MLP classifier.
Load-bearing premise
That single-run averages under a fixed 30-samples-per-class split and hyperparameters tuned on the same three test sets are enough to prove lasting superiority over strong baselines.
What would settle it
Retrain MSCM-net and the same baselines on multiple independent 30-per-class draws (or published standard splits) with several random seeds and check whether the reported OA margins (roughly 0.4–2 points) and the parameter/accuracy ranking still hold with reported means and standard deviations.
If this is right
- Multi-scale CNN local extractors plus selective state-space sequence models can replace heavier self-attention stacks for patch-based HSI classification.
- Center-pixel emphasis fused with global average pooling is a lightweight way to keep category-critical spectral cues without full attention.
- With ~0.2M parameters and sub-second-class test times on Indian Pines-scale data, the design is usable where label budgets and onboard compute are tight.
- Ablations imply four Mamba blocks, SENet channel reweighting, and the residual path before Mamba are load-bearing for the reported gains.
Where Pith is reading between the lines
- If the efficiency claim generalizes, similar multi-scale+Mamba stacks may transfer to other dense spectral cubes (e.g., medical or industrial spectroscopy) where Transformers are currently too costly.
- The dual-branch center/global head is close in spirit to query-center designs in recent HSI Transformers; testing it as a drop-in head on pure Mamba or pure CNN backbones would isolate how much of the gain is architectural versus backbone choice.
- Absence of cross-dataset hyperparameter transfer tests leaves open whether the chosen patch size 15 and four-block depth are dataset-specific or a stable default.
Editorial analysis
A structured set of objections, weighed in public.
Referee Report
Summary. The paper proposes MSCM-net for hyperspectral image classification, combining a multi-scale convolutional front-end (MCSE: parallel 1×1, 3×3 and 5×5 depthwise-separable branches followed by SENet channel reweighting) with stacked selective state-space (Mamba) blocks and a dual-branch center/global feature aggregation head. After PCA and a 3×3 spectral compression layer, patches are serialized, residual-fused with projected original features plus positional encoding, processed by L=4 Mamba blocks, then classified via element-wise sum of an enhanced center token and global average pooling. Experiments on Indian Pines, WHU-Hi-HongHu and Salinas under a fixed 30-samples-per-class protocol report best OA/AA/Kappa versus SVM, 3DCNN, SSRN, SSFTT, MASSFormer, SQSFormer and SSMamba, with the smallest parameter count (0.201M) and competitive FLOPs/test time on Indian Pines (Table 5). Ablations cover Mamba depth, SENet, residual connection and center vs global branches; a hyperparameter study covers learning rate, batch size and patch size.
Significance. If the accuracy–efficiency claims hold under proper multi-run evaluation, the work is a useful incremental contribution to HSI classification: it shows that multi-scale depthwise CNN + SENet as a local front-end, residual injection into Mamba, and a simple center/global head can match or slightly exceed recent Transformer and Mamba baselines at markedly lower parameter count. The architecture is coherent, equations for MCSE, SENet, Mamba discretization and dual-branch fusion are given, and ablations plus complexity numbers support the design choices. The contribution is primarily empirical/engineering rather than theoretical; significance rests on whether the reported ~0.4–2% OA margins are stable.
major comments (4)
- [§3.3, Tables 2–5] Tables 2–4 and Table 5 report single point estimates (OA/AA/Kappa, params, FLOPs, test time) with no standard deviations, no multi-seed means, and no repeated stratified train/test splits. OA margins over the strongest baselines are small (+1.16% vs SQSFormer on Indian Pines, +0.38% vs SSMamba on WHU-Hi-HongHu, +0.43% vs MASSFormer on Salinas). In 30-shot HSI, split/seed variance commonly reaches or exceeds these margins. Without multi-run statistics the central claim of “advanced classification performance while reducing computational complexity” is not established. Please report mean±std over ≥5–10 random seeds/splits for all methods (or at least MSCM-net and the top 2–3 baselines) on all three datasets.
- [§3.4, Figures 6–9; §4, Figure 10] §3.4 and Figures 6–9 select learning rate (1e-3), batch size (64), patch size (15) and, via Fig. 10 / §4, Mamba depth L=4 by sweeping on the same three evaluation sets used for the leaderboard. This couples model selection to the reported test metrics and inflates the risk that the ranking is overfit to these three scenes. At minimum, state the selection protocol clearly, freeze hyperparameters chosen on one dataset when evaluating the others, or use a nested/validation split; ideally add results under a fixed protocol shared with baselines.
- [§3.5, Table 5] Complexity (parameters, FLOPs, test time) is reported only for Indian Pines (Table 5). The efficiency half of the title claim should be supported on WHU-Hi-HongHu and Salinas as well (same patch/protocol), and FLOPs measurement settings (input shape, whether PCA/conv front-end is included) should be specified so comparisons to SSMamba (2.844G) and SSFTT (0.078G) are interpretable.
- [§3.3, Tables 2–4] Text in §3.3 refers to “Table 4” for Indian Pines and “Table 5”/“Table 6” for HongHu/Salinas, but the actual tables are numbered 2–4 (results) and 5 (complexity). Several per-class “best” claims and the narrative comparison to “suboptimal” methods are hard to audit under this mismatch. Correct cross-references and ensure every bold/best entry in Tables 2–4 is consistent with the stated OA/AA/Kappa ranking.
minor comments (7)
- [Title, Abstract, passim] Title and elsewhere: “classiffcation” → “classification”; abstract “methodshaveadvanced, theystill facelocalityconstraints”; numerous missing spaces after punctuation and concatenated words (e.g., “themulti-scalecon-volution”, “dependencyrelationship”). A full copy-edit pass is needed.
- [§2.1–2.3, Figure 1] Figure 1 and §2.1: patch size is stated as P=15, but MCSE/Mamba text repeatedly uses 13×13 / L=169. Clarify whether spatial size after the initial 3×3 conv (no explicit stride/padding stated) is 13 or 15, and make figure and equations consistent.
- [§2.3] Eqs. (15)–(21): D_t is described as “state dimension” while appearing as a skip term in y_t = C_t h_t + D_t x_t; standard SSM notation uses D as a feedthrough matrix. Align notation with Mamba literature and define A’s shape and whether it is input-dependent.
- [§3.1, Table 1; §3.3] Table 1 training counts: several classes use fewer than 30 samples (e.g., Grass-pasture-mowed 14, Oats 10) while the text says “training samples are set to 30.” State the exact sampling rule (min(30, n_c) or similar).
- [Figures 3–5] Classification maps (Figures 3–5) lack a ground-truth panel and color legend matching Figure 2, which weakens visual comparison. Add GT and a shared legend.
- [§1] Related work cites several 2025 Mamba-HSI methods (DBMGNet, SEDGM, MambaHSI, DBMLLA) but does not discuss how MCSE+center/global differs from their spatial-spectral dual-branch designs beyond a high-level claim. A short differentiation paragraph would help novelty assessment.
- [Highlights] Highlights still contain placeholders (“Research highlight 1” …). Replace with the actual bullet claims before publication.
Circularity Check
No derivation circularity: empirical CNN–Mamba architecture paper evaluated on external HSI benchmarks.
full rationale
MSCM-net is an engineering/architecture paper, not a first-principles derivation. The load-bearing claim is empirical superiority (OA/AA/Kappa and parameter/FLOP counts) versus named external baselines (SVM, 3DCNN, SSRN, SSFTT, MASSFormer, SQSFormer, SSMamba) on three public datasets under a fixed 30-shot protocol. Architecture pieces (multi-scale depthwise conv, SENet, stacked selective SSM/Mamba blocks, residual fusion, center/global dual-branch head) are composed from standard components and described with ordinary layer equations; none of those equations defines the reported accuracy in terms of a fitted constant that is then re-presented as a prediction. Citations are to external methods and the original Mamba/SSM literature, not to an author-owned uniqueness theorem that forces the design. Hyperparameter sweeps (lr, batch, patch, Mamba depth) on the same three sets are ordinary model selection and do not collapse the leaderboard metrics by construction. No self-definitional loop, fitted-input-as-prediction, or renaming of a known closed-form result is present. Score 0 with empty steps is the appropriate finding.
Axiom & Free-Parameter Ledger
free parameters (8)
- learning_rate =
1e-3
- batch_size =
64
- patch_size_P =
15
- Mamba_block_depth_L =
4
- post_PCA_conv_channels =
64
- Mamba_feature_dim =
128
- MCSE_branch_output_channels_N =
64 per branch (192 concat)
- train_samples_per_class =
30 (mostly)
axioms (6)
- domain assumption Selective state-space (Mamba) layers provide efficient long-range sequence modeling with hardware-efficient scan, suitable after flattening HSI patches.
- domain assumption PCA plus a learned 3×3 spectral compression to 64 bands preserves discriminative spatial-spectral information for classification.
- domain assumption The center pixel of a patch carries the most complete class label information, justifying explicit center-feature extraction.
- ad hoc to paper Depthwise-separable 3×3/5×5 multi-scale conv + SENet channel reweighting is an adequate local spatial-spectral front-end.
- ad hoc to paper Element-wise sum of enhanced center features and global average pool is sufficient fusion (no learned gate).
- domain assumption Standard supervised cross-entropy training on randomly (or fixed) sampled 30-shot splits yields comparable rankings across methods.
invented entities (3)
-
MSCM-net (full pipeline)
no independent evidence
-
MCSE module
no independent evidence
-
Dual-branch center-global feature aggregation module
no independent evidence
read the original abstract
Hyperspectral imaging is widely used in remote sensing and engineering. Therefore, research on its classification methods is crucial. While CNN and Transformer-based methods have advanced, they still face locality constraints and high computational complexity. To address these issues, we propose an innovative hyperspectral image classification model, MSCM-net. Specifically, first of all, a model architecture combining multi-scale CNN and Mamba is proposed. It consists of a multi-scale feature extraction module (MCSE) and multiple stacked Mamba blocks, which integrates the local feature extraction capability of multi-scale CNN and the long sequence modeling advantage of Mamba. Secondly, the proposed MCSE module consists of multi-scale convolution and SENet. Convolution kernels of different scales extract local information with different receptive fields, enhancing the fusion of spatial and spectral information. Meanwhile, the SENet enables the model to automatically learn the importance of each channel in the multi-scale features. Furthermore, we also propose a dual-branch feature aggregation module, which further effectively extracts and integrates the spectral information contained in the central pixel and the spatial information in the surrounding pixels. Our model has undergone numerous experiments on three widely used benchmark datasets. The experimental results show that MSCM-net can achieve advanced classification performance while reducing computational complexity.
Figures


Reference graph
Works this paper leans on
-
[1]
J. Gao, G. Chen, X. Ji, C. Shen, Reinforced graph aggrega- tion cross-domain few-shot learning for hyperspectral remote sens- ing image classification, SIGNAL PROCESSING 238 (2026). doi:10.1016/j.sigpro.2025.110101
arXiv 2026
-
[2]
J. Zhao, K. Wu, L. Zhang, W. Huang, C. Ruan, L. Huang, Patch- based hierarchical residual spectral-spatial convolutional network for hyperspectral image classification, SIGNAL PROCESSING 230 (2025). doi:10.1016/j.sigpro.2024.109850
arXiv 2025
-
[3]
X. Wang, Q. Hu, Y. Cheng, J. Ma, Hyperspectral image super- resolution meets deep learning: A survey and perspective, IEEE- CAA JOURNAL OF AUTOMATICA SINICA 10 (2023) 1668–1691. doi:10.1109/JAS.2023.123681. 26
arXiv 2023
-
[4]
X. Yang, K. Ma, D. Zhang, S. Song, X. An, Classification of soybean seeds based on rgb reconstruction of hyperspectral images, PLOS ONE 19 (2024). doi:10.1371/journal.pone.0307329
-
[5]
F. Ali, A. Razzaq, W. Tariq, A. Hameed, A. Rehman, K. Razzaq, S. Sarfraz, N. A. Rajput, H. E. M. Zaki, M. S. Shahid, G. On- drasek, Spectral intelligence: Ai-driven hyperspectral imaging for agri- cultural and ecosystem applications, AGRONOMY-BASEL 14 (2024). doi:10.3390/agronomy14102260
-
[6]
J. Wang, G. Chen, J. Ju, T. Lin, R. Wang, Z. Wang, Characteriza- tion and classification of urban weed species in northeast china using terrestrial hyperspectral images, WEED SCIENCE 71 (2023) 353–368. doi:10.1017/wsc.2023.36
-
[7]
S. Ruo-xi, F. Yi-ning, C. Wei, W. Xiang-hai, Advance in hyperspec- tral images change detection, SPECTROSCOPY AND SPECTRAL ANALYSIS 43 (2023) 2354–2362. doi:10.3964/j.issn.1000-0593(2023)08- 2354-09
-
[8]
P. Du, K. Tan, X. Xing, A novel binary tree support vector machine for hyperspectral remote sensing image classification, OPTICS COMMU- NICATIONS 285 (2012) 3054–3060. doi:10.1016/j.optcom.2012.02.092
- [9]
-
[10]
G. Liu, L. Wang, D. Liu, L. Fei, J. Yang, Hyperspectral image classifica- tionbasedonnon-parallelsupportvectormachine, REMOTESENSING 14 (2022). doi:10.3390/rs14102447
-
[11]
D.-X. Zhou, Deep distributed convolutional neural networks: Uni- versality, ANALYSIS AND APPLICATIONS 16 (2018) 895–919. doi:10.1142/S0219530518500124
- [12]
-
[13]
D. J. Atha, M. R. Jahanshahi, Evaluation of deep learning approaches based on convolutional neural networks for corrosion detection, STRUC- TURAL HEALTH MONITORING-AN INTERNATIONAL JOURNAL 17 (2018) 1110–1128. doi:10.1177/1475921717737051
-
[14]
X. Yang, Y. Ye, X. Li, R. Y. K. Lau, X. Zhang, X. Huang, Hyperspectral image classification with deep learning models, IEEE TRANSACTIONS ON GEOSCIENCE AND REMOTE SENSING 56 (2018) 5408–5423. doi:10.1109/TGRS.2018.2815613
arXiv 2018
-
[15]
A. Paul, S. Bhoumik, N. Chaki, Ssnet: an improved deep hybrid net- work for hyperspectral image classification, NEURAL COMPUTING & APPLICATIONS 33 (2021) 1575–1585. doi:10.1007/s00521-020-05069- 1
-
[16]
F.Feng, S.Wang, C.Wang, J.Zhang, Learningdeephierarchicalspatial- spectral features for hyperspectral image classification based on residual 3d-2d cnn, SENSORS 19 (2019). doi:10.3390/s19235276
-
[17]
X. Lei, F. Xie, C. Jin, Gram angle field-based siamese graph convolutional neural network for hyperspectral images classification, IEEE GEOSCIENCE AND REMOTE SENSING LETTERS 22 (2025). doi:10.1109/LGRS.2024.3521461
arXiv 2025
-
[18]
X. Hu, T. Li, T. Zhou, Y. Liu, Y. Peng, Contrastive learning based on transformer for hyperspectral image classification, APPLIED SCIENCES-BASEL 11 (2021). doi:10.3390/app11188670
-
[19]
Y. Tan, M. Li, L. Yuan, C. Shi, Y. Luo, G. Wen, Hyperspectral image classification with embedded linear vision transformer, EARTH SCI- ENCE INFORMATICS 18 (2024). doi:10.1007/s12145-024-01651-6
-
[20]
C. Fu, T. Zhou, T. Guo, Q. Zhu, F. Luo, B. Du, Cnn-transformer and channel-spatial attention based network for hyperspectral image classification with few samples, NEURAL NETWORKS 186 (2025). doi:10.1016/j.neunet.2025.107283
arXiv 2025
-
[21]
X.-y. Fan, H.-k. Li, K.-m. Liu, X.-l. Wang, Y. Yu, X.-y. Li, A multi-layer attentionconvolutionalneuralnetworkmodelforfineclassificationofhy- perspectral images in rare earth mining areas, SPECTROSCOPY AND 28 SPECTRAL ANALYSIS 45 (2025) 2666–2675. doi:10.3964/j.issn.1000- 0593(2025)09-2666-10
-
[22]
M. Schuessler, Machine learning with nonlinear state space mod- els, AT-AUTOMATISIERUNGSTECHNIK 70 (2022) 1027–1028. doi:10.1515/auto-2022-0089
-
[23]
J. Sun, K. Chen, S. Wang, Y. Zhang, Z. Xu, X. Wu, C. Tang, Dgfe- mamba: Mamba-based 2d image segmentation network, JOURNAL OF BIONICENGINEERING22(2025)2135–2150.doi:10.1007/s42235-025- 00711-x
-
[24]
doi:10.1038/s41598-025-20179-3
C.Zhang, J.Zheng, M.Cao, Amusicsourceseparationmethodintegrat- ing time-frequency decoupling and mamba-based state space modeling, SCIENTIFIC REPORTS 15 (2025). doi:10.1038/s41598-025-20179-3
-
[25]
H. Wang, P. Zhuang, X. Zhang, J. Li, Dbmgnet: A dual-branch mamba- gcn network for hyperspectral image classification, IEEE TRANS- ACTIONS ON GEOSCIENCE AND REMOTE SENSING 63 (2025). doi:10.1109/TGRS.2025.3564364
arXiv 2025
- [26]
-
[27]
Y. Li, Y. Luo, L. Zhang, Z. Wang, B. Du, Mambahsi: Spatial- spectral mamba for hyperspectral image classification, IEEE TRANS- ACTIONS ON GEOSCIENCE AND REMOTE SENSING 62 (2024). doi:10.1109/TGRS.2024.3430985
arXiv 2024
- [28]
-
[29]
F. Kong, M. Huang, J. Tang, G. Ren, End-to-end feature domain resid- ual coding network for multispectral image compression based on inter- spectral prediction, JOURNAL OF APPLIED REMOTE SENSING 18 (2024). doi:10.1117/1.JRS.18.036508. 29
-
[30]
J.-M.Wu, Multilayerpottsperceptronswithlevenberg-marquardtlearn- ing, IEEE TRANSACTIONS ON NEURAL NETWORKS 19 (2008) 2032–2043. doi:10.1109/TNN.2008.2003271
arXiv 2008
-
[31]
T. Kun, D. Pei-Jun, Hyperspectral remote sensing image clas- sification based on support vector machine, JOURNAL OF INFRARED AND MILLIMETER WAVES 27 (2008) 123–128. doi:10.3724/SP.J.1010.2008.00123
Pith/arXiv arXiv 2008
-
[32]
H. Firat, D. Hanbay, Comparison of 3d cnn based deep learning archi- tectures using hyperspectral images, JOURNAL OF THE FACULTY OF ENGINEERING AND ARCHITECTURE OF GAZI UNIVERSITY 38 (2023) 521–534. doi:10.17341/gazimmfd.977688
- [33]
-
[34]
L. Sun, G. Zhao, Y. Zheng, Z. Wu, Spectralspatial feature tokeniza- tion transformer for hyperspectral image classification, IEEE TRANS- ACTIONS ON GEOSCIENCE AND REMOTE SENSING 60 (2022). doi:10.1109/TGRS.2022.3144158
arXiv 2022
-
[35]
L. Sun, H. Zhang, Y. Zheng, Z. Wu, Z. Ye, H. Zhao, Massformer: Memory-augmented spectral-spatial transformer for hyperspectral im- age classification, IEEE TRANSACTIONS ON GEOSCIENCE AND REMOTE SENSING 62 (2024). doi:10.1109/TGRS.2024.3392264
arXiv 2024
-
[36]
N. Chen, L. Fang, Y. Xia, S. Xia, H. Liu, J. Yue, Spectral query spa- tial: Revisiting the role of center pixel in transformer for hyperspectral image classification, IEEE TRANSACTIONS ON GEOSCIENCE AND REMOTE SENSING 62 (2024). doi:10.1109/TGRS.2024.3361652
arXiv 2024
-
[37]
L. Huang, Y. Chen, X. He, Spectral-spatial mamba for hy- perspectral image classification, REMOTE SENSING 16 (2024). doi:10.3390/rs16132449. 30 Declaration of competing interest The authors declare that they have no known competing financial inter- ests or personal relationships that could have appeared to influence the work reported in this paper. Acknow...
discussion (0)
Sign in with ORCID, Apple, or X to comment. Anyone can read and Pith papers without signing in.