REVIEW 3 major objections 5 minor 34 references
One theorem makes ratio variables safe for data envelopment analysis: per-student ratios under VRS are exactly equivalent to volume ratios under CRS.
Reviewed by Pith at T0; open to challenge. T0 means a machine referee read the full paper against a public rubric. the ladder, T0–T4 →
T0 review · deepseek-v4-flash
2026-08-01 18:44 UTC pith:OKGO2IUL
load-bearing objection Theorem is correct, but the paper's own economic-effort input violates its common-denominator condition—fixable, but currently load-bearing. the 3 major comments →
On the suitability of ratio variables in data envelopment analysis: An application to education with methodological extensions
The pith
A machine-rendered reading of the paper's core claim, the machinery that carries it, and where it could break.
Core claim
Central claim: Theorem 3.1, an equivalence theorem for ratio variables. When every input and output is a ratio with a common denominator p_j (here, student count), any CRS-invariant DEA model under constant returns to scale applied to volumes x̃_ij = x_ij p_j, ỹ_rj = y_rj p_j, with p_j non-controllable, gives exactly the same efficiency scores as the same model under variable returns to scale applied to the ratios alone. The proof is a change of variables (λ_j = p_j λ̃_j / p_o) that turns the non-controllable constraint into the VRS convexity constraint. The application to 32 countries in the 2022 assessment shows that adding a translated socio-economic index as an input raises the efficien
What carries the argument
Theorem 3.1 (the equivalence theorem for ratio variables): the change of variables λ_j = p_j λ̃_j / p_o converts the non-controllable-variable constraint of a CRS model on volumes into the convexity constraint of the corresponding VRS model on ratios. It is the hinge that turns the known inconsistency of ratio data in DEA into an exact equivalence for any CRS-invariant model (radial, directional, slacks-based).
Load-bearing premise
The load-bearing premise is that every included variable—instruction time per student, economic effort, and translated ESCS—is a true ratio with the same denominator, the number of students; economic effort actually divides by GDP per capita as well, and ESCS is a translated composite index, so the applied analysis stands or falls on this premise.
What would settle it
Reconstruct the volume variables by multiplying each per-student variable by the country's actual student count (and, for the socio-economic index, recomputing the country mean from individual values) and run the CRS model with student count as non-controllable; if the efficiency scores or country rankings differ from those of the VRS ratio model for any country, the common-denominator premise fails and Theorem 3.1 does not apply to that variable.
If this is right
- Analysts can run standard VRS radial and directional DEA on per-student ratios without needing the specialized ratio-technology models previously required; the convex combinations are automatically feasible.
- The equivalence is two-way: a CRS volume problem with a non-controllable size variable can be re-expressed as a VRS ratio problem, so any tool that needs VRS (such as archetypal analysis) becomes applicable.
- Including the socio-economic index as an input meaningfully changes the efficiency map: the scores of Chile, Colombia, and Mexico rise by roughly 0.05–0.09, so fairness comparisons depend on controlling for student background.
- Directional models with data-driven orientation coefficients produce different targets than radial models, so recommended score improvements are sensitive to the chosen improvement strategy.
- Regularizing the frontier with adaptive constrained enveloping splines pulls several near-frontier countries slightly below efficiency, indicating that classical DEA's frontier may overstate their standing.
Where Pith is reading between the lines
- Editorial inference: the theorem is really a duality between 'extensive' and 'intensive' representations of a production technology; the same reweighting should transfer ratio-VRS/volume-CRS equivalence to any setting where per-capita or per-unit ratios are studied, such as public health, firm productivity, or energy intensity.
- Editorial inference: because the application's economic-effort input is expenditure per student divided by GDP per capita, its denominator is not literally the student count; if one insists on the theorem's premise, the input set should be redefined (e.g., using expenditure per student alone or including GDP per student separately) or the empirical rankings should be treated as conditional on that
- Editorial inference: a natural stress test is to vary the ESCS translation parameter across the fitted range and check whether the five efficient countries and the top ranking gains persist; robustness over the translation would make the framework actionable.
- Editorial inference: the equivalence suggests a direct falsification protocol—reconstruct true volumes for all variables and compare CRS-with-non-controllable results against VRS ratio results; disagreements locate exactly which variable violates the common-denominator assumption.
Editorial analysis
A structured set of objections, weighed in public.
Referee Report
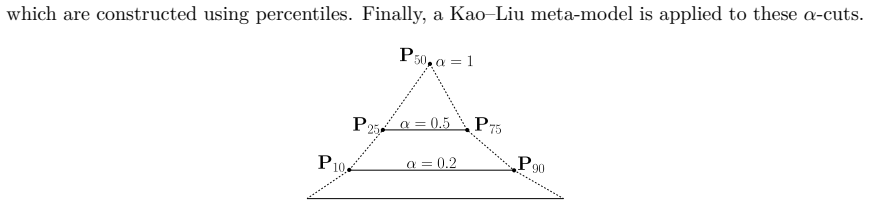
Summary. The paper develops a theoretical equivalence (Theorem 3.1) between (i) a CRS-invariant DEA model applied to volume variables together with a non-controllable denominator variable and (ii) the same model under VRS applied to ratio variables obtained by dividing all inputs and outputs by the denominator. The proof is carried out for radial/directional models using the change of variables λ_j = (p_j/p_o)λ~_j, and a sketch is given for other CRS-invariant models. The authors apply the result to justify output-oriented VRS DEA on 32 OECD countries using PISA 2022 mean scores as outputs and instruction time per student, economic effort per student, and a translated ESCS index as inputs. Further contributions include directional orientation coefficients estimated from annual PISA changes or percentile spreads, an ACES-based robustness analysis, chance-constrained and Kao–Liu fuzzy extensions, and publicly available replication code.
Significance. The equivalence in Theorem 3.1 is a clean and potentially useful formal result: it connects the long-standing ratio-variables debate to a simple CRS/VRS duality and is proved with an explicit construction. The manuscript supplies reproducible data/scripts, and the theorem is not circular in the target-efficiency sense. If the applied variables satisfy the common-denominator hypothesis, the framework offers practitioners a principled way to use VRS with per-student PISA ratios and to alternate between ratio-VRS and volume-CRS formulations. However, the empirical illustration as currently specified uses an economic-effort input that does not satisfy that hypothesis, so the application is not fully justified by the theorem; this is a load-bearing but repairable gap.
major comments (3)
- [§2.1, §2.2, §3.2] The 'economic effort' input is not a common-denominator ratio in the sense required for the VRS PPS to contain only realizable activities. With E_j total expenditure, G_j GDP, N_j population, and p_j students, e_j = (E_j/p_j)/(G_j/N_j) = E_j N_j/(p_j G_j). The convex-combination identity (2) holds algebraically for any positive values, but the quantity p_j e_j = E_j N_j/G_j does not aggregate linearly across DMUs, so the 'correct average' interpretation fails. For example, E=(100,200), p=(10,20), G=(1000,4000), N=(100,200), λ=(0.5,0.5) gives Σλ e = 0.75, while the actual economic effort of the equal-weight combined entity is 0.60 (and the tildeλ-weighted entity from (3) gives 0.67). Hence the VRS PPS built with this input contains non-realizable activities, and the paper's claim in §2.2 that the PPS 'accurately represents the set of all feasible activities' does not hold for the illustra
- [§3.2, Theorem 3.1] The theorem is stated for any CRS-invariant model, but the proof is given only for the directional program (6)–(8). The sentence after (8) asserting that the same change of variables applies to SBM and other CRS-invariant models is not a proof: one must verify that every constraint and the objective of each model transform correctly under (7), including possible slack variables. Since the abstract and conclusions advertise a 'general result', the authors should either restrict the statement to the class of envelopment models with a linear objective of the form used in (6) (which covers radial, directional, and standard SBM formulations) or supply the full general argument. This does not invalidate the radial/directional application, but it matters for the theorem's advertised scope.
- [§2.3, §5] The ESCS translation parameter τ is estimated from the same PISA data via regression, with R² ≈ 0.58 for the mean slope; the chosen value τ = 2.55 is one of several plausible values (2.45–2.70, with a 95% upper value around 3.33). Since the translated ESCS is an input in the central empirical analysis and the results in Tables A.4–A.12 depend on it, the absence of a sensitivity analysis is a substantive gap: a different τ changes the input values and can alter efficiency scores and targets. The theorem does not depend on τ, so this is not a correctness issue for the theoretical result, but it is load-bearing for the paper's methodological claim that ESCS can be incorporated as an input in this way.
minor comments (5)
- [§4, Tables A.2, A.4–A.9] Equation cross-references are inconsistent: Section 4 defines orientation coefficients in equations (16)–(18), but the tables and Section 5.1 refer to directions '(21)', '(22)', '(23)'. Please renumber or correct all citations.
- [§2.2, eq. (3)] The derivation that the tildeλ defined in (3) sum to 1 is omitted; it is a short algebraic step and should be shown explicitly, especially because the feasibility of the convex combination depends on it.
- [§5.3] The chance-constrained models classify all DMUs as stochastically efficient even at α = 0.5, a null result the authors acknowledge. Consider presenting this more tersely as a limitation or moving the detailed table to supplementary material, since it currently adds little to the empirical section.
- [§3.3, §5.2, Table 1] The final ACES configuration selected by LOOCV sets monotonicity = No and concavity = No, while Section 3.3 describes these as core constraints imposed through (10). Clarify that these shape restrictions are optional in the implemented version and discuss the economic interpretation of the resulting frontier, which is no longer guaranteed to be concave.
- [§4.1, §4.2] The minima defining m_eval are written with subscripts 'r=1,...,s; j∈eval' but without a visible double subscript; the notation should make clear that the minimum is over both outputs and DMUs in eval.
Circularity Check
No load-bearing circularity: Theorem 3.1 is a self-contained algebraic equivalence; the self-citations are auxiliary and the fitted ESCS translation is preprocessing, not a predicted efficiency.
full rationale
The central derivation is self-contained. Theorem 3.1 proves the VRS-ratio / CRS-volume equivalence by an explicit change of variables (λ_j = p_j/p_o · \tilde λ_j) that converts program (6) into program (8); the convexity condition Σλ_j = 1 is obtained algebraically from the non-controllable constraint Σ\tilde λ_j p_j = p_o. No empirical quantity is fitted to efficiency scores and then presented as a prediction. The ESCS translation parameter τ is fitted by regression, but it is an input-preprocessing constant and does not enter the objective function of the DEA programs; it is not used to derive the efficiency scores it later explains. The orientation coefficients in Section 4 are also user-chosen inputs for directional models, not outputs of the analysis. The self-citations (ACES from España et al. 2024/2025a, the Farrell-oriented-score paper Bolós et al. 2026, and the deaR/SdeaR software) support auxiliary or robustness components and are not load-bearing for Theorem 3.1. There is a real correctness caveat: the applied common-denominator assumption is questionable for the 'economic effort' input, since that variable is expenditure per student divided by GDP per capita and does not satisfy the same convex-combination interpretation as a genuine per-student average; the paper itself warns that mixed-nature ratio variables may generate PPS inconsistencies. That is an assumption-violation concern, not circularity: the theorem is still valid under its stated hypotheses, and the derivation does not reduce to its inputs by construction.
Axiom & Free-Parameter Ledger
free parameters (3)
- ESCS translation parameter tau =
2.55 (alternatives 2.70 and 3.19-3.59 at 95% confidence)
- Orientation threshold delta =
1% for Eq. (16), 5% for Eq. (18)
- ACES hyperparameters =
qmax=3/2, xi(q)=0.05/0, gamma=1, psi=0.01/0.025, LOF=MAE, monotonicity/concavity off
axioms (6)
- domain assumption Banker-Charnes-Cooper Axioms 1-3 (feasibility, free disposability, convexity) define the VRS production possibility set.
- domain assumption All inputs and outputs are ratio variables sharing a common denominator p_j (number of students).
- standard math The DEA model is CRS-invariant in the sense of Definition 3.2.
- domain assumption The number of students p_j is a non-controllable variable in the CRS volume model.
- ad hoc to paper The ESCS gradient regression identifies a meaningful zero point for the translated ESCS input.
- domain assumption Strong disposability of inputs and outputs is assumed.
read the original abstract
It is well known that the use of ratio variables is inconsistent with the fundamental assumptions of convex Data Envelopment Analysis (DEA). However, in this paper, we establish a general result demonstrating the equivalence between DEA models with ratio variables under variable returns to scale and DEA models with volume (non-ratio) variables under constant returns to scale, provided that all variables are ratio variables sharing a common denominator. This significant result enables the development of a framework for evaluating the efficiency of the Organisation for Economic Co-operation and Development (OECD) countries based on the results of the Programme for International Student Assessment (PISA) report, using mean performance scores as outputs. In this framework, we give some methodological innovations, such as the incorporation of the index of economic social and cultural status (ESCS) as an input, thereby enabling fairer comparisons with countries with a lower socio-economic level. Furthermore, we introduce different methods for estimating directions of improvement and calculating targets appropriate to the difficulty of improving each performance score. Finally, we review and introduce several novel contributions to emerging methodologies that can complement classical radial and directional models, such as efficient frontier estimation with adaptive constrained enveloping splines (ACES), stochastic chance-constrained models, and fuzzy models. All these methodologies can be used to analyse data from other PISA or similar reports, allowing non-specialists to implement DEA appropriately.
Figures


Reference graph
Works this paper leans on
-
[1]
A. Alcacer, I. Epifanio, S. Mair, and M. Mørup. A survey on archetypal analysis. arXiv preprint arXiv:2504.12392,
-
[15]
doi: 10.1007/BF02187302. W. W. Cooper, Z. Huang, V. Lelas, S. X. Li, and O. B. Olesen. Chance constrained programming formulations for stochastic characterizations of efficiency and dominance in DEA. Journal of Productivity Analysis, 9(1):53–79,
-
[16]
doi: 10.1023/A:1018320430249. W. W. Cooper, H. Deng, Z. Huang, and S. X. Li. Chance constrained programming approaches to technical efficiencies and inefficiencies in stochastic data envelopment analysis. Journal of the Operational Research Society, 53(12):1347–1356,
-
[19]
V. J. España, J. Aparicio, and X. Barber. Estimating production technologies using multi-output adaptive constrained enveloping splines. Computers & Operations Research , page 107242, 2025a. V. J. España, J. Aparicio, and X. Barber. An adaptation of random forest to estimate convex non-parametric production technologies: an empirical illustration of effici...
-
[20]
doi: 10.1016/0022-0531(78)90060-1. R. Färe, S. Grosskopf, and C. A. K. Lovell. The Measurement of Efficiency of Production . Studies in Productivity Analysis. Springer Dordrecht,
-
[25]
https://www.jstor.org/stable/2487873. T. León, V. Liern, J. Ruiz, and I. Sirvent. A fuzzy mathematical programming approach to the assessment of efficiency with DEA models. Fuzzy Sets and Systems , 139(2):407–419,
-
[28]
URL https://doi.org/10.1787/1c0d9c79-en
doi: 10.1787/1c0d9c79-en. URL https://doi.org/10.1787/1c0d9c79-en. O. B. Olesen and N. C. Petersen. Chance constrained efficiency evaluation. Management Science , 41(3):442–457,
-
[32]
doi: 10.1016/j.knosys.2013.05.014. K. Tone. A slacks-based measure of efficiency in data envelopment analysis. European Journal of Operational Research, 130(3):498–509,
-
[33]
doi: 10.1016/S0377-2217(99)00407-5. K. Tone. Data envelopment analysis as a kaizen tool: Sbm variations revisited. Bulletin of Math- ematical Sciences and Applications , 16:49–61, 8
-
[1957]
doi: 10.2307/2343100. J. H. Friedman. Multivariate adaptive regression splines. The annals of statistics , 19(1):1–67,
-
[1978]
doi: 10.1016/0377-2217(78)90138-8. A. Charnes, W. Cooper, and E. Rhodes. Short communication: Measuring the efficiency of decision making units. European Journal of Operational Research , 3(4):339,
-
[1979]
doi: 10.1016/0377-2217(79)90229-7. A. Charnes, W. W. Cooper, and E. Rhodes. Evaluating program and managerial efficiency: an application of data envelopment analysis to Program Follow Through. Management Science , 27 (6):668–697,
-
[1981]
doi: 10.1287/mnsc.27.6.668. 38 A. Charnes, W. Cooper, B. Golany, L. Seiford, and J. Stutz. Foundations of data envelopment analysis for Pareto-Koopmans efficient empirical production functions. Journal of Econometrics , 30(1-2):91–107,
-
[1984]
doi: 10.1287/mnsc.30.9.1078. V. J. Bolós, R. Benítez, and V. Coll-Serrano. Chance constrained directional models in stochastic data envelopment analysis. Operations Research Perspectives, 12:100307,
-
[1985]
doi: 10.1016/0304-4076(85)90133-2. V. Coll-Serrano, V. J. Bolós, and R. Benítez. deaR: Conventional and Fuzzy Data Envelopment Analysis,
-
[1993]
doi: 10.1287/mnsc.39.10.1261. J. Aparicio, J. L. Ruiz, and I. Sirvent. Closest targets and minimum distance to the pareto- efficient frontier in DEA. Journal of Productivity Analysis , 28(3):209–218,
-
[1995]
doi: 10.1287/mnsc.41.3.442. O. B. Olesen, N. C. Petersen, and V. V. Podinovski. Efficiency analysis with ratio measures. European Journal of Operational Research, 245(2):446–462,
-
[1996]
doi: 10.1006/jeth.1996.0096. R. G. Chambers, Y. Chung, and R. Färe. Profit, directional distance functions, and Nerlovian efficiency. Journal of Optimization Theory and Applications , 98(2):351–364,
arXiv 1996
-
[1997]
doi: 10.1023/A:1007728515733. S. Büyükkidik. Analyzing TALIS indicators and PISA results with data envelopment: Comparison of EMS, DEAP and R software. International Journal of Contemporary Educational Research , 9 (3):492–508,
-
[1998]
doi: 10.1023/A: 1022637501082. A. Charnes, W. W. Cooper, and E. Rhodes. Measuring the efficiency of decision making units. Eu- ropean Journal of Operational Research, 2(6):429–444,
-
[2000]
doi: 10.1016/S0165-0114(98)00137-7. H. Kocak and A. Çilingirtürk. Efficiency analysis of OECD public education spending. In Annual International Conference on Operations Research and Statistics , pages 83–88, 04
-
[2001]
doi: 10.1016/S0165-0114(99)00106-2. 39 C. Kao and S.-T. Liu. Fuzzy efficiency measures in data envelopment analysis. Fuzzy Sets and Systems, 113(3):427–437,
-
[2002]
doi: 10.1057/palgrave.jors.2601433. W. W. Cooper, L. M. Seiford, and K. Tone. Data Envelopment Analysis. A Comprehensive Text with Models, Applications, References and DEA-Solver Software . Springer, 2nd edition,
-
[2003]
doi: 10.1016/S0165-0114(02)00608-5. R. Moragues, J. Aparicio, and M. Esteve. Measuring technical efficiency for multi-input multi- output production processes through oneclass support vector machines: a finite-sample study. Operational Research, 23(3):47,
-
[2005]
doi: 10.3102/00346543075003417. M. Tavana, R. K. Shiraz, A. Hatami-Marbini, P. J. Agrell, and K. Paryab. Chance-constrained DEA models with random fuzzy inputs and outputs. Knowledge-Based Systems, 52:32–52,
-
[2007]
doi: 10.1007/978-0-387-45283-8
ISBN 9780387452814. doi: 10.1007/978-0-387-45283-8. G. Debreu. The coefficient of resource utilization. Econometrica, 9:273–292,
-
[2013]
doi: 10.1007/978-94-015-7721-2. M. J. Farrell. The measurement of productive efficiency. Journal of the Royal Statistical Society, Series A (General) , 120(3):253–290,
-
[2015]
doi: 10.1016/j.ejor.2015.03.013. R Core Team. R: A Language and Environment for Statistical Computing . R Foundation for Statistical Computing, Vienna, Austria,
-
[2016]
doi: 10.18052/www.scipress.com/BMSA. 16.49. D. Valero-Carreras, J. Aparicio, and N. M. Guerrero. Support vector frontiers: A new approach for estimating production functions through support vector machines. Omega, 104:102490,
-
[2022]
doi: 10.33200/ijcer.1038281. A. M. Çilingirtürk and M. Turanli. Testing the validity and structure of the data envelopment analysis PISA scores. International Journal of Advances in Management and Economics ,
-
[2023]
Education at a Glance 2023: OECD Indicators
OECD. Education at a Glance 2023: OECD Indicators . OECD Publishing, Paris, 2023a. doi: 10.1787/e13bef63-en. URL https://doi.org/10.1787/e13bef63-en. OECD. PISA 2022 Results (Volume I): The State of Learning and Equity in Education . PISA. OECD Publishing, Paris, 2023b. doi: 10.1787/53f23881-en. URL https://doi.org/10.1787/ 53f23881-en. OECD. Education at...
-
[2024]
doi: 10.1016/j. orp.2024.100307. V. J. Bolós, R. Benítez, and V. Coll-Serrano. deaR: Conventional and fuzzy DEA models with R. SoftwareX, 31:102266, 2025a. doi: 10.1016/j.softx.2025.102266. V. J. Bolós, V. Coll-Serrano, and R. Benítez. SdeaR: Stochastic Data Envelopment Analysis , 2025b. URL https://CRAN.R-project.org/package=SdeaR. R package version 1.0....
arXiv 2024
-
[2025]
doi: 10.48550/arXiv.2504.12392. P. Andersen and N. C. Petersen. A procedure for ranking efficient units in data envelopment analysis. Management Science , 39(10):1261–1264,
-
[2026]
doi: 10.1111/itor.70063. W. Briec. A graph-type extension of Farrell technical efficiency measure. Journal of Productivity Analysis, 8(1):95–110,
discussion (0)
Sign in with ORCID, Apple, or X to comment. Anyone can read and Pith papers without signing in.