REVIEW 2 major objections 5 minor 38 references
Deep Active Learning for Lung Disease Severity Classification from Chest X-rays: Learning with Less Data in the Presence of Class Imbalance
T0 review · 2 major / 5 minor · reviewed 2026-08-05 · deepseek-v4-flash
Pith's one-line read The paper claims that off-the-shelf uncertainty sampling — not specialized acquisition algorithms — can match full-data chest X-ray severity classification using 15.4% and 23.1% of labeled images.
desk verdict A plausible label-efficiency result that is not yet established, because the train/test split may not separate patients who contribute up to 30 serial CXRs each; worth a rigorous referee, not a desk reject. read the letter →
The pith
A machine-rendered reading of the paper's core claim, the machinery that carries it, and where it could break.
The reading
What carries the argument
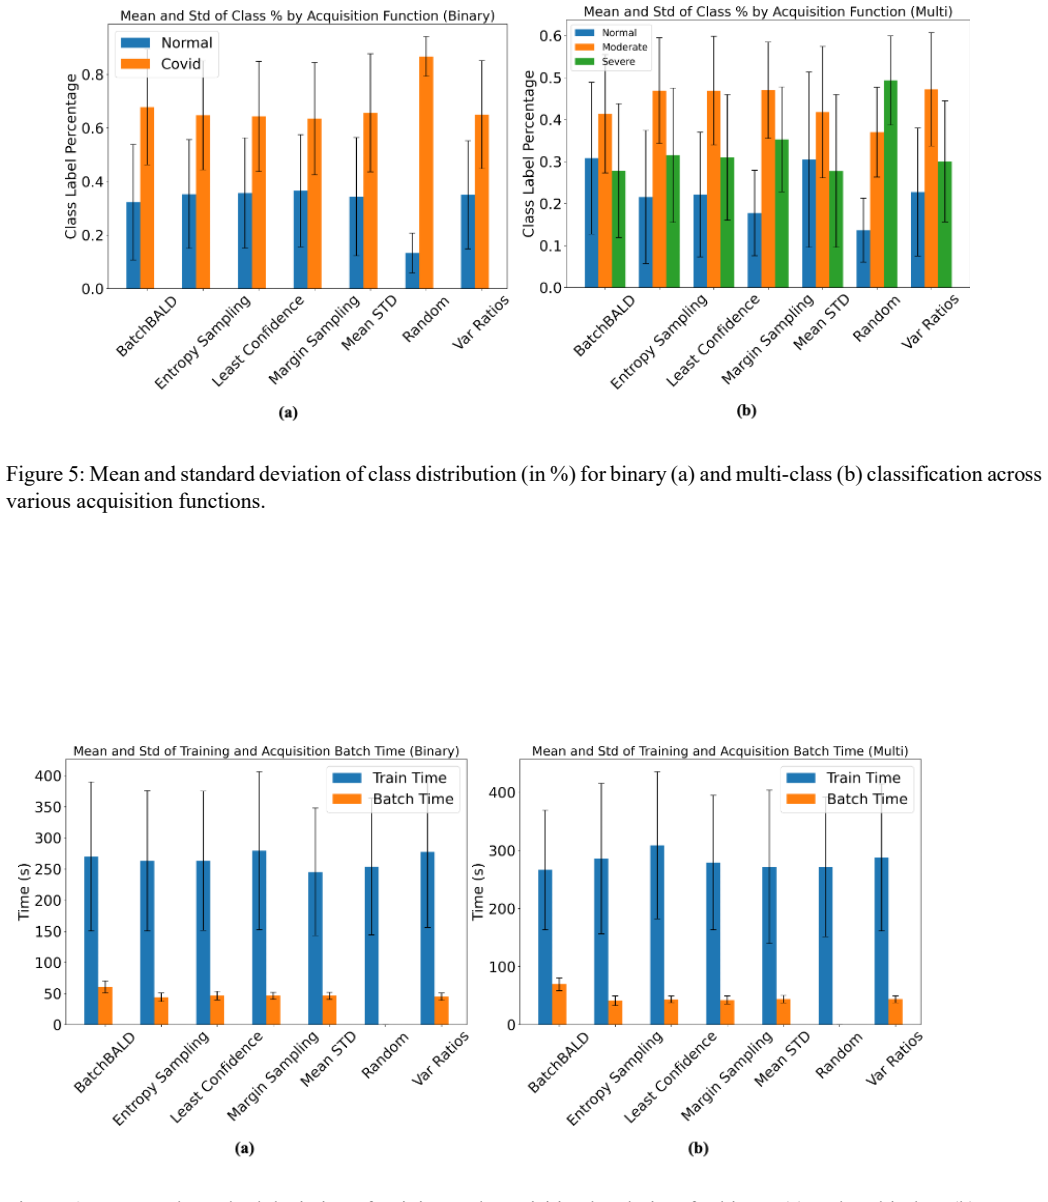
The load-bearing mechanism is the active-learning loop, not any single network. A ResNet50 with Monte Carlo Dropout estimates predictive uncertainty by averaging several stochastic forward passes; acquisition functions then score every unlabeled image. The two winners are Entropy Sampling (maximize the entropy of the averaged predictive distribution) and Mean STD (maximize the standard deviation of the MC-dropout probabilities) — both cheap to compute (~41–44 s per batch). A weighted loss with inverse class frequencies counteracts the ~14% normal / 36% moderate / 50% severe imbalance during training, and the loop stops when the model reaches the full-data baseline accuracy. The argument is c
What would settle it
Re-run the same active-learning protocol with a strict patient-level split (every image of a given patient placed in the same fold) and with a same-size randomly drawn subset for the random baseline. If the fraction of data needed to reach baseline rises materially above 15.4%/23.1%, or if the full-data baselines drop, the label-efficiency claim rests on train/test leakage or on an unfavorable random comparison.
Extended reading notes
Core claim
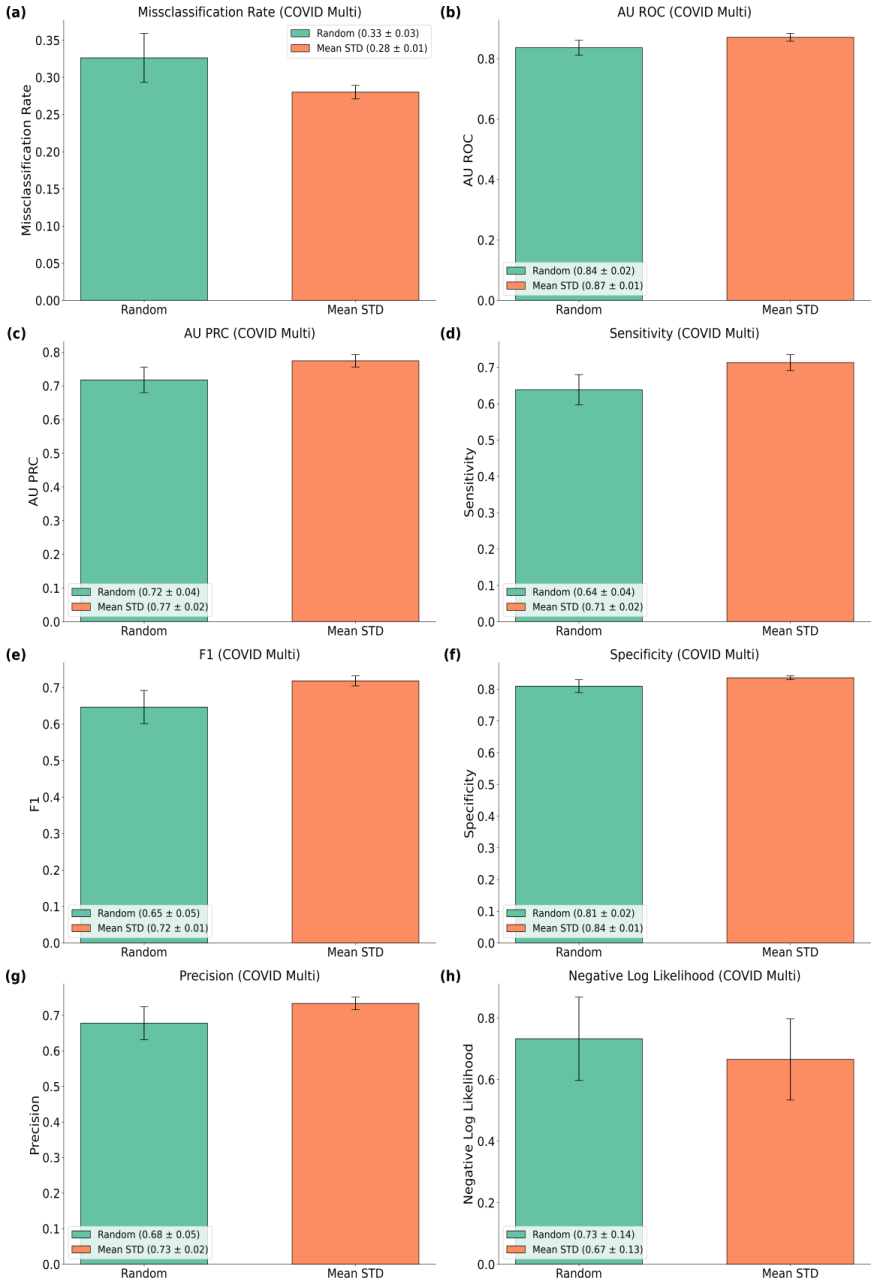
The central claim: a ResNet50 with Monte Carlo Dropout — a stand-in for a Bayesian neural network — trained under a class-weighted loss, can be driven by simple uncertainty-based acquisition functions to match or exceed the accuracy of a model trained on all labels. On chest X-rays from 963 COVID-19 patients labeled by three to six radiologists (median read as reference), Entropy Sampling reached 93.7% accuracy (AU ROC 0.91) in the binary normal-vs-diseased task using 15.4% of the training set, and hit the AU ROC baseline with just 8.0%. Mean STD reached 70.3% accuracy (AU ROC 0.86) in the three-class normal/moderate/severe task using 23.1% of the data, slightly surpassing the full-data AU R
Load-bearing premise
The paper never states that every chest X-ray of a given patient is confined to a single train/validation/test fold, even though patients contribute anywhere from 1 to 30 serial scans; if the split is by individual image rather than by patient, the same patient's scans can appear on both sides of the train–test boundary, which would inflate the reported accuracies and the label-savings percentages.
Editorial extensions
If this is right
- Label budgets for severity-grading models can shrink to roughly a sixth to a quarter of the full dataset: a radiology team could annotate about 15–23% of available CXRs and still match a fully labeled model.
- Complex acquisition functions lose: BatchBALD and Variation Ratios consistently needed more data and more compute (60–70 s per batch vs. ~41–44 s), so deployment cost and latency favor the simple samplers.
- Oversampling of the minority class is built into the winning samplers (35% normal in binary, 30% normal in multi-class vs ~14% prevalence), so active learning doubles as an imbalance remedy without explicit resampling.
- The framework transfers: nothing in the pipeline is COVID-specific, and the authors propose applying it to other imbalanced medical imaging datasets and modalities.
- Metric-specific deployment: the optimal-sampler table gives clinicians a choice — entropy sampling maximizes F1/AU ROC/sensitivity in binary tasks, mean STD maximizes precision/specificity and multi-class accuracy — so the acquisition function can be matched to the clinical priority.
Reading between the lines
- A patient-level re-run — keeping every scan of a patient in one fold — is the test this paper does not report; it would reveal how much of the 15.4%/23.1% label savings survives when serial scans cannot straddle the train–test boundary.
- The random baseline is trained on the actively selected subset rather than a same-size random draw, so the reported active-vs-random gap conflates the selection rule with the subset's composition; a true random subset would isolate the rule's contribution.
- Because the winning samplers oversample the minority class, some of the label-efficiency gain may be implicit rebalancing rather than informativeness; ablating the weighted loss while holding acquisition fixed would separate the two effects.
- The MC-dropout uncertainty used to buy labels could be reused at deployment to flag low-confidence CXRs for radiologist review, turning the acquisition machinery into a reading-worklist prioritizer — an operational consequence the paper motivates but does not develop.
Editorial analysis
A structured set of objections, weighed in public.
Referee Report
Summary. The paper proposes using deep active learning with MC-dropout uncertainty (a BNN approximation) and a weighted loss to reduce labeling effort for lung disease severity classification from chest X-rays under class imbalance. Using a ResNet50 on a COVID-19 CXR dataset (963 patients, multiple images per patient), the authors compare seven acquisition functions in binary and multi-class settings. The central claim is that Entropy Sampling reaches full-data baseline accuracy with 15.4% of the training data in binary classification and Mean STD reaches it with 23.1% in multi-class classification, while also improving AU ROC/AU PRC in some cases.
Significance. If the quantitative claims were valid, the contribution would be practically significant: it would show that simple uncertainty-based acquisition functions combined with a weighted loss can substantially reduce annotation costs in an imbalanced medical-imaging task. The paper has strengths: it evaluates seven acquisition functions, runs ten random seeds, reports IQRs, includes timing analysis, and analyzes how active sampling changes class distributions. However, the two major methodological concerns below directly affect the validity of the headline label-efficiency numbers, so the central claim is not yet established.
major comments (2)
- [§2.1, §2.3] The dataset consists of 963 patients with 1–30 CXRs per patient, but the train/validation/test split is described only as a 70/10/20 split 'stratified across class labels.' There is no statement that images from the same patient were kept within a single split. With serial CXRs, an image-level stratified split will, with high probability, place images from the same patient in both training and test sets, allowing the model to exploit patient-specific factors (anatomy, device, acquisition time) and inflating all reported metrics, including the full-data baselines. The authors must either state that a patient-exclusive split was used or re-run the experiments with such a split and report whether the 15.4%/23.1% figures and the AUROC/AUPRC comparisons change.
- [§2.4, Fig. 2, §3.1–3.2] The active-learning stopping criterion is the full-data baseline accuracy measured on the test set (93.75% and 70.25% in Online Resource Tables 1 and 2). The loop in Fig. 2 continues until 'baseline accuracy has been achieved,' and the results report the percentage of training data at which this test-based baseline is first reached. This means the test set is used to decide when to stop, so the reported label-efficiency percentages are optimistic estimates of a test-set-optimized stopping point. In addition, the 'optimal acquisition function' is selected by comparing the same test-set metrics. The authors should use a held-out validation set for stopping and for selecting acquisition functions, and report test-set performance only once at the end.
minor comments (5)
- [Abstract vs. §3, Table 1] The abstract and §2.1 report 2,319 CXRs, but §3 and Table 1 report 2,199 CXRs. Moreover, the class counts in §3 (1,157 + 836 + 326) sum to 2,319, not 2,199. This internal inconsistency needs clarification.
- [§2.2 vs. §3] §2.2 states 'There was no missing data,' but §3 reports that 120 CXRs lacked demographic information and were omitted from Table 1. Clarify whether the 120 images lack demographic metadata only and whether they are included in the imaging dataset.
- [Online Resource §2] Several acquisition-function formulas are incompletely rendered in the provided supplementary text (e.g., the entropy definition, BatchBALD mutual-information expression, and variation-ratio formula). The equations should be typeset correctly.
- [Tables 2 and 3] The dash notation is under-specified: e.g., Variation Ratios multi-class IQR entries such as '[23.11, −]' appear in Tables 2 and 3. The text explains the dash for the median but not for IQR upper bounds; clarify what '−' means in the upper-bound position.
- [§2.6, §3.3] Reported differences between acquisition functions are mostly based on medians and IQRs over ten seeds; no formal statistical comparison (e.g., paired tests or confidence intervals) is provided. Given the overlap in many IQRs, the claim that one acquisition function 'outperforms' another should be tempered or supported statistically.
Circularity Check
No significant circularity; the active-learning results are empirical measurements, not derivations that reduce to their inputs.
full rationale
This paper is an empirical benchmark, not a derivation. The acquisition functions, MC-dropout BNN approximation, and weighted loss are standard methods cited from external literature, and the label-efficiency percentages (15.4% and 23.1%) are observed stopping points measured against a full-data baseline. The stopping rule does define the accuracy milestone, but the reported quantity of interest is the fraction of training data needed to reach that milestone, which is not determined by construction and can fail (dashed entries show runs that never reached baseline). Selecting the best acquisition function on the test set and reporting the first iteration at which each metric crosses the baseline is a selection-bias limitation, not a circular reduction: the percentages could have been much larger, and some baselines were exceeded only after additional data. The self-citations [15-18] provide the dataset and prior severity-scoring context but do not embed the result as an assumption. The manuscript's internal inconsistencies (2,199 vs 2,319 CXRs; 'no missing data' vs 120 CXRs lacking demographics) are reporting errors, not evidence of circularity. Thus no step reduces by construction to its own inputs.
Assumptions & free parameters
free parameters (6)
- Learning rate =
0.001
- Initial labeled pool size per class =
25
- Acquisition batch size per iteration =
20
- MC dropout rate and number of stochastic forward passes =
not stated
- Early stopping patience =
3 iterations
- Weighted loss class weights =
inverse class proportions
assumptions (4)
- domain assumption The median of 3 to 6 radiologist labels is a valid reference standard for severity.
- domain assumption Monte Carlo Dropout with ResNet50 provides a serviceable BNN approximation for acquisition.
- ad hoc to paper The 70/10/20 split places no images of the same patient in both training and test sets.
- domain assumption The full-data model's test metrics are an appropriate baseline for the stopping criterion.
Cite this review
Pith. "Pith review of Deep Active Learning for Lung Disease Severity Classification from Chest X-rays: Learning with Less Data in the Presence of Class Imbalance." pith.science (2026). https://pith.science/paper/OUMDDLYS
@misc{pith2026250821263,
  author       = {Pith},
  title        = {Pith review of: Deep Active Learning for Lung Disease Severity Classification from Chest X-rays: Learning with Less Data in the Presence of Class Imbalance},
  year         = {2026},
  howpublished = {\url{https://pith.science/paper/OUMDDLYS}},
  note         = {Machine review of arXiv:2508.21263}
}
abstract
To reduce the amount of required labeled data for lung disease severity classification from chest X-rays (CXRs) under class imbalance, this study applied deep active learning with a Bayesian Neural Network (BNN) approximation and weighted loss function. This retrospective study collected 2,319 CXRs from 963 patients (mean age, 59.2 $\pm$ 16.6 years; 481 female) at Emory Healthcare affiliated hospitals between January and November 2020. All patients had clinically confirmed COVID-19. Each CXR was independently labeled by 3 to 6 board-certified radiologists as normal, moderate, or severe. A deep neural network with Monte Carlo Dropout was trained using active learning to classify disease severity. Various acquisition functions were used to iteratively select the most informative samples from an unlabeled pool. Performance was evaluated using accuracy, area under the receiver operating characteristic curve (AU ROC), and area under the precision-recall curve (AU PRC). Training time and acquisition time were recorded. Statistical analysis included descriptive metrics and performance comparisons across acquisition strategies. Entropy Sampling achieved 93.7% accuracy (AU ROC, 0.91) in binary classification (normal vs. diseased) using 15.4% of the training data. In the multi-class setting, Mean STD sampling achieved 70.3% accuracy (AU ROC, 0.86) using 23.1% of the labeled data. These methods outperformed more complex and computationally expensive acquisition functions and significantly reduced labeling needs. Deep active learning with BNN approximation and weighted loss effectively reduces labeled data requirements while addressing class imbalance, maintaining or exceeding diagnostic performance.
Figures


Figures from the paper (6 more)


Reference graph
Works this paper leans on
-
[1]
M. F. Alan H. Matsumoto, MD, The radiologist shortage conundrum, American College of Radiology Bulletin, published July 2, 2024. Accessed April 9, 2025. URL https://www.acr.org/clinical-resources/ publications-and-research/acr-bulletin/The-Radiologist- Shortage-Conundrum
work page 2024
-
[2]
P. Ren, Y. Xiao, X. Chang, P.-Y. Huang, Z. Li, B. B. Gupta, X. Chen, X. Wang, A survey of deep active learning (2021). arXiv:2009.00236. URL https://arxiv.org/abs/2009.00236
arXiv 2021
-
[3]
Active Learning on Medical Image
A. Biswas, M. A. A. Nasim, M. S. Ali, I. Hossain, M. A. Ullah, S. Talukder, Active learning on medical image (2023). arXiv:2306.01827. URL https://arxiv.org/abs/2306.01827
work page Pith review arXiv 2023
-
[4]
D. Onita, Active learning based on transfer learning techniques for text classification, IEEE Access 11 (2023) 28751-28761. doi:10.1109/ACCESS.2023.3260771
-
[5]
F. Buchert, N. Navab, S. Kim, Toward label-efficient neural network training: Diversity-based sampling in semi-supervised active learning, IEEE Access 11 (2023) 5193-5205, publisher Copyright: © 2013 IEEE. doi:10.1109/ACCESS.2023.3236529
- [6]
-
[7]
T. Mahmood, A. Rehman, T. Saba, L. Nadeem, S. Bahaj, Recent advancements and future prospects in active deep learning for medical image segmentation and classification, IEEE Access PP (2023) 1-1. doi:10.1109/ACCESS.2023.3313977
-
[8]
Deep Active Learning in the Presence of Label Noise: A Survey
M. Mots’oehli, K. Baek, Deep active learning in the presence of label noise: A survey (2023). arXiv:2302.11075. URL https://arxiv.org/abs/2302.11075
work page Pith review arXiv 2023
Show all 38 references
-
[9]
Y. S. Aurelio, G. M. D. Almeida, C. L. D. Castro, A. P. Braga, Learning from imbalanced data sets with weighted cross-entropy function, Neural Processing Letters 50 (2) (2019) 1937-1949. doi:10.1007/s11063-018-09977-1. URL https://doi.org/10.1007/s11063-018-09977-1 13
2019 doi
-
[10]
Nuggehalli, J
S. Nuggehalli, J. Zhang, L. Jain, R. Nowak, Direct: Deep active learning under imbalance and label noise (2024). arXiv:2312.09196. URL https://arxiv.org/abs/2312.09196
2024 arXiv
-
[11]
Varoquaux, V
G. Varoquaux, V. Cheplygina, Machine learning for medical imaging: methodological failures and recommendations for the future, npj Digital Medicine 5 (2022) 48. doi:10.1038/s41746- 02200592-y
2022 doi
-
[12]
Candemir, X
S. Candemir, X. V. Nguyen, L. R. Folio, L. M. Prevedello, Training strategies for radiology deep learning models in data-limited scenarios, Radiology: Artificial Intelligence 3 (6) (2021) e210014. arXiv:https://doi.org/10.1148/ryai.2021210014, doi:10.1148/ryai.2021210014. URL ...
2021 doi
-
[13]
X. Wu, C. Chen, M. Zhong, J. Wang, J. Shi, COVID-AL: The diagnosis of COVID-19 with deep active learning, Med. Image Anal. 68 (101913) (2021) 101913
2021
-
[14]
Nazir, R
A. Nazir, R. M. Fajri, Active learning strategy for covid-19 annotated dataset, IEEE Access 9 (2021) 161638-161648. doi:10.1109/ACCESS.2021.3130383
2021
-
[15]
Zandehshahvar, M
M. Zandehshahvar, M. van Assen, E. Kim, Y. Kiarashi, V. Keerthipati, G. Tessarin, E. Muscogiuri, A. E. Stillman, P. Filev, A. H. Davarpanah, E. A. Berkowitz, S. Tigges, S. J. Lee, B. L. Vey, C. D. Cecco, A. Adibi, Confidence-aware severity assessment of lung disease from chest...
2025 doi
-
[16]
van Assen, M
M. van Assen, M. Zandehshahvar, H. Maleki, Y. Kiarashi, T. Arleo, A. E. Stillman, P. Filev, A. H. Davarpanah, E. A. Berkowitz, S. Tigges, S. J. Lee, B. L. Vey, A. Adibi, C. N. De Cecco, Covid-19 pneumonia chest radiographic severity score: variability assessment among experien...
2022
-
[17]
Zandehshahvar, M
M. Zandehshahvar, M. van Assen, H. Maleki, Y. Kiarashi, C. N. De Cecco, A. Adibi, Toward understanding covid-19 pneumonia: A deep-learning-based approach for severity analysis and monitoring the disease, medRxiv (2020). doi:10.1101/2020.11.24.20235887. 14
2020 doi
-
[18]
Zandehshahvar, M
M. Zandehshahvar, M. van Assen, E. Kim, Y. Kiarashi, V. Keerthipati, A. Stillman, P. Filev, A. Davarpanah, E. Berkowitz, S. Tigges, S. Lee, B. Vey, C. Cecco, A. Adibi, Bayesian neural networks for severity assessment of covid-19 pneumonia from chest x-ray using a multi-reader ...
2023 doi
-
[19]
K. He, X. Zhang, S. Ren, J. Sun, Deep residual learning for image recognition (2015). arXiv:1512.03385. URL https://arxiv.org/abs/1512.03385
2015 arXiv
-
[20]
Y. Gal, Z. Ghahramani, Dropout as a bayesian approximation: Representing model uncertainty in deep learning (2016). arXiv:1506.02142. URL https://arxiv.org/abs/1506.02142
2016 arXiv
-
[21]
Srivastava, G
N. Srivastava, G. Hinton, A. Krizhevsky, I. Sutskever, R. Salakhutdinov, Dropout: A simple way to prevent neural networks from overfitting, Journal of Machine Learning Research 15 (56) (2014) 1929-1958. URL http://jmlr.org/papers/v15/srivastava14a.html
2014
-
[22]
Schohn, D
G. Schohn, D. Cohn, Less is more: Active learning with support vector machines, in: Proceedings of the Seventeenth International Conference on Machine Learning, ICML ’00, Morgan Kaufmann Publishers Inc., San Francisco, CA, USA, 2000, p. 839-846
2000
-
[23]
N. Roy, A. McCallum, Toward optimal active learning through sampling estimation of error reduction, in: International Conference on Machine Learning, 2001. URL https://api.semanticscholar.org/CorpusID:14949756
2001
-
[24]
Kirsch, J
A. Kirsch, J. van Amersfoort, Y. Gal, Batchbald: Efficient and diverse batch acquisition for deep bayesian active learning (2019). arXiv:1906.08158. URL https://arxiv.org/abs/1906.08158
2019 arXiv
-
[25]
Kendall, V
A. Kendall, V. Badrinarayanan, R. Cipolla, Bayesian segnet: Model uncertainty in deep convolutional encoder-decoder architectures for scene understanding (2016). arXiv:1511.02680. URL https://arxiv.org/abs/1511.02680
2016 arXiv
-
[26]
Culotta, A
A. Culotta, A. McCallum, Reducing labeling effort for structured prediction tasks, in: Proceedings of the 20th National Conference on Artificial Intelligence - Volume 2, AAAI’05, AAAI Press, 2005, p. 746-751. 15
2005
-
[27]
Scheffer, C
T. Scheffer, C. Decomain, S. Wrobel, Active hidden markov models for information extraction, in: F. Hoffmann, D. J. Hand, N. Adams, D. Fisher, G. Guimaraes (Eds.), Advances in Intelligent Data Analysis, Springer Berlin Heidelberg, Berlin, Heidelberg, 2001, pp. 309-318
2001
-
[28]
L. C. Freeman, Elementary applied statistics: For students in behavioral science, J. Wiley & Sons, 1968
1968
-
[29]
Jamshidi, A
M. Jamshidi, A. Lalbakhsh, J. Talla, Z. Peroutka, F. Hadjilooei, P. Lalbakhsh, M. Jamshidi, L. L. Spada, M. Mirmozafari, M. Dehghani, A. Sabet, S. Roshani, S. Roshani, N. Bayat-Makou, B. Mohamadzade, Z. Malek, A. Jamshidi, S. Kiani, H. Hashemi-Dezaki, W. Mohyuddin, Artificial ...
2020
-
[30]
Kothawade, A
S. Kothawade, A. Savarkar, V. Iyer, G. Ramakrishnan, R. Iyer, Clinical: Targeted active learning for imbalanced medical image classification, in: G. Zamzmi, S. Antani, U. Bagci, M. G. Linguraru, S. Rajaraman, Z. Xue (Eds.), Medical Image Learning with Limited and Noisy Data, S...
2022
-
[31]
J. Ker, L. Wang, J. Rao, T. Lim, Deep learning applications in medical image analysis, IEEE Access 6 (2018) 9375-9389. doi:10.1109/ACCESS.2017.2788044
2018
-
[32]
Hwang, J
S. Hwang, J. Choi, J. Choi, Uncertainty-based selective clustering for active learning, IEEE Access 10 (2022) 110983-110991. doi:10.1109/ACCESS.2022.3216065
2022
-
[33]
Mahapatra, B
D. Mahapatra, B. Bozorgtabar, J.-P. Thiran, M. Reyes, Efficient active learning for image classification and segmentation using a sample selection and conditional generative adversarial network (2019). arXiv:1806.05473. URL https://arxiv.org/abs/1806.05473
2019 arXiv
-
[34]
C. Jin, Z. Guo, Y. Lin, L. Luo, H. Chen, Label-efficient deep learning in medical image analysis: Challenges and future directions (2023). arXiv:2303.12484. URL https://arxiv.org/abs/2303.12484
2023 arXiv
-
[35]
Galbusera, A
F. Galbusera, A. Cina, Image annotation and curation in radiology: an overview for machine learning practitioners, Eur. Radiol. Exp. 8 (1) (2024) 11. 16 Tables Table 1: Statistics and patient characteristics for the CXR datasets used in the study. Characteristic Statistic Numb...
2024
-
[36]
Formally, let Dpool = {x1, x2,
Active Learning Implementation The following definitions clarify the framework and notation used in this paper: • Training Pool (Dpool): This is the set of all unlabeled data points available for potential labeling. Formally, let Dpool = {x1, x2, . . . , xm}, where xi represen...
-
[37]
Random Sampling Random Sampling selects data points uniformly at random from the unlabeled pool, Dpool
Acquisition Functions 2.1. Random Sampling Random Sampling selects data points uniformly at random from the unlabeled pool, Dpool. This method does not leverage any information from the model or data and serves as a baseline for comparing the effectiveness of more sophisticate...
-
[38]
Corresponds to Figure 5
Tables and Figures Table 1: Baseline Performance Metrics on Binary Dataset Metric Value Accuracy 0.9375 NLL 0.4527 F1 0.8539 Precision 0.9099 Recall/Sensitivity 0.8156 AU ROC 0.9108 AU PRC 0.9896 Specificity 0.8630 32 Table 2: Baseline Performance Metrics on Multi Dataset Metr...
Reviewed August 5, 2026 · model on record in the stance chip above.
Discussion (0). Sign in to comment.