REVIEW 3 major objections 5 minor 2 cited by
General Synthetic-Powered Inference
T0 review · 3 major / 5 minor · reviewed 2026-08-04 · deepseek-v4-flash
Pith's one-line read GESPI wraps any monotone risk-controlling inference method so it can use synthetic data without losing distribution-free error control.
desk verdict Correct wrapper theorem, but the 'synthetic data boost' is really the epsilon slack: GESPI is always sandwiched between the real-data runs at alpha and alpha+epsilon. read the letter →
The pith
A machine-rendered reading of the paper's core claim, the machinery that carries it, and where it could break.
The reading
What carries the argument
The load-bearing mechanism is the lattice aggregation rule. GESPI is the pointwise minimum/maximum of the base algorithm's outputs at carefully chosen levels, specifically gAlg = Alg_alpha(pooled) ∧ Alg_{alpha+epsilon}(real), with the two-sided variant gAlg = Alg_alpha(real) ∨ (Alg_alpha(pooled) ∧ Alg_{alpha+epsilon}(real)). Condition F.1—a distributive-lattice action space, a monotone bounded loss, and a base algorithm that is monotone in alpha—makes the min/max sandwich deterministic; the total-variation quantity d_{ell,Alg}(P,Q) in Theorem 3.2 measures how far the synthetic loss distribution is from the real one, and it is what the risk bound depends on.
What would settle it
Construct a valid-at-every-level randomized hypothesis test whose rejection regions are not nested across alpha (for instance, one that uses independent randomization at each alpha). Running the two-sided GESPI sandwich with this base method, the empirical Type I error can exceed alpha+epsilon even when real and synthetic data come from the same distribution; a small Monte Carlo study of this case would settle whether Theorem 3.3 extends beyond monotone lattice-valued algorithms.
Extended reading notes
Core claim
The central discovery is that an untrusted abundance of synthetic data can be converted into trustworthy sample-efficiency gains by taking the minimum of the pooled-data output and a relaxed real-data guardrail: gAlg(Dn, tilde DN) = Alg_alpha(Dn ∪ tilde DN) ∧ Alg_{alpha+epsilon}(Dn). Since the loss is bounded and monotone and the action space is a lattice, the minimum is automatically valid at level alpha+epsilon; the pooled component supplies the gain when synthetic data are good. Theorem 3.2 makes the adaptation quantitative, with excess risk bounded by min{epsilon, c times the total-variation distance between the loss distribution under (P,Q) and under (Q,Q)}. The paper further shows that
Load-bearing premise
The base method's outputs must be monotone in the error level—the action produced at alpha must be no larger than the action at alpha+epsilon—and its action space must carry the lattice operations used in the sandwich; without this, the deterministic guardrail of Theorem 3.3 can fail.
Editorial extensions
If this is right
- For any base method satisfying Condition F.1, the GESPI risk is at most alpha + epsilon for every real and every synthetic distribution, in finite samples, with no distributional assumption on the synthetic data.
- When the synthetic distribution is close to the real one, the same bound gives risk approaching alpha, reproducing the effect of running the base method on a larger real dataset.
- The two-sided construction guarantees GESPI never performs worse than the base method at level alpha, in terms of hypothesis-test power or prediction-set width.
- Because the base algorithm is treated as a black box, GESPI can be dropped onto conformal prediction, conformal risk control, one-sided tests, conformal outlier detection, and FWER-controlling multiple-testing procedures without changing them.
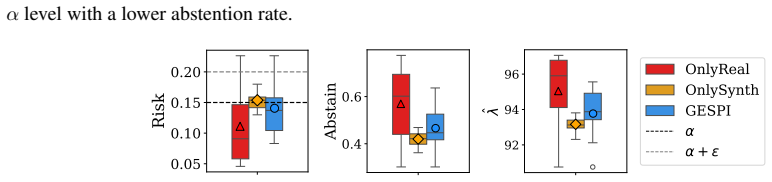
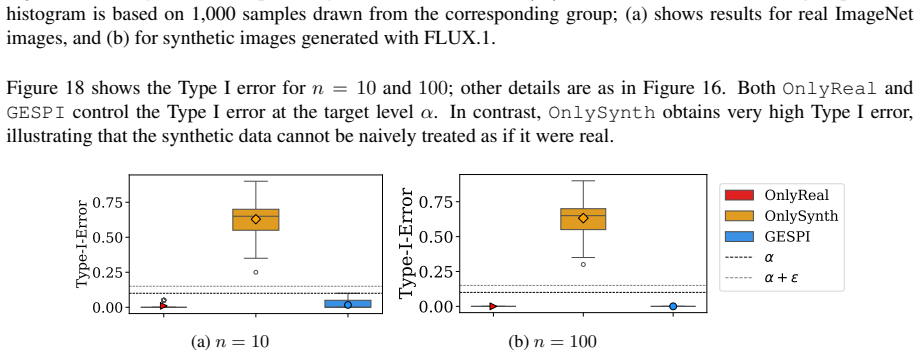
- Empirically, on protein-structure risk control and LLM win-rate comparisons, GESPI raises power or lowers abstention rates relative to using only real data while holding Type I error near the nominal level.
Reading between the lines
- A direct extension of the bound: one could choose epsilon adaptively from data (e.g., as a small fraction of alpha) without changing the form of the guarantee, though the paper does not do this.
- The total-variation term suggests a practical pre-screening test: estimate d from a labeled validation fold and use the estimate to decide whether the synthetic dataset is worth pooling; the paper leaves this diagnostic implicit.
- For one-sided testing problems, the theory suggests that synthetic data need only point in the same direction as the real alternative—not match the real distribution—so transfer from related tasks may be easier than the general 'near-identical distribution' reading of Theorem 3.2 suggests.
- The sandwich construction seems flexible enough to host any synthetic-data component, even one constructed by data-dependent selection or double dipping on the pooled data, as the paper notes; that could enable future methods that train selection rules on the synthetic pool without losing the guardrail.
Editorial analysis
A structured set of objections, weighed in public.
Referee Report
Summary. The paper proposes GESPI, a general wrapper that combines a base inference algorithm run on real data at level α, on pooled real+synthetic data at level α, and on real data at a relaxed level α+ε. The output is an order-theoretic min/max combination of these three runs. The main theoretical results (Theorem 3.2 and Theorem F.2) show, under a monotone-loss and lattice condition (Condition F.1), that the risk of the wrapper is at most α+ε for every synthetic distribution Q, and at most α+c·d(P,Q) when the synthetic loss distribution is close to the real one. Applications are given for conformal prediction, conformal risk control, hypothesis testing, outlier detection, multiple testing, and the experiments cover protein structure prediction, LLM win-rate testing, and mechanistic interpretability. The proofs are short, clearly stated, and, as far as they go, correct.
Significance. If the interpretation were fully supported, the framework would be a useful distribution-free method for safely incorporating auxiliary or synthetic data into a broad class of inference procedures. The two-sided sandwich guarantee in Theorem 3.3 is exact and elegant, and the impossibility result in Appendix E is a valuable addition. The paper also provides reproducible code and a wide range of experiments. However, the significance is substantially tempered by the fact that, as the authors' own Theorem 3.3 shows, the procedure is deterministically capped by the real-data-only method run at level α+ε. Consequently, the paper's central motivational claim that GESPI 'leverages high-quality synthetic data to boost statistical power' is not actually demonstrated and is in direct tension with the theorem. The method may be better described as a safe wrapper that spends an additional error budget ε and uses synthetic data only to veto or modulate decisions inside the guardrail envelope.
major comments (3)
- [§3.4, Theorem 3.3 and Eq. (7)] The two-sided GESPI procedure satisfies Alg_α(D_n) ⪯ gAlg(D_n, D̃_N) ⪯ Alg_{α+ε}(D_n) deterministically. In the hypothesis-testing example with the action order {0,1} and ⪯ as ≤, this means gAlg rejects only when the real-data-only test at level α+ε rejects. The same cap applies to the one-sided version in Eq. (3)/(6). Therefore P(GESPI rejects) ≤ P(Alg_{α+ε}(D_n) rejects): synthetic data cannot add a single rejection beyond the real-data guardrail. Any power advantage over OnlyReal at level α is therefore attributable to the ε relaxation, not to the synthetic sample. This is not a flaw in the proof but it contradicts the abstract's claim that GESPI 'leverages high-quality synthetic data to boost statistical power.' The authors should either reframe the central claim or, if they intend a genuine synthetic-data contribution, explain how it can appear given this deterministic cap.
- [§4.2, Figure 4 and §C.1, Figures 6–10] The empirical power comparisons report OnlyReal at level α versus GESPI at level α with ε>0, but they never include the natural control: OnlyReal run at level α+ε. Since Theorem 3.3 guarantees GESPI cannot beat that guardrail, the observed power gains in Figures 4, 6–10 and the abstention reductions in Figures 3, 12, 13 could be produced entirely by the ε relaxation on real data alone. The authors must add the α+ε real-data baseline throughout and report the difference between GESPI and that baseline. If the difference is negligible or negative, the phrase 'synthetic-powered' is misleading and the experimental claims of Section 4 should be revised accordingly.
- [Condition F.1 and abstract] The abstract states that GESPI 'wraps around any statistical inference procedure,' while Condition F.1.3 requires Alg_{α1}(z) ⪯ Alg_{α2}(z) for α1≤α2 and the action space to be a distributive lattice. Randomized tests with non-nested rejection regions, or base methods that are not monotone in the error level, are excluded. This is more than a presentation issue: the monotonicity is used in the proof of Theorem F.2 to show the distributive-law step, and without it the sandwich theorem does not hold. The 'any' claim should be qualified to 'any monotone base method on a distributive action lattice,' and the conditions should be stated in the main text rather than deferred entirely to the appendix.
minor comments (5)
- [Abstract and §1.1] The abstract and introduction repeatedly say the framework wraps 'any' inference method; this should be softened to reflect Condition F.1. Also, 'leverages high-quality synthetic data to boost statistical power' should be reworded to match what the theorems actually prove.
- [§3.1, Eq. (2)] The sentence 'If the synthetic and real data distributions are identical, the second term Ĉ_{n,N,α}(x) amounts to applying conformal prediction on a larger real dataset' is informal; when the synthetic distribution differs from P, the pooled term is not a valid level-α set for P, which is precisely why the guardrail is needed. The later formal statements are correct, but this intuition can mislead.
- [Table 3] The table labels the partial order ⪯ but does not specify the loss direction clearly. In predictive inference, a1 ⪯ a2 means a1 is a larger set, and the loss is then smaller for a1. A sentence in the caption explaining the order/loss convention would improve readability.
- [§4.1] The synthetic protein data are constructed from MSAs and AlphaFold predictions, not from an independent generative model for protein structures. The term 'synthetic data' is used in a broader sense than in the rest of the paper; this should be noted when interpreting the results.
- [Notation in Theorem 3.2] The definition d_{ℓ,Alg}(P,Q) is introduced after the theorem statement, and the dependence on α and the sample sizes is suppressed. Making this dependence explicit (e.g., d_{ℓ,Alg,α,n,N}(P,Q)) would avoid ambiguity, especially in Section F.
Circularity Check
No significant circularity: the GESPI guarantees follow from the base algorithm's own risk-control assumption and explicit monotonicity conditions, not from its conclusions.
full rationale
The derivation chain is self-contained. Equation (6) defines gAlg as the min of a pooled-data base algorithm and a real-data guardrail at level α+ε. Theorem 3.2's proof (Section I.2) uses two valid inequalities: the lattice property ℓ(a₁∧a₂) ≤ min{ℓ(a₁),ℓ(a₂)} and a total-variation comparison that reduces the (P,Q) risk to the algorithm's (Q,Q) guarantee plus c·d_ℓ,Alg(P,Q). The distance d_ℓ,Alg is defined as an algorithm-specific TV distance between loss distributions, which makes the statement 'risk improves as synthetic quality improves' close to a definition, but it is not a fitted constant and it is not presented as an empirical prediction derived from itself. Theorem 3.3's deterministic sandwich is proved from Condition F.1 without assuming the conclusion. Self-citations (SPI, robust conformal outlier detection) provide context, and the SPI extension in H.1 is proved using external results (Vovk et al. 2005) plus the present paper's own argument. The deterministic upper bound gAlg ⪯ Alg_{α+ε} means that, for testing with monotone actions, any power gain over running the base method at level α is attributable to spending the relaxed error budget ε on the real-data guardrail; that is an interpretive limitation of the abstract's power claim, but it is a property of the constructor, not a circular reduction. No fitted input is renamed as a prediction, and no load-bearing claim rests on a self-citation chain.
Assumptions & free parameters
free parameters (2)
- epsilon (additional error tolerance) =
0.05, 0.02, 0.01, 0.10 in different experiments
- B (per-residue risk upper bound) =
0.5
assumptions (6)
- domain assumption Condition F.1.1-2: action space is a distributive lattice with well-defined meet and join and distributivity
- domain assumption Condition F.1.3: Alg_{alpha1}(z) <= Alg_{alpha2}(z) for alpha1 <= alpha2
- domain assumption Condition F.1.4: loss is bounded by c and monotone in the lattice order
- domain assumption Base algorithm Alg attains (5) at alpha and alpha+epsilon for all P
- domain assumption Real and synthetic samples are i.i.d. from P and Q respectively
- standard math For Theorem H.1, score distributions from P and Q are continuous
Cite this review
Pith. "Pith review of General Synthetic-Powered Inference." pith.science (2026). https://pith.science/paper/PO2GAVG4
@misc{pith2026250920345,
  author       = {Pith},
  title        = {Pith review of: General Synthetic-Powered Inference},
  year         = {2026},
  howpublished = {\url{https://pith.science/paper/PO2GAVG4}},
  note         = {Machine review of arXiv:2509.20345}
}
read the original abstract
The rapid proliferation of high-quality synthetic data -- generated by advanced AI models or collected as auxiliary data from related tasks -- presents both opportunities and challenges for statistical inference. This paper introduces a GEneral Synthetic-Powered Inference (GESPI) framework that wraps around a broad class of statistical inference procedures to safely enhance sample efficiency by combining synthetic and real data. Our framework leverages high-quality synthetic data to boost statistical power, yet adaptively defaults to the standard method using only real data when synthetic data are of low quality. The error rate of our method remains below a user-specified bound without any distributional assumptions on the synthetic data, and decreases as the quality of the synthetic data improves. This flexibility enables seamless integration with conformal prediction, risk control, hypothesis testing, and multiple testing procedures, all without modifying the base inference method. We demonstrate the benefits of our method on challenging tasks with limited labeled data, including AlphaFold protein structure prediction, and comparing large reasoning models on complex math problems.
Figures


Figures from the paper (15 more)




Forward citations
Cited by 2 Pith papers
-
Valid Inference with Synthetic Data via Task Exchangeability
Proposes task exchangeability as a condition for valid inference when using synthetic data in scientific research, with methods and extensions demonstrated on surveys and AI evaluations.
-
AI-Assisted Variance Reduction in Randomized Experiments
Including LLM predictions as covariates in standard regression adjustment for randomized experiments reduces variance with a do-no-harm property that reverts to the unadjusted estimator when predictions are uninformative.
Reference graph
Works this paper leans on
-
[1]
A. N. Angelopoulos, S. Bates, C. Fannjiang, M. I. Jordan, and T. Zrnic. Prediction-powered inference. Science, 382 0 (6671): 0 669--674, 2023 a
2023
-
[2]
A. N. Angelopoulos, J. C. Duchi, and T. Zrnic. PPI ++: Efficient prediction-powered inference. arXiv preprint arXiv:2311.01453, 2023 b
arXiv 2023
-
[3]
A. N. Angelopoulos, S. Bates, A. Fisch, L. Lei, and T. Schuster. Conformal risk control. In The Twelfth International Conference on Learning Representations, 2024
2024
-
[4]
M. Bashari, R. M. Lotan, Y. Lee, E. Dobriban, and Y. Romano. Synthetic-powered predictive inference. arXiv preprint arXiv:2505.13432, 2025 a
arXiv 2025
-
[5]
Bashari, M
M. Bashari, M. Sesia, and Y. Romano. Robust conformal outlier detection under contaminated reference data. In Forty-second International Conference on Machine Learning, 2025 b
2025
-
[6]
Bates, A
S. Bates, A. Angelopoulos, L. Lei, J. Malik, and M. Jordan. Distribution-free, risk-controlling prediction sets. Journal of the ACM (JACM), 68 0 (6): 0 1--34, 2021
2021
-
[7]
Bates, E
S. Bates, E. Cand \`e s, L. Lei, Y. Romano, and M. Sesia. Testing for outliers with conformal p-values. The Annals of Statistics, 51 0 (1): 0 149--178, 2023
2023
-
[8]
Ben-David, T
S. Ben-David, T. Lu, and D. P \'a l. Does unlabeled data provably help? worst-case analysis of the sample complexity of semi-supervised learning. In Proceedings of the 21st Annual Conference on Learning Theory (COLT), 2008
2008
Show all 69 references
-
[9]
Benjamini and Y
Y. Benjamini and Y. Hochberg. Controlling the false discovery rate: a practical and powerful approach to multiple testing. Journal of the Royal Statistical Society, Series B, pages 289--300, 1995
1995
-
[10]
Blum and T
A. Blum and T. Mitchell. Combining labeled and unlabeled data with co-training. In Proceedings of the 11th Annual Conference on Computational Learning Theory (COLT), 1998
1998
-
[11]
Bourgon, R
R. Bourgon, R. Gentleman, and W. Huber. Independent filtering increases detection power for high-throughput experiments. Proceedings of the National Academy of Sciences, 107 0 (21): 0 9546--9551, 2010
2010
-
[12]
Boyeau, A
P. Boyeau, A. N. Angelopoulos, T. Li, N. Yosef, J. Malik, and M. I. Jordan. Autoeval done right: Using synthetic data for model evaluation. In Forty-second International Conference on Machine Learning, 2025
2025
-
[13]
Bretz, T
F. Bretz, T. Hothorn, and P. Westfall. Multiple comparisons using R. Chapman and Hall/CRC, 2016
2016
-
[14]
J. Catlett. Statlog (Shuttle) . UCI Machine Learning Repository, 1992. DOI : https://doi.org/10.24432/C5WS31
1992 doi
-
[15]
Chao and E
P. Chao and E. Dobriban. Statistical estimation under distribution shift: Wasserstein perturbations and minimax theory. arXiv preprint arXiv:2308.01853, 2023
2023
-
[16]
Chapelle, B
O. Chapelle, B. Sch \"o lkopf, and A. Zien. Semi-supervised learning. MIT Press, 2006
2006
-
[17]
Chatzi, E
I. Chatzi, E. Straitouri, S. Thejaswi, and M. Rodriguez. Prediction-powered ranking of large language models. Advances in Neural Information Processing Systems, 2024
2024
-
[18]
M. Chen, C. Gao, and Z. Ren. A general decision theory for huber’s -contamination model. Electronic Journal of Statistics, 10 0 (2): 0 3752--3774, 2016
2016
-
[19]
M. Chen, C. Gao, and Z. Ren. Robust covariance and scatter matrix estimation under huber’s contamination model. The Annals of Statistics, 46 0 (5): 0 1932--1960, 2018
1932
-
[20]
Cheng and T
D. Cheng and T. Cai. Adaptive combination of randomized and observational data. arXiv preprint arXiv:2111.15012, 2021
2021 arXiv
-
[21]
De Bartolomeis, J
P. De Bartolomeis, J. Abad, G. Wang, K. Donhauser, R. M. Duch, F. Yang, and I. J. Dahabreh. Efficient randomized experiments using foundation models. arXiv preprint arXiv:2502.04262, 2025
2025
-
[22]
Decruyenaere, H
A. Decruyenaere, H. Dehaene, P. Rabaey, C. Polet, J. Decruyenaere, S. Vansteelandt, and T. Demeester. The real deal behind the artificial appeal: Inferential utility of tabular synthetic data. In The 40th Conference on Uncertainty in Artificial Intelligence, 2023
2023
-
[23]
J. Deng, W. Dong, R. Socher, L.-J. Li, K. Li, and L. Fei-Fei. Imagenet: A large-scale hierarchical image database. In 2009 IEEE conference on computer vision and pattern recognition, pages 248--255. Ieee, 2009
2009
-
[24]
Dobriban
E. Dobriban. Statistical methods in generative AI . arXiv preprint arXiv:2509.07054, 2025
2025
-
[25]
Dobriban, K
E. Dobriban, K. Fortney, S. K. Kim, and A. B. Owen. Optimal multiple testing under a gaussian prior on the effect sizes. Biometrika, 102 0 (4): 0 753--766, 2015
2015
-
[26]
B. Efron. Large-scale inference: empirical Bayes methods for estimation, testing, and prediction. Cambridge University Press, 2012
2012
-
[27]
Fisch, J
A. Fisch, J. Maynez, R. A. Hofer, B. Dhingra, A. Globerson, and W. W. Cohen. Stratified prediction-powered inference for effective hybrid evaluation of language models. In The Thirty-eighth Annual Conference on Neural Information Processing Systems, 2024
2024
-
[28]
Gandelsman, A
Y. Gandelsman, A. A. Efros, and J. Steinhardt. Interpreting CLIP 's image representation via text-based decomposition. In The Twelfth International Conference on Learning Representations, 2024
2024
-
[29]
Gazin, G
U. Gazin, G. Blanchard, and E. Roquain. Transductive conformal inference with adaptive scores. In International Conference on Artificial Intelligence and Statistics, 2024
2024
-
[30]
M. L. Group. Credit Card Fraud Detection Data Set . https://www.kaggle.com/mlg-ulb/creditcardfraud, 2013
2013
-
[31]
F. R. Hampel, E. M. Ronchetti, P. J. Rousseeuw, and W. A. Stahel. Robust statistics. Wiley, 2005
2005
-
[32]
C. He, R. Luo, Y. Bai, S. Hu, Z. Thai, J. Shen, J. Hu, X. Han, Y. Huang, Y. Zhang, et al. Olympiadbench: A challenging benchmark for promoting AGI with olympiad-level bilingual multimodal scientific problems. In Proceedings of the 62nd Annual Meeting of the Association for Com...
2024
-
[33]
Hochberg
Y. Hochberg. A sharper bonferroni procedure for multiple tests of significance. Biometrika, 75 0 (4): 0 800--802, 1988
1988
-
[34]
P. J. Huber. Robust estimation of a location parameter . The Annals of Mathematical Statistics, 35 0 (1): 0 73 -- 101, 1964
1964
-
[35]
P. J. Huber. A robust version of the probability ratio test . The Annals of Mathematical Statistics, 36 0 (6): 0 1753 -- 1758, 1965
1965
-
[36]
P. J. Huber. Robust statistics. John Wiley & Sons, 2004
2004
-
[37]
Jumper, R
J. Jumper, R. Evans, A. Pritzel, T. Green, M. Figurnov, O. Ronneberger, K. Tunyasuvunakool, R. Bates, A. Z \' dek, A. Potapenko, et al. Highly accurate protein structure prediction with AlphaFold . nature, 596 0 (7873): 0 583--589, 2021
2021
-
[38]
Keret and A
N. Keret and A. Shojaie. GLM inference with AI -generated synthetic data using misspecified linear regression. arXiv preprint arXiv:2503.21968, 2025
2025 arXiv
-
[39]
W. M. Kouw and M. Loog. An introduction to domain adaptation and transfer learning. arXiv preprint arXiv:1812.11806, 2018
2018 arXiv
-
[40]
B. F. Labs. Flux: High-fidelity text-to-image generation with transformer diffusion models. https://huggingface.co/black-forest-labs/FLUX.1-dev, 2024. Accessed: May 2025
2024
-
[41]
Laxhammar and G
R. Laxhammar and G. Falkman. Sequential conformal anomaly detection in trajectories based on hausdorff distance. In 14th international conference on information fusion. IEEE, 2011
2011
-
[42]
Y. Lee, E. T. Tchetgen, and E. Dobriban. Batch predictive inference. arXiv preprint arXiv:2409.13990, 2024
2024 arXiv
-
[43]
Lehmann and J
E. Lehmann and J. P. Romano. Generalizations of the familywise error rate. Ann. Statist., 33 0 (1): 0 1138--1154, 2005 a
2005
-
[44]
E. L. Lehmann and J. P. Romano. Testing statistical hypotheses. Springer Science & Business Media, 2005 b
2005
-
[45]
F. T. Liu, K. M. Ting, and Z.-H. Zhou. Isolation forest. In 2008 eighth IEEE international conference on data mining . IEEE, 2008
2008
-
[46]
Liu and P.-L
Z. Liu and P.-L. Loh. Robust W-GAN-based estimation under Wasserstein contamination . Information and Inference: A Journal of the IMA, 12 0 (1): 0 312--362, 2022
2022
-
[47]
Z. R. McCaw, J. Gao, X. Lin, and J. Gronsbell. Synthetic surrogates improve power for genome-wide association studies of partially missing phenotypes in population biobanks. Nature genetics, 56 0 (7): 0 1527--1536, 2024
2024
-
[48]
Mirdita, K
M. Mirdita, K. Sch \"u tze, Y. Moriwaki, L. Heo, S. Ovchinnikov, and M. Steinegger. ColabFold : making protein folding accessible to all. Nature methods, 19 0 (6): 0 679--682, 2022
2022
-
[49]
Oosterhuis, R
H. Oosterhuis, R. Jagerman, Z. Qin, X. Wang, and M. Bendersky. Reliable confidence intervals for information retrieval evaluation using generative AI . In Proceedings of the 30th ACM SIGKDD Conference on Knowledge Discovery and Data Mining, 2024
2024
-
[50]
S. J. Pan and Q. Yang. A survey on transfer learning . IEEE Transactions on Knowledge and Data Engineering, 22 0 (10): 0 1345--1359, 2010
2010
-
[51]
Papadopoulos, K
H. Papadopoulos, K. Proedrou, V. Vovk, and A. Gammerman. Inductive confidence machines for regression. In European Conference on Machine Learning, pages 345--356. Springer, 2002
2002
-
[52]
E. F. Pettersen, T. D. Goddard, C. C. Huang, E. C. Meng, G. S. Couch, T. I. Croll, J. H. Morris, and T. E. Ferrin. UCSF ChimeraX : Structure visualization for researchers, educators, and developers. Protein science, 30 0 (1): 0 70--82, 2021
2021
-
[53]
H. Qiu, E. Tchetgen Tchetgen, and E. Dobriban. Efficient and multiply robust risk estimation under general forms of dataset shift. The Annals of Statistics, 52 0 (4): 0 1796--1824, 2024
2024
-
[54]
Radford, J
A. Radford, J. W. Kim, C. Hallacy, A. Ramesh, G. Goh, S. Agarwal, G. Sastry, A. Askell, P. Mishkin, J. Clark, et al. Learning transferable visual models from natural language supervision. In International conference on machine learning, pages 8748--8763. PmLR, 2021
2021
-
[55]
Roeder and L
K. Roeder and L. Wasserman. Genome-wide significance levels and weighted hypothesis testing. Statistical science: a review journal of the Institute of Mathematical Statistics, 24 0 (4): 0 398, 2009
2009
-
[56]
E. T. Rosenman. Methods for combining observational and experimental causal estimates: A review. Wiley Interdisciplinary Reviews: Computational Statistics, 17 0 (2): 0 e70027, 2025
2025
-
[57]
E. T. Rosenman, G. Basse, A. B. Owen, and M. Baiocchi. Combining observational and experimental datasets using shrinkage estimators. Biometrics, 79 0 (4): 0 2961--2973, 2023
2023
-
[58]
Saunders, A
C. Saunders, A. Gammerman, and V. Vovk. Transduction with confidence and credibility. In IJCAI, 1999
1999
-
[59]
Shimodaira
H. Shimodaira. Improving predictive inference under covariate shift by weighting the log-likelihood function. Journal of statistical planning and inference, 90 0 (2): 0 227--244, 2000
2000
-
[60]
Spj tvoll
E. Spj tvoll. On the optimality of some multiple comparison procedures. The Annals of Mathematical Statistics, pages 398--411, 1972
1972
-
[61]
Stolfo, W
S. Stolfo, W. Fan, W. Lee, A. Prodromidis, and P. Chan. KDD Cup 1999 Data . UCI Machine Learning Repository, 1999
1999
-
[62]
A. Storkey. When training and test sets are different: Characterizing learning transfer . In Dataset Shift in Machine Learning. MIT Press, 2013
2013
-
[63]
Sugiyama and M
M. Sugiyama and M. Kawanabe. Machine learning in non-stationary environments: introduction to covariate shift adaptation . MIT Press, 2012
2012
-
[64]
Varadi, D
M. Varadi, D. Bertoni, P. Magana, U. Paramval, I. Pidruchna, M. Radhakrishnan, M. Tsenkov, S. Nair, M. Mirdita, J. Yeo, et al. AlphaFold protein structure database in 2024: Providing structure coverage for over 214 million protein sequences. Nucleic acids research, 2024
2024
-
[65]
V. Vovk, A. Gammerman, and C. Saunders. Machine-learning applications of algorithmic randomness. In International Conference on Machine Learning, 1999
1999
-
[66]
V. Vovk, A. Gammerman, and G. Shafer. Algorithmic learning in a random world. Springer Science & Business Media, 2005
2005
-
[67]
Weiss, T
K. Weiss, T. M. Khoshgoftaar, and D. Wang. A survey of transfer learning. Journal of Big data, 3: 0 1--40, 2016
2016
-
[68]
B. Zhu, J. Jiao, and J. Steinhardt. Generalized resilience and robust statistics . The Annals of Statistics, 50 0 (4): 0 2256 -- 2283, 2022
2022
-
[69]
Zhuang, Z
F. Zhuang, Z. Qi, K. Duan, D. Xi, Y. Zhu, H. Zhu, H. Xiong, and Q. He. A comprehensive survey on transfer learning. Proceedings of the IEEE, 109 0 (1): 0 43--76, 2020
2020
Reviewed August 4, 2026 · model on record in the stance chip above.
Discussion (0). Continue with ORCID to comment.