REVIEW 4 major objections 5 minor 1 cited by
Cryptocurrencies in the Balance Sheet: Insights from (Micro)Strategy -- Bitcoin Interactions
T0 review · 4 major / 5 minor · reviewed 2026-08-07 · deepseek-v4-flash
Pith's one-line read BTC is the dominant information driver for bitcoin-holding equities.
desk verdict A useful new dataset of 39 BTC-treasury firms and a solid MSTR-specific rolling-transfer-entropy analysis, but the paper's headline claim that Bitcoin consistently dominates information flow across the whole sample is not supported by its own full-sample TE results. read the letter →
The pith
A machine-rendered reading of the paper's core claim, the machinery that carries it, and where it could break.
The reading
What carries the argument
The load-bearing instrument is one-day-lagged transfer entropy computed in 252-trading-day rolling windows with 1000 shuffles for significance, defined as the reduction in Shannon entropy of a firm's future returns when past BTC returns are added to the conditioning set. It is paired with a single-factor regression of each stock's daily log returns on BTC returns to estimate beta, same-day and lag-one Pearson correlations, and the Amihud illiquidity ratio, which together assign firms to exposure-liquidity groups and provide the vocabulary for interpreting who leads whom.
What would settle it
Compute the same transfer entropy and beta analysis using time-zone-aligned timestamps or intraday prices sampled at a common instant (for example, BTC at the exact equity close); if the dominant BTC-to-stock direction weakens or stock-to-BTC flow becomes comparable under alignment, the central asymmetry claim would be called into question.
Extended reading notes
Core claim
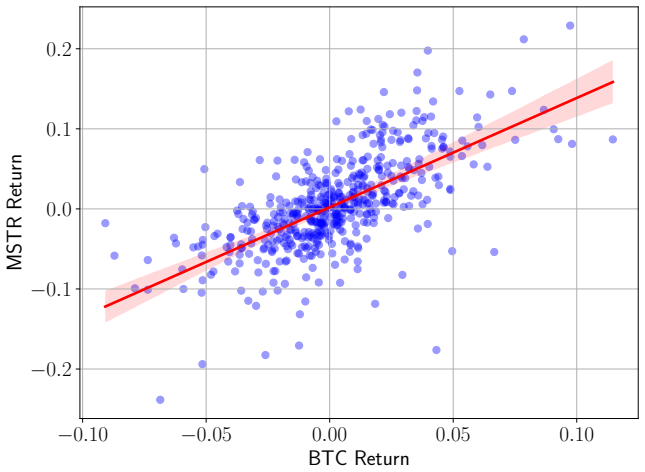
The paper's central claim is that BTC consistently acts as the dominant information driver for the sampled BTC-holding equities, with reverse information flow from stocks to BTC rare and tied to firm-specific announcements. This is established by an average one-day-lagged transfer entropy from BTC to stocks of 0.0151 bits versus 0.0144 bits in reverse, by rolling 252-day windows in which BTC-to-MSTR transfer exceeds the reverse and is significant in 31.6% of windows against 13.8%, and by a single-factor beta of 0.62 on average with MSTR at $eta = 1.37$. The authors interpret MSTR as a leveraged financial vehicle for BTC exposure rather than a price setter.
Load-bearing premise
The analysis assumes that daily closing prices retrieved for firms on different exchanges are synchronized with Bitcoin's around-the-clock trading, so that a one-day lag in transfer entropy measures genuine information flow rather than artifacts of nonsynchronous trading hours.
Editorial extensions
If this is right
- Static hedge ratios estimated over full samples will lag real exposures, because information flow between BTC and holdings stocks concentrates in bursts around market events.
- For MSTR, a 1% BTC move is associated with a 1.37% equity move, so hedges need a beta of about 1.37 and must be re-estimated as BTC's share of valuation changes.
- Equity proxies for BTC, like MSTR, transmit BTC risk but only rarely transmit firm-specific news back to BTC, so diversification strategies treating them as BTC substitutes inherit market beta plus idiosyncratic firm risk.
- Firms with large BTC holdings relative to market cap but low liquidity, such as Fold, show dampened correlations with BTC, implying price-impact effects mask underlying exposure in daily data.
Reading between the lines
- A testable extension: intraday or time-zone-aligned data should reduce the measured BTC-to-stock information lag; if the asymmetry persists under alignment, the conclusion is robust, and if it vanishes, part of the reported dominance is a settlement-time artifact.
- The results suggest the 'Bitcoin treasury' strategy is primarily a way to sell volatility and leverage, not to create alpha; firms adopting it can expect their equity to become a derivative of BTC with firm-specific noise.
- By analogy, tokens other than BTC on balance sheets (e.g., Solana purchases) should exhibit weaker equity-to-token information flow because BTC is the market-wide benchmark; this is a checkable prediction.
Editorial analysis
A structured set of objections, weighed in public.
Referee Report
Summary. The paper assembles a hand-collected dataset of 39 publicly listed firms that hold Bitcoin on their balance sheets and studies the daily return linkages between these equities and BTC over April 2023–April 2025. It reports same-day correlations (mean 0.29), single-factor BTC betas (mean 0.62, with 12 firms above 1 and MSTR at 1.37), and transfer-entropy (TE) estimates at one-day lag. The headline claim is that BTC 'consistently acts as the dominant information driver' for these equities, with reverse information flow rare and event-specific. The rolling TE analysis is performed for MSTR only, and the paper concludes that MSTR functions largely as a leveraged BTC vehicle. The authors provide code for reproduction.
Significance. If the central dominance claim were fully supported, the paper would make a useful empirical contribution to the literature on crypto–equity integration and on the risk profile of BTC-treasury firms. The dataset is a valuable resource, and the combination of correlation, beta, and TE measures is sensible. The paper also ships reproducible code and uses a standard, well-established TE estimator, which are clear strengths. However, the full-sample TE evidence does not establish that BTC is the dominant information driver for the 39-firm sample: the significance counts in Table 5 are nearly symmetric (7 against 6), the global mean TE difference is 0.0007 bits with overlapping standard deviations, and the asymmetry appears only in the MSTR rolling analysis. The single-firm result is interesting but does not support the cross-sectional generalization in the abstract. The time-zone misalignment of daily closing prices is an additional threat to the directional claim. These issues are fixable by reframing the claims or adding cross-firm evidence, so the paper merits a major revision.
major comments (4)
- [§5.1, Appendix C, Table 5] The full-sample TE results do not support the statement that 'BTC consistently acts as the dominant information driver' for the 39 sampled equities. At the paper's own significance thresholds (*: 0.05<p<0.1, **: p≤0.05), Table 5 lists 7 firms with significant TE(BTC→X) (MSTR, CLSK, LMFA, SATO.V, RUM, 0434.HK, GNS) and 6 firms with significant TE(X→BTC) (HIVE, CLSK, CAN, CIFR, 0434.HK, AKER.OL). The global means differ by 0.0007 bits (0.0151 vs 0.0144) with cross-sectional standard deviations of 0.0066 and 0.0060, so the means are well within one standard deviation of each other. Because the empirical p-values from Eq. (5) are computed over 78 tests without any multiple-comparison correction, the expected number of false positives at the 10% level is about 7.8, which is close to the observed counts. This evidence is consistent with near-symmetric or null information flow in the full sample, not with BTC dominance. Please either restrict the dominance claim to MSTR or provide cross-firm evidence that survives multiple-testing correction.
- [§5.3, Figure 7] The rolling TE analysis, which shows a clear asymmetry (410 significant windows for BTC→MSTR vs 179 for MSTR→BTC), is computed for MSTR alone. The abstract and introduction extrapolate this single-firm result to the whole sample ('Transfer entropy analysis consistently identifies BTC as the dominant information driver'). The paper does not aggregate rolling TE over the 39 firms, and Table 5 shows that the full-sample asymmetry is not present at the aggregate level. Please either remove the cross-firm generalization or add a cross-sectional rolling analysis (e.g., mean TE difference and significant-window counts for all 39 firms) to support it.
- [§3, §5.1] The dataset uses daily closing prices from yfinance for firms trading on different exchanges and in different time zones (e.g., 0434.HK in Hong Kong, 3350.T in Tokyo, AKER.OL in Oslo, ISP.MI in Milan) along with BTC's 24/7 price. A one-day lag in return series can reflect nonsynchronous trading hours rather than genuine information flow: a stock's daily close may react to BTC movements from a different calendar day, and the direction of the resulting lagged correlation depends on the exchange's trading hours relative to UTC. The lagged correlations and TE estimates in §5.1 and Table 5 are therefore potentially biased. Please provide a robustness check that aligns observations in a common time frame (e.g., using BTC returns measured over the same local trading session) or explicitly justify that the one-day lag captures information flow for all sampled exchanges.
- [§5.1, Eq. (5)] The TE significance testing is performed independently for each of the 78 directional tests, and the reported p-values are not adjusted for multiple comparisons. With a 10% test level, one expects roughly 7.8 significant results by chance across 78 tests, close to the observed 7 and 6 counts. The paper should report FDR- or family-wise-corrected p-values, or at a minimum discuss why the uncorrected counts are not treated as evidence of asymmetry. Without this, the full-sample TE significance counts in Table 5 cannot be used to support the dominance claim.
minor comments (5)
- [Abstract and Introduction] The abstract states that TE 'consistently identifies BTC as the dominant information driver' without mentioning that the asymmetry is established only for MSTR in the rolling analysis. The conclusion (§6) is appropriately MSTR-focused, so the abstract should be aligned with the evidence actually presented.
- [Appendix A, Table 3] The table is labeled 'T able 3 continued' and 'T able 3' in the text, and the footnote formatting is inconsistent. Please correct the captions and ensure the table renders as a single table.
- [§5.2, Figure 6] The classification of firms into three groups is described after the figure, and the legend does not show the group boundaries explicitly. Adding clear labels or shaded regions for the three groups would improve readability.
- [§5.3] The rolling TE windows are described as 252 trading days with daily stride, but the text does not state the effective number of independent windows or how serial overlap affects the interpretation of the 31.6% vs 13.8% significance rates. A short discussion of this would help.
- [§5.1, Table 2] The summary statistics for TE report means and standard deviations but no confidence intervals. Given the small differences, reporting bootstrap or shuffle-based confidence intervals for the mean difference would make the result more informative.
Circularity Check
No significant circularity: the paper is an empirical measurement study with no derivation that reduces to its own inputs.
full rationale
The paper performs an empirical measurement exercise: it assembles a sample of 39 BTC-holding firms, computes Pearson correlations, single-factor regressions, and transfer entropy estimates, and then interprets the resulting statistics. There is no fitted parameter that is later relabeled as a prediction, and no equation in the derivation chain is defined in terms of the quantity it purports to establish. The transfer entropy estimator in Eqs. 2-5 is a standard conditional-mutual-information measure evaluated on the data, with significance assessed by permutation surrogates; the claimed directionality is an empirical output, not a mathematical consequence of the method's definition. The single-factor beta in Eq. 6 is a regression slope, and statements such as beta = 1.37 for MSTR are direct estimates, not predictions from those estimates. Self-citations appear in the literature review and methodology references, but none is load-bearing for the central claim: the transfer-entropy framework is standard and implemented via the R package RTransferEntropy, and the paper does not invoke any uniqueness theorem or prior ansatz from the authors to force its conclusions. The main concern with the paper is interpretive rather than circular: the full-sample TE counts in Table 5 are nearly balanced (7 significant BTC-to-stock flows versus 6 significant stock-to-BTC flows at the 10% level), while the pronounced asymmetry comes from the rolling MSTR-only analysis in Section 5.3, so the headline claim that BTC 'consistently acts as the dominant information driver' overstates the aggregate evidence. Sample selection based on BTC holdings also makes positive same-day correlation partly mechanical, but this is a sample-selection and interpretation issue, not circular reasoning. Because no central claim reduces by construction to its inputs, the circularity score is 0.
Assumptions & free parameters
free parameters (4)
- Sample selection thresholds
- Rolling TE window length =
252 trading days
- TE lag =
1 day
- Significance thresholds =
10% and 5%
assumptions (4)
- standard math Shannon entropy and conditional mutual information definitions for transfer entropy
- domain assumption Wiener-Granger causality interpretation: past returns of one series improve prediction of another
- domain assumption The shuffling surrogate procedure produces a valid null distribution
- domain assumption Daily returns are stationary enough for rolling window estimation
Cite this review
Pith. "Pith review of Cryptocurrencies in the Balance Sheet: Insights from (Micro)Strategy -- Bitcoin Interactions." pith.science (2026). https://pith.science/paper/POUVNRKZ
@misc{pith2026250514655,
  author       = {Pith},
  title        = {Pith review of: Cryptocurrencies in the Balance Sheet: Insights from (Micro)Strategy -- Bitcoin Interactions},
  year         = {2026},
  howpublished = {\url{https://pith.science/paper/POUVNRKZ}},
  note         = {Machine review of arXiv:2505.14655}
}
read the original abstract
This paper investigates the evolving link between cryptocurrency and equity markets in the context of the recent wave of corporate Bitcoin (BTC) treasury strategies. We assemble a dataset of 39 publicly listed firms holding BTC, from their first acquisition through April 2025. Using daily logarithmic returns, we first document significant positive co-movements via Pearson correlations and single factor model regressions, discovering an average BTC beta of 0.62, and isolating 12 companies, including Strategy (formerly MicroStrategy, MSTR), exhibiting a beta exceeding 1. We then classify firms into three groups reflecting their exposure to BTC, liquidity, and return co-movements. We use transfer entropy (TE) to capture the direction of information flow over time. Transfer entropy analysis consistently identifies BTC as the dominant information driver, with brief, announcement-driven feedback from stocks to BTC during major financial events. Our results highlight the critical need for dynamic hedging ratios that adapt to shifting information flows. These findings provide important insights for investors and managers regarding risk management and portfolio diversification in a period of growing integration of digital assets into corporate treasuries.
Figures


Figures from the paper (4 more)



Forward citations
Cited by 1 Pith paper
-
Do Cryptocurrency Markets Differentiate Infrastructure from Regulatory Shocks? A Multi-Moment Event Study with Dependence-Robust Inference
In 15 negative crypto events (2019–2025), cumulative abnormal returns are statistically indistinguishable between infrastructure failures (−7.6%) and regulatory enforcement (−11.1%), difference +3.6 pp, p=0.81 under e...
Reference graph
Works this paper leans on
-
[1]
Illiquidity and stock returns: cross-section and time-series effects.Journal of financial markets, 5(1):31–56, 2002
Yakov Amihud. Illiquidity and stock returns: cross-section and time-series effects.Journal of financial markets, 5(1):31–56, 2002
2002
-
[2]
Cambridge University Press, 2025
Tomaso Aste.Probabilistic Data-Driven Modeling. Cambridge University Press, 2025
work page 2025
-
[3]
Transfer entropy analysis of the stock market.arXiv preprint physics/0509014, 2005
Seung Ki Baek, Woo-Sung Jung, Okyu Kwon, and Hie-Tae Moon. Transfer entropy analysis of the stock market.arXiv preprint physics/0509014, 2005
arXiv 2005
-
[4]
Bitcoin price falls below $6,000 as sell-off continues.BBC News, February 2018
BBC News. Bitcoin price falls below $6,000 as sell-off continues.BBC News, February 2018. URL https://www.bbc.co.uk/news/technology-42958325
work page 2018
-
[5]
Simon Behrendt, Thomas Dimpfl, Franziska J. Peter, and David J. Zimmermann. Rtransferentropy — quantifying information flow between different time series using effective transfer entropy.Soft- wareX, 10(100265):1–9, 2019. doi: 10.1016/j.softx.2019.100265. URLhttps://doi.org/10.1016/ j.softx.2019.100265
-
[6]
Bitcoin treasuries – current crypto assets held by institutions.https: //bitcointreasuries.net
Bitcoin Treasuries. Bitcoin treasuries – current crypto assets held by institutions.https: //bitcointreasuries.net
-
[7]
Tim Bollerslev. Generalized autoregressive conditional heteroskedasticity.Journal of econometrics, 31(3):307–327, 1986
work page 1986
-
[8]
Terry Bossomaier, Lionel Barnett, Michael Harré, Joseph T Lizier, Terry Bossomaier, Lionel Bar- nett, Michael Harré, and Joseph T Lizier.Transfer entropy. Springer, 2016. 16
work page 2016
Show all 64 references
-
[9]
Wiener–granger causality: a well established methodology
Steven L Bressler and Anil K Seth. Wiener–granger causality: a well established methodology. Neuroimage, 58(2):323–329, 2011
2011
-
[10]
PhD thesis, UCL (University College London), 2024
Antonio Briola.Deep Complex Networks: Applications in Financial Systems Modeling. PhD thesis, UCL (University College London), 2024
2024
-
[11]
Dependency structures in cryptocurrency market from high to low frequency.Entropy, 24(11):1548, 2022
Antonio Briola and Tomaso Aste. Dependency structures in cryptocurrency market from high to low frequency.Entropy, 24(11):1548, 2022
2022
-
[12]
Anatomy of a stablecoin’s failure: The terra-luna case.Finance Research Letters, 51:103358, 2023
Antonio Briola, David Vidal-Tomás, Yuanrong Wang, and Tomaso Aste. Anatomy of a stablecoin’s failure: The terra-luna case.Finance Research Letters, 51:103358, 2023
2023
-
[13]
Homological convolutional neural networks.arXiv preprint arXiv:2308.13816, 2023
Antonio Briola, Yuanrong Wang, Silvia Bartolucci, and Tomaso Aste. Homological convolutional neural networks.arXiv preprint arXiv:2308.13816, 2023
2023 arXiv
-
[14]
Hlob–information persistence and structure in limit order books.Expert Systems with Applications, 266:126078, 2025
Antonio Briola, Silvia Bartolucci, and Tomaso Aste. Hlob–information persistence and structure in limit order books.Expert Systems with Applications, 266:126078, 2025
2025
-
[15]
Accounting for the performance of microstrat- egy first decomposition.Available at SSRN 5172347, 2025
Yves Choueifaty, Tristan Froidure, and Axel Cabrol. Accounting for the performance of microstrat- egy first decomposition.Available at SSRN 5172347, 2025
2025
-
[16]
What is a bitcoin futures etf?, 2021
Coinbase. What is a bitcoin futures etf?, 2021. URLhttps://www.coinbase.com/en-gb/learn/ crypto-basics/what-is-a-bitcoin-futures-etf
2021
-
[17]
Group transfer entropy with an application to cryptocur- rencies.Physica A: Statistical Mechanics and its Applications, 516:543–551, 2019
Thomas Dimpfl and Franziska J Peter. Group transfer entropy with an application to cryptocur- rencies.Physica A: Statistical Mechanics and its Applications, 516:543–551, 2019
2019
-
[18]
Using transfer entropy to measure information flows between financial markets.Studies in Nonlinear Dynamics and Econometrics, 17(1):85–102, 2013
Thomas Dimpfl and Franziska Julia Peter. Using transfer entropy to measure information flows between financial markets.Studies in Nonlinear Dynamics and Econometrics, 17(1):85–102, 2013
2013
-
[19]
Common risk factors in the returns on stocks and bonds
Eugene F Fama and Kenneth R French. Common risk factors in the returns on stocks and bonds. Journal of financial economics, 33(1):3–56, 1993
1993
-
[20]
Tradfi investors piled $38.7b into bitcoin etfs, three times more than previous quarter.https://finance.yahoo.com/news/tradfi-investors-piled-38-7b-161934919.html, March 2025
Yahoo Finance. Tradfi investors piled $38.7b into bitcoin etfs, three times more than previous quarter.https://finance.yahoo.com/news/tradfi-investors-piled-38-7b-161934919.html, March 2025
2025
-
[21]
Mara holdings (mara): One of the best bitcoin stocks to buy.Yahoo Finance, March
Yahoo Finance. Mara holdings (mara): One of the best bitcoin stocks to buy.Yahoo Finance, March
-
[22]
Bitcoin’s 2024 performance as an asset class.Forbes, February 2025
Forbes Digital Assets. Bitcoin’s 2024 performance as an asset class.Forbes, February 2025. URLhttps://www.forbes.com/sites/digital-assets/2025/02/21/ bitcoins-2024-performance-as-an-asset-class/
2024
-
[23]
A 325% stock surge greets a tiny company’s strategy to buy solana
Suvashree Ghosh. A 325% stock surge greets a tiny company’s strategy to buy solana. Bloomberg, April 2025. URLhttps://www.bloomberg.com/news/newsletters/2025-04-22/ a-325-stock-surge-greets-a-tiny-company-s-strategy-to-buy-solana
2025
-
[24]
Investigating causal relations by econometric models and cross-spectral methods
Clive WJ Granger. Investigating causal relations by econometric models and cross-spectral methods. Econometrica: journal of the Econometric Society, pages 424–438, 1969
1969
-
[25]
Comparison of transfer entropy methods for financial time series
Jiayi He and Pengjian Shang. Comparison of transfer entropy methods for financial time series. Physica A: Statistical Mechanics and its Applications, 482:772–785, 2017. 17
2017
-
[26]
Brutal month for bitcoin as june ends with biggest drop in 11 years.CoinDesk, July 2022
Jimmy He. Brutal month for bitcoin as june ends with biggest drop in 11 years.CoinDesk, July 2022. URLhttps://www.coindesk.com/markets/2022/07/01/ brutal-month-for-bitcoin-as-june-ends-with-biggest-drop-in-11-years
2022
-
[27]
John Hyatt. The richest crypto and bitcoin billionaires in the world 2024.https://www.forbes.com/sites/johnhyatt/2024/04/02/ the-richest-crypto-and-bitcoin-billionaires-in-the-world-2024/, April 2024
2024
-
[28]
Fld stock touches 52-week low at $3.65 amid market chal- lenges.Investing.com, April 2025
Investing.com News. Fld stock touches 52-week low at $3.65 amid market chal- lenges.Investing.com, April 2025. URLhttps://www.investing.com/news/company-news/ fld-stock-touches-52week-low-at-365-amid-market-challenges-93CH-3981592. Accessed: 2025-05-06
2025
-
[29]
Characteristics of the korean stock market correlations.Physica A: Statistical Mechanics and its Applications, 361(1):263–271, 2006
Woo-Sung Jung, Seungbyung Chae, Jae-Suk Yang, and Hie-Tae Moon. Characteristics of the korean stock market correlations.Physica A: Statistical Mechanics and its Applications, 361(1):263–271, 2006
2006
-
[30]
Ponzi or pioneer? evaluating the viability of microstrategy’s bitcoin-focused model
David Krause. Ponzi or pioneer? evaluating the viability of microstrategy’s bitcoin-focused model. Evaluating the Viability of MicroStrategy’s Bitcoin-Focused Model (January 01, 2025), 2025
2025
-
[31]
Time-dependent cross-correlations between different stock returns: A directed network of influence.Physical Review E, 66(2):026125, 2002
László Kullmann, Janos Kertész, and Kimmo Kaski. Time-dependent cross-correlations between different stock returns: A directed network of influence.Physical Review E, 66(2):026125, 2002
2002
-
[32]
Granger causality detection with kolmogorov-arnold networks.arXiv preprint arXiv:2412.15373, 2024
Hongyu Lin, Mohan Ren, Paolo Barucca, and Tomaso Aste. Granger causality detection with kolmogorov-arnold networks.arXiv preprint arXiv:2412.15373, 2024
2024 arXiv
-
[33]
‘this is madness’: The 15 minutes that rocked stock markets.Bloomberg, April2025
Bailey Lipschultz, Jess Menton, and Esha Dey. ‘this is madness’: The 15 minutes that rocked stock markets.Bloomberg, April2025. URLhttps://www.bloomberg.com/news/articles/2025-04-07/ -this-is-madness-the-15-minutes-that-rocked-stock-market-desks
2025
-
[34]
Volatility dynamics analysis of bitcoin (btc-usd) and microstrategy (mstr)
Huazhuo Ma. Volatility dynamics analysis of bitcoin (btc-usd) and microstrategy (mstr). 2025
2025
-
[35]
Hierarchical structure in financial markets.The European Physical Journal B-Condensed Matter and Complex Systems, 11:193–197, 1999
Rosario N Mantegna. Hierarchical structure in financial markets.The European Physical Journal B-Condensed Matter and Complex Systems, 11:193–197, 1999
1999
-
[36]
Robert Marschinski and Holger Kantz. Analysing the information flow between financial time series: An improved estimator for transfer entropy.The European Physical Journal B-Condensed Matter and Complex Systems, 30:275–281, 2002
2002
-
[37]
Bubbles in bitcoin and ethereum: The role of halving in the formation of super cycles.Sustainable Futures, 7:100178, 2024
Gilles Brice M’bakob. Bubbles in bitcoin and ethereum: The role of halving in the formation of super cycles.Sustainable Futures, 7:100178, 2024
2024
-
[38]
Fairmarketvalueofbitcoin: Halvingeffect.Investment Management & Financial Innovations, 16(4):72, 2019
ArturMeynkhard. Fairmarketvalueofbitcoin: Halvingeffect.Investment Management & Financial Innovations, 16(4):72, 2019
2019
-
[39]
Form 8-k: Current report pursuant to section 13 or 15(d) of the securities exchange act of 1934, February 2025
MicroStrategy Incorporated. Form 8-k: Current report pursuant to section 13 or 15(d) of the securities exchange act of 1934, February 2025. URLhttps://www.sec.gov/Archives/edgar/ data/1050446/000095017025025233/mstr-20250224.htm
1934
-
[40]
Microstrategy’s software business turns profitable as bitcoin stash appreciates
Rosemarie Miller. Microstrategy’s software business turns profitable as bitcoin stash appreciates. Forbes, February 2023. URLhttps://www.forbes.com/sites/rosemariemiller/2023/02/02/ microstrategys-software-business-turns-profitable-as-bitcoin-stash-appreciates/. 18
2023
-
[41]
Cryptocurrency co-investment network: token returns reflect investment patterns.EPJ Data Science, 13(1):11, 2024
Luca Mungo, Silvia Bartolucci, and Laura Alessandretti. Cryptocurrency co-investment network: token returns reflect investment patterns.EPJ Data Science, 13(1):11, 2024
2024
-
[42]
Ranking influential and influenced stocks over time using transfer entropy networks.Physica A: Statistical Mechanics and its Applications, 630:129119, 2023
José de Paula Neves Neto and Daniel Ratton Figueiredo. Ranking influential and influenced stocks over time using transfer entropy networks.Physica A: Statistical Mechanics and its Applications, 630:129119, 2023
2023
-
[43]
Bitcoin hoarder’s stock soars 4,000% in japan after crypto rally
Bloomberg News. Bitcoin hoarder’s stock soars 4,000% in japan after crypto rally. Bloomberg, February 2025. URLhttps://www.bloomberg.com/news/articles/2025-02-10/ bitcoin-btc-hoarder-s-stock-soars-4-000-in-japan-after-crypto-rally
2025
-
[44]
Dynamics of market correlations: Taxonomy and portfolio analysis.Physical Review E, 68(5):056110, 2003
J-P Onnela, Anirban Chakraborti, Kimmo Kaski, Janos Kertesz, and Antti Kanto. Dynamics of market correlations: Taxonomy and portfolio analysis.Physical Review E, 68(5):056110, 2003
2003
-
[45]
Michael saylor’s big bet on bitcoin is inspiring copycat ceos.Bloomberg, February2025
David Pan and Bailey Lipschultz. Michael saylor’s big bet on bitcoin is inspiring copycat ceos.Bloomberg, February2025. URLhttps://www.bloomberg.com/news/articles/2025-02-19/ michael-saylor-s-big-bet-on-bitcoin-is-inspiring-copycat-ceos
2025
-
[46]
Bitcoin price hits all-time high of more than $20,000.The Guardian, December 2020
Richard Partington. Bitcoin price hits all-time high of more than $20,000.The Guardian, December 2020. URLhttps://www.theguardian.com/technology/2020/dec/16/ bitcoin-price-hits-all-time-high-of-more-than-20000
2020
-
[47]
Pearson correlation and transfer entropy in the chinese stock market with time delay.Data Science and Management, 5(3):117–123, 2022
Shaowei Peng, Wenchen Han, and Guozhu Jia. Pearson correlation and transfer entropy in the chinese stock market with time delay.Data Science and Management, 5(3):117–123, 2022
2022
-
[48]
Microstrategy, bitcoin yield, complete markets.Available at SSRN 5038109, 2024
Peter J Phillips and Gabriela Pohl. Microstrategy, bitcoin yield, complete markets.Available at SSRN 5038109, 2024
2024
-
[49]
Universal and nonuniversal properties of cross correlations in financial time series.Physical review letters, 83(7):1471, 1999
Vasiliki Plerou, Parameswaran Gopikrishnan, Bernd Rosenow, Luís A Nunes Amaral, and H Eugene Stanley. Universal and nonuniversal properties of cross correlations in financial time series.Physical review letters, 83(7):1471, 1999
1999
-
[50]
Bitcoin surges past $100,000 for the first time.Forbes, De- cember 2024
Siladitya Ray. Bitcoin surges past $100,000 for the first time.Forbes, De- cember 2024. URLhttps://www.forbes.com/sites/siladityaray/2024/12/04/ bitcoin-surges-past-100000-for-the-first-time/
2024
-
[51]
Reuters. Crypto market capitalisation hits record $3.2 tril- lion, coingecko says.https://www.reuters.com/technology/ crypto-market-capitalisation-hits-record-32-trillion-coingecko-says-2024-11-14/, November 2024
2024
-
[52]
Structure of a global network of financial companies based on transfer entropy
Leonidas Sandoval Jr. Structure of a global network of financial companies based on transfer entropy. Entropy, 16(8):4443–4482, 2014
2014
-
[53]
Interview - michael saylor, president of microstrategy: We buy as many bitcoins as possible.MarketScreener, August 2023
Michael Saylor. Interview - michael saylor, president of microstrategy: We buy as many bitcoins as possible.MarketScreener, August 2023. URLhttps: //www.marketscreener.com/quote/stock/STRATEGY-INCORPORATED-10105/news/ INTERVIEW-Michael-Saylor-President-of-MicroStrategy-We-buy-...
2023
-
[54]
Measuring information transfer.Physical review letters, 85(2):461, 2000
Thomas Schreiber. Measuring information transfer.Physical review letters, 85(2):461, 2000
2000
-
[55]
A mathematical theory of communication.The Bell system technical journal, 27(3):379–423, 1948
Claude E Shannon. A mathematical theory of communication.The Bell system technical journal, 27(3):379–423, 1948. 19
1948
-
[56]
Strategy raising another $21b to buy bitcoin, posts large q1 loss on btc price decline.Coin- Desk, May 2025
James Van Straten and Helene Braun. Strategy raising another $21b to buy bitcoin, posts large q1 loss on btc price decline.Coin- Desk, May 2025. URLhttps://www.coindesk.com/markets/2025/05/01/ strategy-raising-another-21b-to-buy-bitcoin-posts-large-q1-loss-on-btc-price-decline
2025
-
[57]
Establishment of the strategic bitcoin reserve and united states digital as- set stockpile, March 2025
The White House. Establishment of the strategic bitcoin reserve and united states digital as- set stockpile, March 2025. URLhttps://www.whitehouse.gov/presidential-actions/2025/03/ establishment-of-the-strategic-bitcoin-reserve-and-united-states-digital-asset-stockpile/
2025
-
[58]
Bitcoin’s correlation with tech stocks jumps to highest level since august.Bloomberg, May 2024
María Paula Mijares Torres. Bitcoin’s correlation with tech stocks jumps to highest level since august.Bloomberg, May 2024. URLhttps://www.bloomberg.com/news/articles/2024-05-17/ bitcoin-s-correlation-with-tech-stocks-jumps-to-highest-level-since-august
2024
-
[59]
Ftx’s downfall and binance’s consolidation: The fragility of centralised digital finance.Physica A: Statistical Mechanics and Its Applications, 625:129044, 2023
David Vidal-Tomás, Antonio Briola, and Tomaso Aste. Ftx’s downfall and binance’s consolidation: The fragility of centralised digital finance.Physica A: Statistical Mechanics and Its Applications, 625:129044, 2023
2023
-
[60]
Network filtering of spatial-temporal gnn for multivariate time- series prediction
Yuanrong Wang and Tomaso Aste. Network filtering of spatial-temporal gnn for multivariate time- series prediction. InProceedings of the Third ACM International Conference on AI in Finance, pages 463–470, 2022
2022
-
[61]
Homological neural networks: A sparse archi- tecture for multivariate complexity
Yuanrong Wang, Antonio Briola, and Tomaso Aste. Homological neural networks: A sparse archi- tecture for multivariate complexity. InTopological, Algebraic and Geometric Learning Workshops 2023, pages 228–241. PMLR, 2023
2023
-
[62]
Topological portfolio selection and optimization
Yuanrong Wang, Antonio Briola, and Tomaso Aste. Topological portfolio selection and optimization. InProceedings of the Fourth ACM International Conference on AI in Finance, pages 681–688, 2023
2023
-
[63]
The sec has approved bitcoin etfs
Jonathan Yerushalmy. The sec has approved bitcoin etfs. what are they and what does it mean for investors?The Guardian, January 2024. URLhttps://www.theguardian.com/technology/ 2024/jan/11/bitcoin-etf-approved-sec-explained-meaning-securities-regulator-tweet. A Dataset Name Ti...
2024
-
[2025]
URLhttps://finance.yahoo.com/news/mara-holdings-mara-one-best-192738062. html
Reviewed August 7, 2026 · model on record in the stance chip above.
Discussion (0). Continue with ORCID to comment.